

Abstract
Background
The Chicago Classification of esophageal motility was developed to facilitate the interpretation of clinical high resolution esophageal pressure topography (EPT) studies, concurrent with the widespread adoption of this technology into clinical practice. The Chicago Classification has been, and will continue to be, an evolutionary process, molded first by published evidence pertinent to the clinical interpretation of high resolution manometry (HRM) studies and secondarily by group experience when suitable evidence is lacking.
Methods
This publication summarizes the state of our knowledge as of the most recent meeting of the International High Resolution Manometry Working Group in Ascona, Switzerland in April 2011. The prior iteration of the Chicago Classification was updated through a process of literature analysis and discussion.
Key Results
The major changes in this document from the prior iteration are largely attributable to research studies published since the prior iteration, in many cases research conducted in response to prior deliberations of the International High Resolution Manometry Working Group. The classification now includes criteria for subtyping achalasia, EGJ outflow obstruction, motility disorders not observed in normal subjects (Distal esophageal spasm, Hypercontractile esophagus, and Absent peristalsis), and statistically defined peristaltic abnormalities (Weak peristalsis, Frequent failed peristalsis, Rapid contractions with normal latency, and Hypertensive peristalsis).
Conclusions & Inferences
The Chicago Classification is an algorithmic scheme for diagnosis of esophageal motility disorders from clinical EPT studies. Moving forward, we anticipate continuing this process with increased emphasis placed on natural history studies and outcome data based on the classification.
Introduction
High resolution esophageal pressure topography (EPT) is an evolutionary technology incorporating the combination of high resolution manometry (HRM) and pressure topography plotting in the form of Clouse plots introduced in 2000 for the clinical evaluation of esophageal motility (1). Prior to that, EPT had been developed and utilized as a highly innovative research modality (2–6). The HRM Working Group first met in San Diego during DDW 2007 with the objective of adapting EPT to the clinical evaluation of esophageal motility. Since then, a series of HRM Working Group meetings have ensued on a more-or-less annual basis to review, critique, and plan the iterative process of developing a practical classification for esophageal motility disorders based on EPT-specific metrics and criteria. The classification scheme was initially branded “The Chicago Classification” in 2007 (7) following a series of seminal publications defining key EPT metrics and interpretation criteria optimized for clinical EPT studies emanating from a group of investigators at Northwestern University in Chicago (8–11). Since then, two iterations of the Chicago Classification have been published summarizing the incremental development of the classification scheme (8, 12–13). The most recent meeting of the HRM Working Group was in Ascona, Switzerland in conjunction an international congress focused on the clinical evaluation of esophageal disease. This paper summarizes the Chicago Classification of esophageal motility disorders emanating from that meeting at the Ascona congress.
Clinical HRM study
As with conventional esophageal manometry, current HRM studies are comprised of a series of test water swallows. With HRM devices, the recording assembly is comprised of multiple closely spaced pressure sensors suitable for capturing the entirety of the deglutitive response spanning from the pharynx to the proximal stomach. Hence, only a single trans-nasal positioning of the device is necessary to accomplish the study and positioning is correct when both esophageal sphincteric regions are visualized and clearly delineated from adjacent regions. By convention, an EPT study is comprised of a series of ten test swallows of 5 ml water each, swallowed in a supine posture. Although it is certainly feasible to conduct studies in alternative postures and swallowing alternative substances, the metrics, normal values, and analysis for the Chicago Classification are currently entirely based on this convention. One avenue for further development is to expand beyond this convention. However, the diagnostic utility of such modifications will need to be established through further research.
EPT-specific metrics
The terms necessary to utilize the Chicago Classification of EPT studies are detailed in Table 1. Each metric has been developed to characterize a specific feature of deglutitive esophageal function for individual test swallows. The conceptual framework for developing these metrics (and the classification in general) was that it be based on physiological principles and that identified dysfunction is prioritized in a hierarchical fashion: 1) achalasia/EGJ dysfunction, 2) motility patterns never observed in normal subjects, and 3) peristaltic abnormalities out of the range of normal values. The overall scheme is that single test swallows are first individually scored utilizing the metrics in Table 1. The summary of that analysis for all ten swallows is then utilized to fit classification criteria and result in a manometric diagnosis.
Table 1.
Esophageal pressure topography metrics utilized in the Chicago Classification. All pressures referenced to atmospheric pressure except the integrated relaxation pressure (IRP), which is referenced to gastric pressure.
| Pressure Topography Metrics | |
|---|---|
| Metric | Description |
| IRP (mmHg) Integrated Relaxation Pressure |
Mean EGJ pressure measured with an electronic equivalent of a sleeve sensor for 4 contiguous or non-contiguous seconds of relaxation in the ten-second window following deglutitive UES relaxation. |
| DCI (mraHg-s-cm) Distal Contractile Integral |
Amplitude × duration × length (mmHg-s-cm) of the distal esophageal contraction greater than 20 mmHg from proximal (P) to distal (D) pressure troughs. |
| CDP (time, position) Contractile Deceleration Point |
The inflection point along the 30 mmHg isobaric contour where propagation velocity slows demarcating the tubular esophagus from the phrenic ampulla |
| CFV (cm/s) Contractile Front Velocity |
Slope of the tangent approximating the 30 mmHg isobaric contour between P and the CDP |
| DL(s) Distal Latency |
Interval between UES relaxation and the CDP |
| Peristaltic breaks (cm) | Gaps in the 20 mmHg isobaric contour of the peristaltic contraction between the UES and EGJ, measured in axial length |
Abnormalities of deglutitive lower esophageal sphincter (LES) relaxation are fundamental in disordered esophageal motility making this a crucial evaluation. However, from the vantage point on intraluminal manometry, the LES cannot be distinguished from other potential contributions to intraluminal pressure at the level of the esophagogastric junction (EGJ), most notably, the crural diaphragm and outflow obstruction. The latter is a novel term used to describe pathology that partially obstructs bolus passage across the EGJ leading to high intra-bolus pressure as a consequence of increased viscous resistance. Consequently the terminology ‘esophagogastric junction relaxation’ was adopted. The EPT metric developed to optimally distinguish normal from impaired EGJ relaxation is the Integrated Relaxation Pressure (IRP) (9, 11). The IRP is a complex metric as it involves accurately localizing the margins of the EGJ, demarcating the time window following deglutitive upper sphincter relaxation within which to anticipate EGJ relaxation to occur, applying an e-sleeve measurement within that 10 second time box (Figure 1) and then finding the four seconds during which the e-sleeve value was least. The IRP is the mean pressure during those four seconds, necessarily being influenced not only by LES relaxation, but also by crural diaphragm contraction and intrabolus pressure (ie outflow obstruction) in the post-deglutitive period. These four seconds are not necessarily continuous but can be scattered over the 10-second time window. Given the intricacies of this measurement, it is not surprising that normal values are specific for specific sensor types and arrays. The upper limit of normal for the IRP using the Given Imaging (Sierra) HRM assembly is 15 mmHg (9). Consistent with conventional manometry, IRP is referenced to intragastric pressure. Figure 2 is an example of outflow obstruction with a high IRP, high intrabolus pressure, but normal peristalsis. The closest equivalent to the IRP in conventional manometry is the ‘LES relaxation pressure.’
Figure 1.
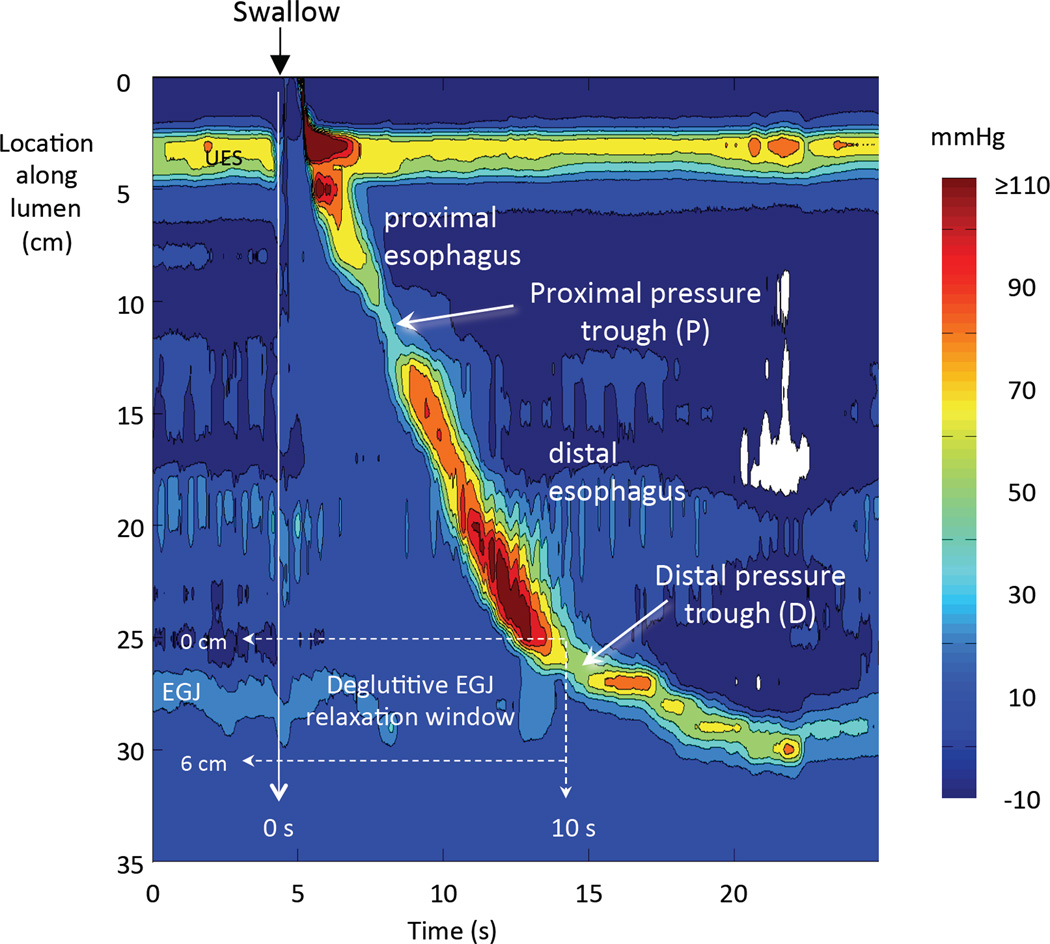
Esophageal pressure topography (Clouse plot) illustrating a normal peristaltic contraction and key landmarks used in the Chicago Classification of esophageal motility. For further description, see Table 1. P is the proximal pressure trough separating the proximal and distal contractile segments; D is the trough separating the distal esophagus from the esophagogastric junction.
Figure 2.
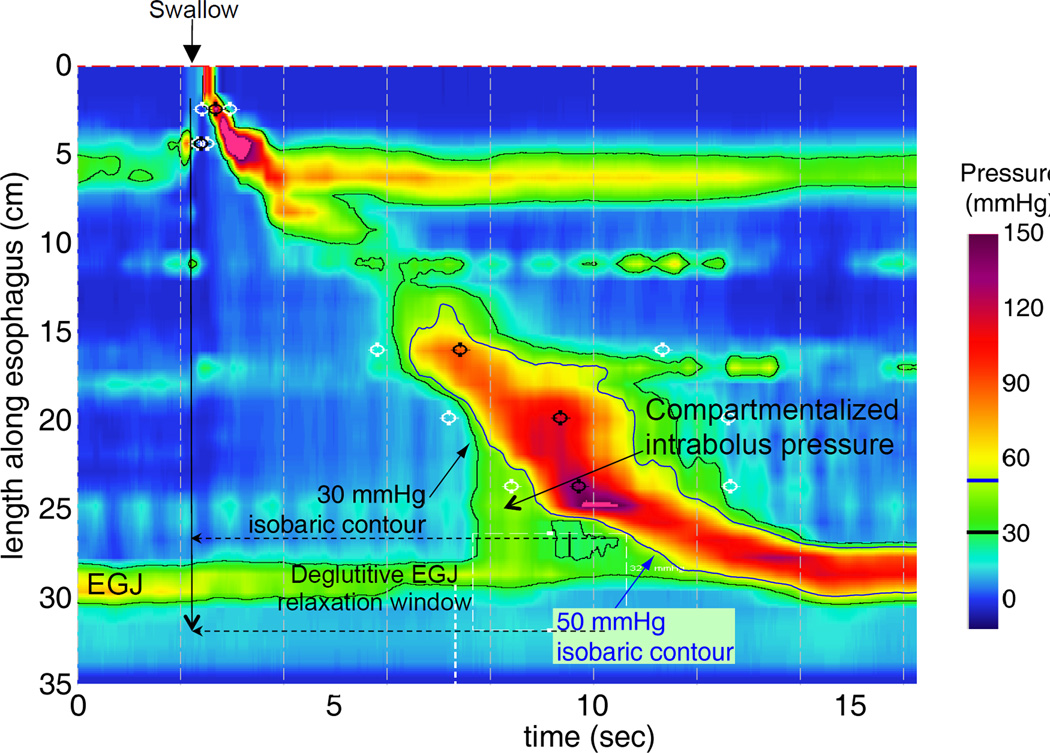
Example of elevated intrabolus pressure with high IRP and normal peristalsis. To illustrate the point, two isobaric contours are highlighted, 30 mmHg (black line) and 50 mmHg (blue line). Note that the EGJ pressure never falls below 30 mmHg and never goes above 50 mmHg indicating that the IRP is between these boundaries (actual value 43 mmHg). Hence, compartmentalized intrabolus pressure develops between the advancing peristaltic contraction and the EGJ outflow obstruction. In circumstances such as this the contractile front velocity must be measured at an isobaric contour value that is greater than EGJ pressure (50 mmHg in this case) so as to not erroneously high intrabolus pressure as indicative of a rapid contraction.
The EPT metric devised to summarize the vigor of the distal esophageal contraction is the Distal Contractile Integral (DCI), measured for the segment spanning from the proximal to distal pressure trough or to the EGJ (Figure 1). When the contraction is conceptualized as a solid, with pressure amplitude conferring height to the isobaric contours in Figure 1, the DCI can be conceptualized as the volume of the pressure from P to D (or to the proximal margin of the EGJ when D is not clearly discernible), thereby being sensitive to the length of that span, as well as the amplitude and duration of the contraction at each locus along the way (10). To exclude the effects of intrabolus pressure in the DCI computation, the first 20 mmHg is ignored (10, 13). Consequently, if a swallow was not associated with any recorded pressure >20 mmHg in the P to D span, the DCI for that swallow would be zero. However, keep in mind that the DCI was devised primarily to identify swallows of excessive contractile vigor making the upper rather than the lower limit of normal the more relevant limit. The upper limit of normal defined by the 95th percentile in a normal population is 5,000 mmHg-s-cm, whereas when defined as the value never encountered in a normal population it is 8,000 mmHg-s-cm (13–14). The nearest equivalent of the DCI in conventional manometry is the ‘peristaltic amplitude.’
The next three variables in Table 1, the Contractile Deceleration Point (CDP), the Contractile Front Velocity (CFV), and the Distal Latency (DL) all pertain to the rate of contractile propagation in the distal esophagus. Fundamental to understanding these is the CDP, a concept introduced to account for the transition from peristaltic propagation to the late phase of esophageal emptying illustrated with combined pressure topography and fluoroscopy in Figure 3. The late phase of esophageal emptying proceeds much more slowly than does peristalsis and is both mechanistically and visually distinct (15). Consequently the CFV is measured for the segment preceding the CDP to be reflective of the peristaltic mechanism proper. Similarly, the DL is measured from the time of upper sphincter relaxation to the CDP, again making it reflective of peristaltic timing and the period of deglutitive inhibition (16, 17) rather than the late phase of esophageal emptying (18).
Figure 3.
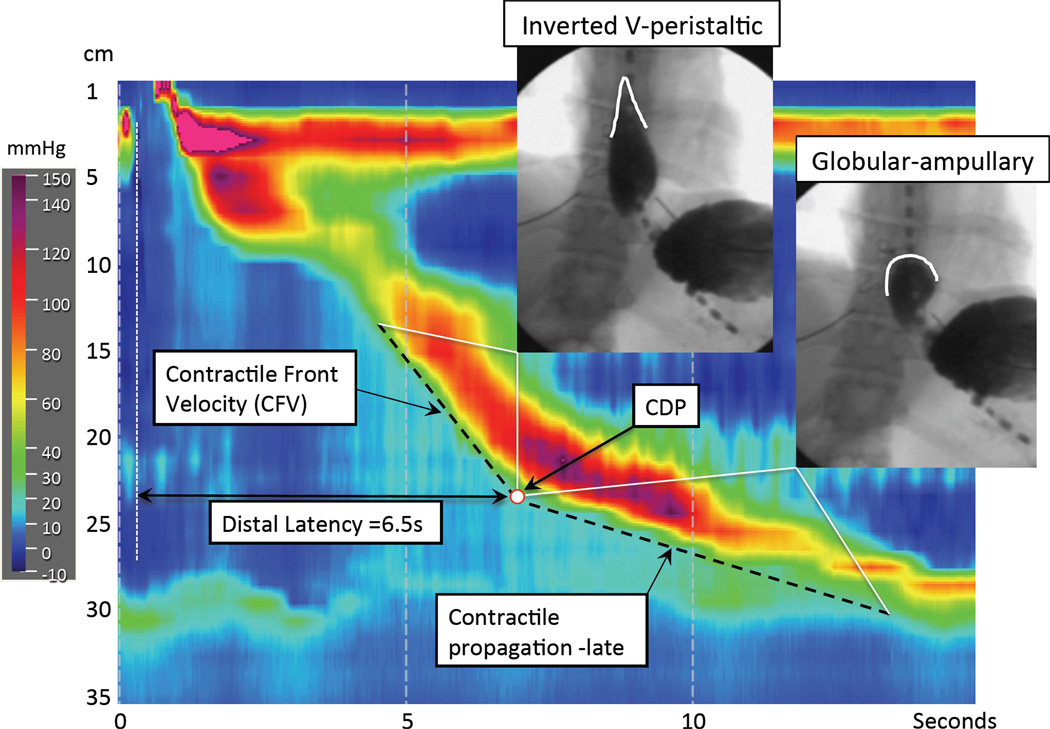
Functional significance of the Contractile Deceleration Point (CDP). Prior to the CDP, esophageal emptying is by a peristaltic stripping wave, imaged fluoroscopically as an inverted ‘V’ with the point of the ‘V’ corresponding to the upstroke of the peristaltic contraction at each locus. Peristalsis ends in the region of the CDP. After that, esophageal emptying is completed through formation and emptying of the globular shaped phrenic ampulla. This proceeds much more slowly and is not completed until the LES has recovered its pre-swallow position within the hiatal canal. The contractile front velocity (CFV) is calculated only on the segment of the EPT tracing preceding the CDP.
The last pressure topography characteristic detailed in Table 1 is of the presence and length of breaks in the 20 mmHg isobaric contour, sometimes referred to as pressure troughs or the transition zone between the proximal and distal esophageal segments (2, 19, 20). Large (≥5 cm) and to a lesser degree small (2–5 cm) gaps represent loci of extreme hypotensive peristalsis and have been shown to correlate with incomplete bolus transit at those loci (21, 22).
Applying EPT metrics to score individual swallows
The metrics detailed in Table 1 are applied to characterize each test swallow in terms of the integrity of the contraction, the contraction pattern, and intrabolus pressure pattern of as summarized in Table 2. Note that not every test swallow can be scored in terms of contraction pattern as this domain pertains only to swallows with either intact peristalsis or weak peristalsis with small breaks in the 20 mmHg isobaric contour. Furthermore, in other instances, the contraction pattern can exhibit one two or even all three of the patterns described (eg a hypercontractile, rapid, premature contraction).
Table 2.
Esophageal pressure topography scoring of individual swallows.
| Integrity of Contraction | |
|---|---|
| Intact contraction | 20 mmHg isobaric contour without large or small break |
| Weak contraction |
|
| Failed peristalsis | Minimal (<3 cm) integrity of the 20 mmHg isobaric contour distal to the proximal pressure trough (P) |
| Contraction Pattern (for intact or weak peristalsis with small breaks) | |
| Premature contraction | DL < 4.5 s |
| Hypercontractile | DCI >8,000 mmHg-s-cm |
| Rapid contraction | CFV >9 cm/s |
| Normal contraction | Not achieving any of the above diagnostic criteria |
| Intrabolus Pressure Pattern (30 mmHg isobaric contour) | |
| Panesophageal pressurization | Uniform pressurization extending from the UES to the EGJ |
| Compartmentalized esophageal pressurization | Pressurization extending from the contractile front to a sphincter |
| EGJ Pressurization | Pressurization restricted to zone between the LES and CD in conjunction with hiatus hernia |
| Normal pressurization | No bolus pressurization >30 mmHg |
As delineated in Table 2, the integrity of the contraction associated with each swallow describes how completely that contraction spans from the upper sphincter to the EGJ, irrespective of the vigor of the contraction, velocity of propagation, or latency. These qualifiers fall under the contraction pattern that is subsequently characterized. Weak contractions can be subtyped according to the location of the breaks (proximal, middle, or distal pressure troughs), although given the absence of evidence suggesting unique implications to one or another subtype, these subtypes are currently not distinguished in the classification of weak peristalsis (21). Similarly, a contraction characterized as hypercontractile (DCI >8,000 mmHg-s-cm) can be subtyped as single peaked or multipeaked or non-multipeaked and synchronized with respiration or not (14). However, the unique feature of hypercontractile contractions is that they are never observed in normal individuals, irrespective of subtype and in the absence of clinical differentiation among these subsets, these distinctions are not carried forward into the overall classification.
The final characterization of the test swallows summarized in Table 2 pertains to the pattern of intrabolus pressure, using the threshold of 30 mmHg relative to atmospheric pressure to identify potentially significant intrabolus pressure (23–26). A fundamental distinction, the importance of which cannot be overemphasized, is between intrabolus pressure, recorded from within a compartment trapped between two loci of greater amplitude contraction and rapid contraction, which implies no necessary downstream obstruction. The extreme example is panesophageal pressurization, spanning from the upper sphincter to the EGJ and potentially occurring early (within 2 s) or late (> 2s) relative to the pharyngeal contraction (27). When occurring in the context of achalasia, panesophageal pressurization is the consequence of a distinct motor pattern characterized by contraction of both sphincters and of the intervening esophageal longitudinal muscle, but without lumen-obliterating contraction of the circular muscle in the inter-sphincteric span (28).
Applying the Chicago Classification of esophageal motility
After characterization of the test swallows, the summary of that analysis is used to fit the Chicago Classification of esophageal motility detailed in Table 3 and illustrated as a flow diagram in Figure 4. An important caveat to this is that this classification is of primary esophageal motility disorders and is not intended to include post-surgical studies, for instance after fundoplication, laparoscopic gastric banding, or Heller myotomy. Although EPT studies are certainly done in those clinical circumstances, and the findings of those studies can be characterized in the terms of Table 1 and Table 2, the interpretation of post-operative studies needs to be considered in the context of the specific operative history, each of which can be associated with a unique set of potential secondary motility disturbances. Similarly, in the case of achalasia, subtyping applies to patients prior to having definitive achalasia treatment to disrupt the LES. Again, EPT studies are certainly done after treatment for achalasia, and the findings of those studies can be characterized in the terms of Table 1 and Table 2, but the interpretation needs to be considered in the context of the individual’s specific treatment history. Finally, the classification detailed in Table 3 and Figure 4 pertains to peristaltic function of the distal esophageal segment; it does not include the pharynx, UES, proximal esophageal segment, or the EGJ in the context of reflux barrier function. These topics are slated for future discourse.
Table 3.
The Chicago Classification of esophageal motility
| DIAGNOSIS | DIAGNOSTIC CRITERIA |
|---|---|
| Achalasia | |
| Type I achalasia | Classic achalasia: mean IRP > upper limit of normal, 100% failed peristalsis |
| Type II achalasia | Achalasia with esophageal compression: mean IRP > upper limit of normal, no normal peristalsis, panesophageal pressurization with ≥20% of swallows |
| Type III achalasia | Mean IRP > upper limit of normal, no normal peristalsis, preserved fragments of distal peristalsis or premature (spastic) contractions with ≥20% of swallows |
| EGJ outflow obstruction | Mean IRP > upper limit of normal, some instances of intact peristalsis or weak peristalsis with small breaks such that the criteria for achalasia are not met† |
| Motility Disorders | (Patterns not observed in normal individuals) |
| Distal esophageal spasm | Normal mean IRP, ≥20% premature contractions |
| Hypercontractile esophagus (Jackhammer esophagus) | At least one swallow DCI > 8,000 mmHg-s-cm with single peaked or multipeaked ontraction†† |
| Absent peristalsis | Normal mean IRP, 100% of swallows with failed peristalsis |
| Peristaltic abnormalities | (Defined by exceeding statistical limits of normal) |
| Weak peristalsis with large peristaltic defects | Mean IRP <15 mmHg and >20% swallows with large breaks in the 20 mmHg isobaric contour (>5 cm in length) |
| Weak peristalsis with small peristaltic defects | Mean IRP <15 mmHg and >30% swallows with small breaks in the 20 mmHg isobaric contour (2–5 cm in length) |
| Frequent failed peristalsis | >30%, but <100% of swallows with failed peristalsis |
| Rapid contractions with normal latency | Rapid contraction with ≥20% of swallows, DL >4.5 s |
| Hypertensive peristalsis (Nutcracker esophagus) | Mean DCI > 5,000 mmHg-s-cm, but not meeting criteria for hypercontractile esophagus |
| Normal | Not achieving any of the above diagnostic criteria |
May be a variant form of achalasia, indicative of wall stiffness consequent from an infiltrative disease, or manifestation of hiatal hernia in which case it can be subtyped to CD or LES
The locus of the multipeaked contraction can be in either of the distal two contractile segments or very rarely in the LES, but is usually this is in the third contractile segment. May coexist with EGJ outflow obstruction
Figure 4.
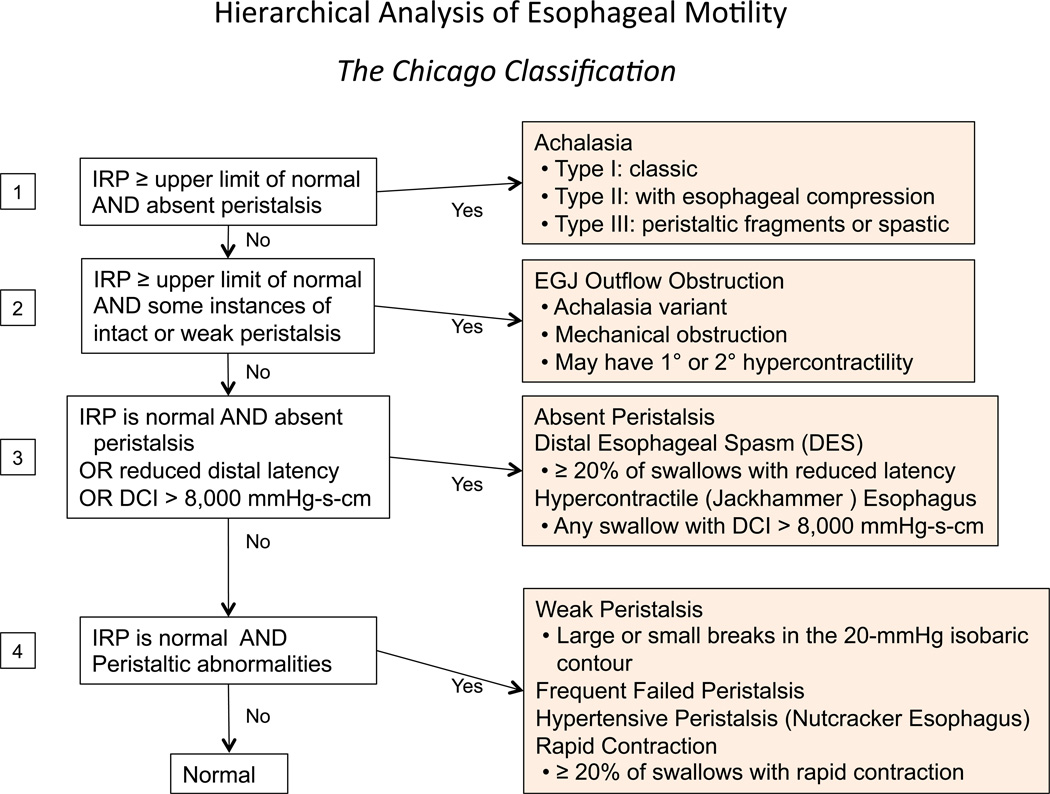
Flow diagram illustrating the hierarchical analysis of EPT studies according to the Chicago Classification. Note that primary motility disorders should be considered as a cause of dysphagia and/or chest pain after first evaluating for structural disorders, eosinophilic esophagitis and, where appropriate, cardiac disease. The first branch point identifies patients meeting criteria for achalasia (elevated IRP and absent peristalsis), which is then sub-classified. Patients meeting partial criteria for achalasia or exhibiting swallow-induced contractions with short latency or hypercontractility to a degree never encountered in normal subjects are then characterized. Note that some of these patients likely have variant forms of achalasia. The last branch point in the algorithm is to identify individuals with abnormalities of peristalsis defined by being outside of statistical norms. However, these abnormalities may be encountered in a normal population and their ultimate clinical significance remains to be established.
The organization of Table 3 is prioritized top to bottom, with the most significant diagnoses bolded on top leading to the hierarchical analysis illustrated in Figure 4. A unifying attribute of the bolded diagnoses in the top half of Table 3 and the first two branch points of Figure 4 is that they are not encountered in normal subjects. Although the clinical implications of the conditions at the second branch point of Figure 4 are generally less clear than in the case of achalasia, each is strongly associated with symptoms, particularly dysphagia, supporting the validity of the designations. The evidence is less clear for the non-bolded entities comprising the lower half of Table 3. In these instances, the conditions identified are uniformly outside of statistical norms, but the strength of association with esophageal symptoms is less and there are instances in which each may be encountered in normal subjects.
The most fundamental measurement for utilizing Table 3 is the IRP. More so than any other measurement, this influences diagnostic categorization. However, the IRP is also the most technology-sensitive of the Table 1 metrics. Consequently, it is important to emphasize that the designation ‘greater than the upper limit of normal’ is used in Table 3 in differentiating abnormal from normal EGJ relaxation. The IRP was described and evaluated using the Sierra (Sierra Scientific Instruments Inc., Los Angeles, CA) adult version circumferential HRM sensing device (subsequently acquired by Given Imaging) and the upper limit of normal for the IRP using this device is a mean of 15 mmHg in a supine posture (9). Appropriate cutoff values for other sensing devices need to be established.
One of the novel features of the classification in Table 3 compared to conventional manometric diagnoses is the differentiation of achalasia into three subtypes (27, 29–30) with the addition of ‘EGJ outflow obstruction’ as an additional potential achalasia phenotype (24). This sub-categorization is based upon the recognition that these subtypes carry implications either to the efficacy of treatment (27, 29–30), the certainty of diagnosis (24, 31), and very likely, the evolution of the disease. Hence, ‘classic achalasia’ includes the spectrum from a hugely dilated esophagus to one with borderline characteristics of ‘Type II’ and distinguishing ‘Type III’ from ‘EGJ outflow obstruction’ ultimately depends upon the point at which one judges a residual contraction in the distal esophagus as a ‘fragment of peristalsis’ in one case or ‘weak peristalsis with a small break’ in the other. Such judgments can be subjective. However, this is the clinical reality and these nuances should not distract the practitioner from the bright side, which is that the overwhelming majority of cases are more neatly defined.
Other novelties of the classification in Table 3 pertain to the definition of ‘distal esophageal spasm’ and the differentiation of ‘hypercontractile esophagus’ from ‘hypertensive peristalsis.’ In the case of ‘distal esophageal spasm’ the revised criterion stems from the observation that the conventional criterion based on contraction velocity was heterogeneous and very non-specific, encompassing many instances of ‘weak peristalsis’. On the other hand, the criterion based of distal contractile latency performed much better (32). In the case of ‘hypercontractile esophagus’, nicknamed ‘jackhammer esophagus’ because the contractions are usually repetitive, the distinction is that, not only are the contractions vigorous, but to a degree not observed in normal subjects (14). On the other hand, ‘hypertensive peristalsis’, popularly known as ‘nutcracker esophagus’ requires only that the contraction amplitude exceed the 95th percentile of normal which is, by definition, observed in five percent of a normal population.
Finally, the classification of weak peristalsis in Table 3 differentiates ‘frequent failed peristalsis’ from frequent occurrences of weakened peristaltic contractions with either small or large breaks. These categorizations are based upon an analysis of a large clinical dataset that found weakened peristalsis but not ‘frequent failed peristalsis’ to correlate with an increased prevalence of dysphagia (21). Of note, both patterns of contraction are associated with impaired bolus transit as determined by concurrent high resolution impedance manometry (21, 33).
Summary
The Chicago Classification of esophageal motility was developed to facilitate the interpretation of clinical EPT studies, concurrent with the widespread adoption of HRM and EPT into clinical practice. The Chicago Classification has been, and will continue to be, an evolutionary process, molded first by published evidence and secondarily by group experience when suitable evidence is lacking. This publication summarizes the state of our knowledge as of the most recent meeting of the International High Resolution Manometry Working Group in Ascona, Switzerland in April 2011. The major changes in this document from the prior iteration (13) are largely attributable to research studies published since the prior iteration, in many cases research conducted in response to prior deliberations of the International High Resolution Manometry Working Group. Moving forward, we anticipate continuing this process with increased emphasis placed on natural history studies and outcome data based on the developing classification.
Acknowledgements
Albert J Bredenoord is supported by The Netherlands Organisation for Scientific Research (NWO). Mark Fox and Werner Schwizer are supported by the Zurich Centre for Integrative Human Physiology. Peter J Kahrilas and John E Pandolfino are supported by R01 DK56033 and R01 DK079902 from the US Public Health Service
AJB received speaking fees from MMS International and AstraZeneca and received grant support from Movetis, Shire, Endostim, and AstraZeneca. JEP serves as a consultant for Given Imaging.
Footnotes
-
○The European Society of Neurogastroenterology and Motility (ESNM) Steering Committee
-
○The European Society of Esophagology (ESE) Executive Committee
-
○Oesophageal, Neurogastroenterology and Motility and Associated GI Physiologists subcommittees of the British Society of Gastroenterology (BSG)
Solicited endorsements pending: AGAI, ACG, ANMS, ASGE, ISDE, SAGES, UEGF
Author Contributions
AJB assisted in critiquing, editing, and refining the paper
MF assisted in critiquing, editing, and refining the paper
PJK performed the initial literature search, wrote the initial draft of the paper and managed the integration of coauthor contributions
JEP assisted in critiquing, editing, and refining the paper
WS assisted in critiquing, editing, and refining the paper
All members of the HRM Working Group reviewed the final manuscript and approved of its content
Disclosures
There are no financial or professional disclosures relevant to either the meetings of the HRM working group or the synthesis of this paper for any of the authors.
References
- 1.Clouse RE, Staiano A, Alrakawi A, Haroian L. Application of topographical methods to clinical esophageal manometry. Am J Gastroenterol. 2000;95:2720–2730. doi: 10.1111/j.1572-0241.2000.03178.x. [DOI] [PubMed] [Google Scholar]
- 2.Clouse RE, Staiano A. Topography of the esophageal peristaltic pressure wave. Am J Physiol. 1991;261:G677–G684. doi: 10.1152/ajpgi.1991.261.4.G677. [DOI] [PubMed] [Google Scholar]
- 3.Clouse RE, Staiano A. Topography of normal and high-amplitude esophageal peristalsis. Am J Physiol. 1993;265:G1098–G1107. doi: 10.1152/ajpgi.1993.265.6.G1098. [DOI] [PubMed] [Google Scholar]
- 4.Staiano A, Clouse RE. The effects of cisapride on the topography of oesophageal peristalsis. Aliment Pharmacol Ther. 1996;10:875–882. doi: 10.1046/j.1365-2036.1996.94266000.x. [DOI] [PubMed] [Google Scholar]
- 5.Clouse RE, Staiano A, Alrakawi A. Topographic analysis of esophageal double-peaked waves. Gastroenterology. 2000;118:469–476. doi: 10.1016/s0016-5085(00)70252-6. [DOI] [PubMed] [Google Scholar]
- 6.Clouse RE, Staiano A, Alrakawi A. Development of a topographic analysis system for manometric studies in the gastrointestinal tract. Gastrointest Endosc. 1998;48:395–401. doi: 10.1016/s0016-5107(98)70010-0. [DOI] [PubMed] [Google Scholar]
- 7.Fox MR, Bredenoord AJ. Oesophageal high-resolution manometry: moving from research into clinical practice. Gut. 2008;57:405–423. doi: 10.1136/gut.2007.127993. [DOI] [PubMed] [Google Scholar]
- 8.Pandolfino JE, Ghosh SK, Rice J, Clarke JO, Kwiatek MA, Kahrilas PJ. Classifying esophageal motility by pressure topography characteristics: a study of 400 patients and 75 controls. Am J Gastroenterol. 2008;103:27–37. doi: 10.1111/j.1572-0241.2007.01532.x. [DOI] [PubMed] [Google Scholar]
- 9.Ghosh SK, Pandolfino JE, Rice J, Clarke JO, Kwiatek M, Kahrilas PJ. Impaired deglutitive EGJ relaxation in clinical esophageal manometry: a quantitative analysis of 400 patients and 75 controls. Am J Physiol Gastrointest Liver Physiol. 2007;293:G878–G885. doi: 10.1152/ajpgi.00252.2007. [DOI] [PubMed] [Google Scholar]
- 10.Ghosh SK, Pandolfino JE, Zhang Q, Jarosz A, Shah N, Kahrilas PJ. Quantifying esophageal peristalsis with high-resolution manometry: a study of 75 asymptomatic volunteers. Am J Physiol Gastrointest Liver Physiol. 2006;290:G988–G997. doi: 10.1152/ajpgi.00510.2005. [DOI] [PubMed] [Google Scholar]
- 11.Pandolfino JE, Ghosh SK, Zhang Q, Jarosz A, Shah N, Kahrilas PJ. Quantifying EGJ morphology and relaxation with high-resolution manometry: a study of 75 asymptomatic volunteers. Am J Physiol Gastrointest Liver Physiol. 2006;290:G1033–G1040. doi: 10.1152/ajpgi.00444.2005. [DOI] [PubMed] [Google Scholar]
- 12.Kahrilas PJ, Ghosh SK, Pandolfino JE. Esophageal motility disorders in terms of pressure topography: the Chicago Classification. J Clin Gastroenterol. 2008;42:627–635. doi: 10.1097/MCG.0b013e31815ea291. [DOI] [PMC free article] [PubMed] [Google Scholar]
- 13.Pandolfino JE, Fox MR, Bredenoord AJ, Kahrilas PJ. High-resolution manometry in clinical practice: utilizing pressure topography to classify oesophageal motility abnormalities. Neurogastroenterol Motil. 2009;21:796–806. doi: 10.1111/j.1365-2982.2009.01311.x. [DOI] [PMC free article] [PubMed] [Google Scholar]
- 14.Roman S, Pandolfino JE, Chen J, Boris L, Luger D, Kahrilas PJ. Phenotypes and clinical context of hypercontractility in high resolution esophageal pressure topography (EPT) Am J Gastroenterol. 2011 doi: 10.1038/ajg.2011.313. In Press. [DOI] [PMC free article] [PubMed] [Google Scholar]
- 15.Pandolfino JE, Leslie E, Luger D, Mitchell B, Kwiatek MA, Kahrilas PJ. The contractile deceleration point: an important physiologic landmark on oesophageal pressure topography. Neurogastroenterol Motil. 2010;22:395–400. doi: 10.1111/j.1365-2982.2009.01443.x. [DOI] [PMC free article] [PubMed] [Google Scholar]
- 16.Sifrim D, Janssens J, Vantrappen G. A wave of inhibition precedes primary peristaltic contractions in the human esophagus. Gastroenterology. 1992;103(3):876–882. doi: 10.1016/0016-5085(92)90020-y. [DOI] [PubMed] [Google Scholar]
- 17.Behar J, Biancani P. Pathogenesis of simultaneous esophageal contractions in patients with motility disorders. Gastroenterology. 1993;105(1):111–118. doi: 10.1016/0016-5085(93)90016-6. [DOI] [PubMed] [Google Scholar]
- 18.Roman S, Lin Z, Pandolfino JE, Kahrilas PJ. Distal Contraction Latency: A measure of propagation velocity optimized for esophageal pressure topography studies. Am J Gastroenterol. 2011;106:443–451. doi: 10.1038/ajg.2010.414. [DOI] [PMC free article] [PubMed] [Google Scholar]
- 19.Ghosh SK, Janiak P, Schwizer W, Hebbard GS, Brasseur JG. Physiology of the esophageal pressure transition zone: separate contraction waves above and below. Am J Physiol Gastrointest Liver Physiol. 2006;290(3):G568–G576. doi: 10.1152/ajpgi.00280.2005. [DOI] [PubMed] [Google Scholar]
- 20.Ghosh SK, Pandolfino JE, Kwiatek MA, Kahrilas PJ. Oesophageal peristaltic transition zone defects: real but few and far between. Neurogastroenterol Motil. 2008;20(12):1283–1290. doi: 10.1111/j.1365-2982.2008.01169.x. [DOI] [PMC free article] [PubMed] [Google Scholar]
- 21.Roman S, Lin Z, Kwiatek MA, Pandolfino JE, Kahrilas PJ. Weak peristalsis in esophageal pressure topography: classification and association with dysphagia. Am J Gastroenterol. 2011;106:349–356. doi: 10.1038/ajg.2010.384. [DOI] [PMC free article] [PubMed] [Google Scholar]
- 22.Ghosh SK, Janiak P, Fox M, Schwizer W, Hebbard GS, Brasseur JG. Physiology of the oesophageal transition zone in the presence of chronic bolus retention: studies using concurrent high resolution manometry and digital fluoroscopy. Neurogastroenterol Motil. 2008;20(7):750–759. doi: 10.1111/j.1365-2982.2008.01129.x. [DOI] [PubMed] [Google Scholar]
- 23.Ghosh SK, Kahrilas PJ, Lodhia N, Pandolfino JE. Utilizing intraluminal pressure differences to predict esophageal bolus flow dynamics. Am J Physiol Gastrointest Liver Physiol. 2007;293:G1023–G1028. doi: 10.1152/ajpgi.00384.2007. [DOI] [PubMed] [Google Scholar]
- 24.Scherer JR, Kwiatek MA, Soper NJ, Pandolfino JE, Kahrilas PJ. Functional esophagogastric junction obstruction with intact peristalsis: a heterogeneous syndrome sometimes akin to achalasia. J Gastrointest Surg. 2009;13:2219–2225. doi: 10.1007/s11605-009-0975-7. [DOI] [PMC free article] [PubMed] [Google Scholar]
- 25.Fox M, Hebbard G, Janiak P, et al. High-resolution manometry predicts the success of oesophageal bolus transport and identifies clinically important abnormalities not detected by conventional manometry. Neurogastroenterol Motil. 2004;16:533–542. doi: 10.1111/j.1365-2982.2004.00539.x. [DOI] [PubMed] [Google Scholar]
- 26.Fox M, Menne D, Stutz B, Fried M, Schwizer W. The effects of tegaserod on oesophageal function and bolus transport in healthy volunteers: studies using concurrent high-resolution manometry and videofluoroscopy. Aliment Pharmacol Ther. 2006;24:1017–1027. doi: 10.1111/j.1365-2036.2006.03090.x. [DOI] [PubMed] [Google Scholar]
- 27.Pandolfino JE, Kwiatek MA, Nealis T, Bulsiewicz W, Post J, Kahrilas PJ. Achalasia: a new clinically relevant classification by high-resolution manometry. Gastroenterology. 2008;135:1526–1533. doi: 10.1053/j.gastro.2008.07.022. [DOI] [PMC free article] [PubMed] [Google Scholar]
- 28.Hong SJ, Bhargava V, Jiang Y, Denboer D, Mittal RK. A unique esophageal motor pattern that involves longitudinal muscles is responsible for emptying in achalasia esophagus. Gastroenterology. 2010 doi: 10.1053/j.gastro.2010.03.058. [DOI] [PMC free article] [PubMed] [Google Scholar]
- 29.Salvador R, Costantini M, Zaninotto G, et al. The preoperative manometric pattern predicts the outcome of surgical treatment for esophageal achalasia. J Gastrointest Surg. 2010;14:1635–1645. doi: 10.1007/s11605-010-1318-4. [DOI] [PubMed] [Google Scholar]
- 30.Pratap N, Kalapala R, Darisetty S, et al. Achalasia cardia subtyping by high-resolution manometry predicts the therapeutic outcome of pneumatic balloon dilatation. J Neurogastroenterol Motil. 2011;17:48–53. doi: 10.5056/jnm.2011.17.1.48. [DOI] [PMC free article] [PubMed] [Google Scholar]
- 31.Pandolfino JE, Kwiatek MA, Ho K, Scherer JR, Kahrilas PJ. Unique features of esophagogastric junction pressure topography in hiatus hernia patients with dysphagia. Surgery. 2010;147:57–64. doi: 10.1016/j.surg.2009.05.011. [DOI] [PMC free article] [PubMed] [Google Scholar]
- 32.Pandolfino JE, Roman S, Carlson D, et al. Distal esophageal spasm in high resolution esophageal pressure topography: defining clinical phenotypes. Gastroenterology. 2011;141:469–475. doi: 10.1053/j.gastro.2011.04.058. [DOI] [PMC free article] [PubMed] [Google Scholar]
- 33.Bulsiewicz WJ, Kahrilas PJ, Kwiatek MA, Ghosh SK, Meek A, Pandolfino JE. Esophageal pressure topography criteria indicative of incomplete bolus clearance: a study using high-resolution impedance manometry. Am J Gastroenterol. 2009;104:2721–2728. doi: 10.1038/ajg.2009.467. [DOI] [PMC free article] [PubMed] [Google Scholar]