

Summary
CT plays an important role in diagnosis of lung cancer, however has been limited by uncertain diagnostic rate for early stage of non–small-cell lung cancer (NSCLC), particularly central tumors. Genetic analysis of sputum has proven to be useful in diagnosis of NSCLC. We proposed to evaluate efficacy of combing CT and genetic analysis of sputum for noninvasive diagnosis of stage I NSCLC. Genomic copy changes of a panel of lung cancer-related genes, HYAL2, FHIT, p16, and SP-A were analyzed by a mini-chip in sputum from 33 patients with stage I NSCLC and 49 cancer-free controls. The genetic and CT diagnoses were compared with surgical-pathologic stage. CT had higher sensitivity (85%) in detection of lung cancer compared with the mini-chip (70%) (p<0.05), while there was no significant difference in specificity between the two tests (89 vs. 92%, p=0.09). Similarly, CT showed considerably higher sensitivity (93%) in identifying peripheral tumors than did the mini-chip (64%) (p<0.05), whereas there was no difference in specificity between them (98 vs. 96%, p=0.28). However, in detecting central tumors, CT had lower specificity (90%) compared with the mini-chip (98%) (P<0.05), although its sensitivity (79%) was higher than that of the mini-chip (73%) (P=0.05). Combining both tests offered higher sensitivity (91%) than did any single one (85%, 70%, all <0.05), while still keeping 92% sensitivity. In particular, this combined approach yielded higher sensitivity, specificity, and accuracy for diagnosing central cancers compared with CT alone (all p<0.05). The integration of the genetic assay with CT led to improvements in noninvasive diagnosis of stage I NSCLCs, especially central tumors.
Keywords: Genetic analysis, sputum, CT, lung cancer, diagnosis
Introduction
Non–small-cell lung cancer (NSCLC) is the second most common cancer and the number one cancer killer in the USA and worldwide (1). In men, the mortality of lung cancer exceeds the combined total of prostate, colon, and pancreatic cancer and in women, the combined total of breast and colon cancers (1). The overall 5-year survival rate for stage I NSCLC patients who are typically treated with surgery remain up to 80%. In contrast, only 5-15% and less than 2% of patients with stage III and IV NSCLC are alive after five years (1). The ability to identify early stage lung cancer patients who would benefit most from effective therapies will reduce the mortality. Chest X -ray has been used for the early detection of lung cancer, however, the sensitivity is low (2). Although bronchoscopy excels at detecting centrally occurring lung tumor, it is invasive technique (3). Therefore, accurately identify lung tumors earlier by noninvasive means has been an important goal for lung cancer management and treatment.
Computed tomography (CT) provides excellent anatomic information and plays an increasing role in noninvasive diagnosis of lung cancer (3). However, it has limited ability to differentiate between benign and malignant lesions for tumors, particularly centrally located cancer (4). Therefore, the development of new noninvasive approaches that can complement CT imaging in more accurately identifying lesions, especially arising in the central airways, is urgently needed.
Because morphological changes of exfoliated bronchial epithelium from sputum are associated with incident lung cancer, sputum cytology has been used for noninvasively detecting lung cancer, especially tumors arising in central airway areas (5). However, the technique depends solely on the skills required for identifying subtle nuclear changes in cells, thus the sensitivity is very low (2, 6).
Instead of subjectively observing cellular morphological characterization, molecular genetic study of sputum could identify the cells containing tumor-related genetic aberrations. Therefore, the approach has been suggested to be more sensitive than cytology in diagnosis of lung cancer (6, 7). Using high-resolution comparative genomic hybridization-microarrays, we previously defied a set of genetic signatures whose changes are associated with early stage lung cancer (8, 9). We further demonstrated that combined assessment of deletions of two of the signatures, HYAL2 and FHIT, could detect abnormal cells not only in all the cytologically positive sputum, but also in 55% cytologically negative sputum from lung cancer patients (10). The results suggested that genetic analysis of sputum might provide a noninvasive and sensitive diagnostic tool for lung cancer. Furthermore, taking advantage of the developments in microarray and multicolor fluorescent dye labeling, and based on the principle of in situ hybridization, we developed a mini-chip assay that could simultaneously examine genetic abnormalities of a panel of genes (11, 12). In addition, we recently used magnetic-assisted cell sorting to enrich bronchial epithelial cells from sputum, providing a useful technique to improve efficiency of cytological and molecular genetic analysis of the easily accessible specimen for lung cancer diagnosis (13).
The goal of this study was to evaluate the diagnostic efficacy of CT of the chest and the mini-chip genetic analysis of sputum combined in parallel for the early detection of NSCLC patients. Our results demonstrated that application of the mini-chip would be complement to CT and lead to improvements in noninvasive diagnosis of stage I NSCLC.
Materials and Methods
Patients
Between September 2005 and September 2007, NSCLC patients who were treated by surgical resection at the University of Maryland Medical Center and Baltimore VA Medical Center participated in the study. The eligible cancer subjects were 33 patients with surgical-pathologic diagnosed staged I NSCLC. Patients were excluded if they were diagnosed with Stage II and more advance NSCLC. In the same institutions, 49 cancer-free subjects were also recruited from patients who had received primary care and underwent fiberoptic bronchoscopy and chest X-ray for other diseases than lung cancer. The cancer-free individuals were used as controls. The research was approved by an institutional review board. Information on sociodemographic characteristics was obtained using an interviewer-administered questionnaire.
Collection and processing of sputum
Sputum was collected from all cancer patients and controls, and bronchial epithelial cells were subsequently enriched as described in our recent reports (10, 13). Cytocentrifuge slides were made from the samples by using a cytospin machine (Shandon, Inc., Pittsburgh, PA) (10, 13). The main variables used to select slides for the study were high cellularity, good nuclear morphology, and lack of purulence, debris, and residual cytoplasm (10, 13). The slides were then fixed in fresh methanol and glacial acetic acid and stored at –20°C for the following genetic analysis by using a mini-chip assay.
Mini-chip assay
A mini-chip consisted of four genetic probes specific for HYAL2 (3p21.3), FHIT (3p14.2), p16 (9p21), and SP-A (10q22), respectively, and three centromeic probes (CEPs) for the chromosomes the genes locate on. The specific probes for the genes and mini-chip were designed and made according to our previous studies (10-2). The CEP 3, 9, and 10 were purchased from Vysis (Vysis, Downers Grove, Ill) and used as internal controls for assessing changes of the genetic targets. Hybridization of the min-chip on the specimens and postwashing were done as previously described (10-3). The slides were examined under microscopes equipped with appropriate filter sets (Leica Microsystems, Buffalo, NY). Cells (2,000) were counted on each slide. More or less signals from the specific gene probe than from the corresponding control probe indicated a gain or loss, respectively, of the gene. The criteria for defining a positive cell with abnormal signals was used as the one established in our previously published reports (10-3). Briefly, a cell that has three or more copies or exhibits hemizygous or homozygous loss of a gene is considered as positive cell. Percentage of the positive cells in a given sample was considered a genetic aberration value (GAV) to measure degree of the genetic abnormalities of the sample.
To determine inter-observer and intra-observer reproducibility of the mini-chip, first, two slides of specimens from 10 cancer-free individuals and 10 cancer patients were analyzed by the assay at 3-month intervals. Second, two investigators performed experiments on the slides prepared from the same 20 subjects with 2–5 days interval. The results were compared to determine the concordance between different tests on the same samples.
Computed tomography (CT)
CT was performed as part of clinical standard care using a protocol with a 120-KV, 220-mA tomoscan (model Somatom Plus 4; Seimens; Munich, Germany), which administered a total of 16.5 mGy of radiation. Briefly, a tomogram and images were taken from the lung apices to the top of the kidneys at a speed of 1.0 seconds per rotation in helical motion. The slice thickness was 5 mm through the mediastinum (from the top of the aorta caudal to 2 cm below the bifurcation of the main stem bronchus) and 8 mm elsewhere. One hundred milliliters of Optiray 240 (St. Louis, MO) was administered as the intravenous contrast agent at 1.5 mL per second. The images were reconstructed using the Kernal protocols of AB50 for the mediastinum and AB82 Lo for the lung windows. Radiologists were blinded to the molecular genetic analysis. Two independent readings were obtained from each test and discrepancies solved by consensus.
Clinical Diagnosis of lung cancer
The 33 patients with stage I NSCLC underwent thoracotomy with attempted resection. The surgical-pathologic staging of the cancer cases was determine according to the TNM classification of the International Union Against Cancer (UICC) with the American Joint Committee on Cancer (AJCC) and the International Staging System for Lung Cancer that was revised in 1997 (14-5). The location of nodules was recorded with regard to central or peripheral (within 2 cm of costal pleura) site (16). The 49 control subjects were clinically diagnosed with no any cancer and their cancer-free status was followed for at least 12 months.
Statistical Analysis
The sample size was determined based on a case-control study consisting of cancer and cancer-free subjects. The area under receiver operating characteristic curve (AUROC) of H0 (the null hypothesis) was set at 0.5. H1 represented the alternative hypothesis; accordingly, at least 28 patients were required in each category to show a minimum difference of interest between an AUROC of 0.75 versus an AUROC of 0.5 with 80% power at the 5% significance level (17). Therefore, the group assignment in the study with 33 cancer cases and 49 controls should give enough statistical analysis power. Receiver-operator characteristic (ROC) curve analysis (15) was done using genetic aberration value (GAV) for each gene tested in sputum from the cases and controls. Using this approach, the AUROC identified optimal sensitivity and specificity levels at which to distinguish control subjects from cancer patients. By this approach, corresponding GAV cutoff was also calculated for each gene. The cutoff value was applied to define the frequency of the change in each category. Overall accuracy was also calculated by summing the true positives plus true negatives divided by the total number of individuals tested. Furthermore, contingency table and logistic regression analysis was performed to determine the associations between the genetic aberrations and clinicopathologic and demographic characteristics of the cases and controls. In addition, to determine the intra- and interobserver reproducibility of the genetic assay, agreement among different experiments on the samples were measured by calculating the kappa coefficient. Database editing and statistical analyses were performed using SAS (SAS software 8.02 SAS Institute Inc, Cary, NC). Differences with P < 0.05 were deemed significant.
Results
Patient characteristics
Characteristics of the subjects enrolled in this study are compiled in Table 1. Of the 33 stage I NSCLC patients, there were 17 adenocarcinomas (AC), 12 squamous cell carcinomas (SC), and 4 large cell carcinomas (LC). There were 19 tumors locating at central airways, and 14 at peripheral areas. The mean age of the NSCLC patients was 68 ± 9 year old and 23 (69%) were males. The average number of pack-years of the NSCLC patients was 36 ± 25. The 49 cancer-free subjects included 32 with chronic obstructive pulmonary disease, 15 with pneumonia, and 2 with pulmonary tuberculosis. The cancer-free subjects consisted of 31 males (63%), and patient age ranged from 60 to 82 years. The average number of pack-years (39 ± 19) of the control subjects was 32 ± 22.
Table 1.
Demographics in cases and controls.
| Primary NSCLC (n = 33) | Controls (n = 49) | |
|---|---|---|
| Age* | 68 (59-77) | 69 (60-82) |
| Sex | ||
| Female | 11 | 18 |
| Male | 23 | 31 |
| Smoking status | 31 smokers | 45 smokers |
| Pack-years | 36 ± 25 | 32 ± 22 |
| Location of tumor | ||
| Central | 19 | |
| Peripheral | 14 | |
| Stage | All are stage I | |
| Histology | ||
| AC of lung | 17 | |
| SC of lung | 12 | |
| LC of lung | 4 |
Abbreviations: AC, adenocarcinoma; SC, squamous cell carcinoma, LC, large cell carcinomas.
Data are presented as median (range).
Diagnosis of lung cancer by the mini-chip assay
The mini-chip analysis was successfully performed in all sputum samples obtained from the cancer and cancer-free individuals. All four genes, if showing abnormality, had deletions that were presented with fewer numbers of signals for the probes of the genes than those of the control CEP probes (Fig. 1. FISH image). ROC curves wit corresponding AUROCs for the genetic aberrations in cancer patients versus that from cancer-free subjects were made. As shown in Fig. 2, the deletions of each gene in sputum demonstrated discriminative ROC curve profiles, which could distinguish cancer patients from control subjects (all p < 0.001).
Fig.1.

Genetic analysis of exfoliated cells from sputum by the mini-chip for genomic copy changes of HYLA2, FHIT, p16, and SP-A. A, bronchial epithelial cells enriched from sputum of a healthy control shows two green signals of the HYAL2 probe (thick solid green arrow), two yellow signals from the FHIT probe (thick solid yellow arrow), and two red signals of the CEP3 probe (thin red arrow) that is used as internal control for assessing changes of the genetic targets. B, bronchial epithelium obtained from a lung cancer patient shows hemizygous deletions of HYAL2 or FHIT (one green or yellow signal, two red spots) or homozygous deletion of HYAL2 or FHIT (no green or yellow signal, two red signals). C, sputum from a healthy individual shows two green signals from the SP-A probe (thick solid green arrow) and two red spots from the CEP10 probe (thin red arrow). D, bronchial epithelium obtained from a lung cancer patient shows homozygous deletion of SP-A (no green signal and two red signals) and hemizygous deletion of SP-A (one green signal and two red signals). Original magnification, ×400.
Fig. 2.
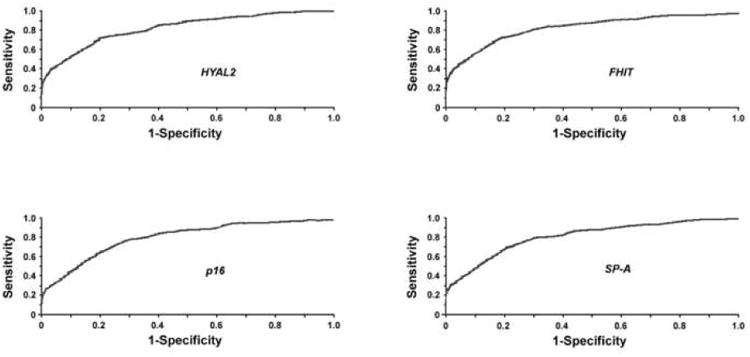
ROC curve analysis of the genetic deletions in sputum of cancer-free vs. cancer subjects for HYLA2, FHIT, p16, and SP-A. The AUROC for each gene is shown and conveys each gene's accuracy in distinguishing cancer-free controls from cancer patients in terms of its sensitivity and specificity (all p < 0.001).
To achieve a high sensitivity while still maintaining specificity above 95%, the cutoff GAVs for HYAL2, FHIT, p16, and SP-A chosen from these ROC curves were 12%, 11%, 13%, and 9% (Table 2). Based on the cutoff GAVs, HYAL2 deletions were found in 11 of 33 and 1 of 49 sputum samples from cancer patients and cancer-free subjects, respectively. FHIT deletions were discovered in 12 of 33 cancer patients, 2 of 49 cancer-free controls. p16 deletions were found in 9 of 33 and 2 of 49 cancer patients and cancer-free individuals. SP-A deletions occurred in 10 of 33 cancer patients' samples, while in 1 of 49 control specimens. As a result, sensitivity and specificity in diagnosis of the stage I NSCLCs by testing changes of each gene ranged between 27% and 36%, and 96% and 98%, respectively (Table 2). Combining all the genetic aberrations by using ROC and their AUROC analysis produced a sensitivity of 70% in the diagnosis of lung cancer, being higher than that by any single one (all p<0.05), while having specificity at 92% (Table 2 and 3). Furthermore, the sensitivity and specificity are 73% and 98% for central tumor, 64% and 96% for peripheral cancer, respectively (Table 3). Therefore, the genetic assay had higher accuracy in detecting central tumors (93%) than peripherally located cancer (87%) (p<0.05). The three cancer-free subjects whose sputum was positive for the genetic aberrations were heavy tobacco smokers who had more than 45 pack-year smoking history.
Table 2. Frequencies of deletion of the four genes in the cases and controls.
| Gene | Cutoff GAV | Cancer-free samples (49) | Cancer samples (33) | Sensitivity | Specificity |
|---|---|---|---|---|---|
| HYAL2 | 12% | 1 | 11 | 33% | 98% |
| FHIT | 11% | 2 | 12 | 36% | 96% |
| P16 | 13% | 2 | 9 | 27% | 96% |
| SP-A | 9% | 1 | 10 | 30% | 98% |
Cutoff GAV for each gene was determined by ROC curve analysis.
Table 3. Comparison and synergetic value of the mini-chip and CT for lung cancer diagnosis.
| Mini-chip* | CT | Combined CT and mini-chip | |||||||
|---|---|---|---|---|---|---|---|---|---|
|
|
|
|
|||||||
| Sensitivity | Specificity | Accuracy | Sensitivity | Specificity | Accuracy | Sensitivity | Specificity | Accuracy | |
|
|
|
|
|||||||
| All tumors | 70% | 92% | 84% | 85% | 89% | 86% | 91% | 92% | 90% |
| Central tumors | 73% | 98% | 93% | 79% | 90% | 87% | 86% | 96% | 94% |
| Peripheral tumors | 64% | 96% | 87% | 93% | 98% | 97% | 89% | 95% | 92% |
The sensitivity and specificity of combining all the genetic aberrations were obtained by using ROC and their AUROC analysis.
Agreement among different tests on the samples performed by different personnel at different time courses showed kappa co-efficiency within 0.81 and 0.86, suggesting that the mini-chip assay had very high inter-observer and intra-observer reproducibility.
To further define association of the genetic aberrations with clinical and demographic characteristics of all participants, we used a univariate analysis. As shown in Table 4, levels of the genetic deletions were statistically significantly related to the tumors locating in more central airway areas and SC of lung as well (all <0.05). In addition, the overall genetic changes was also statistically significantly associated with more pack-year of smoking (all <0.05).
Table 4. Univariate analysis of clinical parameters associated with the genetic results.
| Genes | Parameter OR (95% CI), P* | ||||
|---|---|---|---|---|---|
|
|
|||||
| Age | Sex | Smoking pack-years | Central tumors | SC of lung | |
| HYAL2 | 1.64 (0.57 to 3.87), 0.39 | 2.06 (0.82 to 5.13), 0.13 | 1.81 (0.79 to 3.98), 0.01 | 1.97 (0.85 to 4.65), 0.04 | 2.06 (1.03 to 3.78), 0.01 |
| FHIT | 1.27 (0.49 to 2.48), 0.32 | 1.11 (0.52 to 2.45), 0.23 | 1.13 (0.53 to 2.62), 0.03 | 1.68 (0.99 to 3.59), 0.01 | 2.64 (1.26 to 5.62), 0.01 |
| P16 | 1.37 (0.65 to 2.76), 0.26 | 2.13 (0.98 to 4.29), 0.33 | 1.62 (0.84 to 3.33), 0.01 | 2.62 (0.96 to 4.88), 0.02 | 0.76 (0.38 to 1.69), 0.03 |
| SP-A | 1.34 (0.68 to 2.55), 0.40 | 1.48 (0.68 to 2.94), 0.48 | 1.55 (0.88 to 2.64), 0.02 | 1.89 (0.10 to 3.59), 0.03 | 0.56 (0.32 to 1.98), 0.04 |
Abbreviations: OR, odds ratio; CI, confidence interval, SC, squamous cell carcinoma.
All P values are two-sided (chi-square test), and P≤0.05 was considered statistically significant.
Legends
Diagnosis of lung cancer by CT
CT scan identified 28 of the 33 lung cancer cases, including 13 peripheral lung tumors and 15 central tumors. However, CT also considered six cancer-free subjects to be cancer patients, including five with central lung tumor and one with peripheral tumor. Therefore, the overall sensitivity, specificity, and accuracy of CT were 85%, 89%, and 86%, respectively (Table 3). Furthermore, CT showed substantially higher sensitivity (93%), specificity (98%), and accuracy (97%) in diagnosis of peripheral tumors than central cancers (79%, 90%, and 87%, all p<0.05). In addition, a univariate analysis also demonstrated that the result of CT was associated with location of tumors: positive rate of CT was statistically significantly associated with peripherally located tumors (p=0.02, OR = 3.6, 95% CI = 1.8 to 8.4).
Comparison and synergetic value of the mini-chip assay and CT for stage I lung cancer diagnosis
CT had higher sensitivity (85%) in diagnosis of the whole cancer cases than did the mini-chip (70%) (p<0.05), although there was no statistically significant difference in specificity between the two tests (89 vs. 92%, p=0.07) (Table 3). Likewise, for identifying peripheral tumors, CT showed considerably higher sensitivity (93%) compared with the mini-chip (64%) (p<0.05), whereas there was no significant difference in specificity between them (98 vs. 96%, p=0.28) (Table 3). However, in detecting central respiratory tumors, CT produced lower specificity (90%) compared with CT (98%) (P<0.05), although it had slightly higher sensitivity (79%) than did CT (73%) (P=0.05). Interestingly, combining both the mini-chip and CT provided higher sensitivity (91%) than any single one (85%, 70%, all <0.05), while still keeping 92% sensitivity (Table 3). More importantly, integrating the mini-chip with CT yielded higher sensitivity (86%), specificity (96%), and accuracy (94%) for diagnosing central lung cancers than did CT alone (79%, 90%, 87%, all p<0.05) (Table 3). In addition, the combined approach could substantially improve diagnostic accuracy (90%) compared with CT (86%) or the mini-chip (84%) in diagnosis of whole stage I lung cancer (all P<0.05). Taken together, the results implied that analysis of the genetic aberrations in sputum by the mini-chip would provide a useful complementary tool to CT for noninvasively identifying lung cancer, particularly the tumors arising in central airways.
Discussion
In this study, we demonstrated that although CT imaging had overall higher diagnostic sensitive and specificity than did the mini-chip, it was less certain for identifying the tumors arising in the central airways. However, integration of the mini-chip assay with CT would lead to significant improvements in noninvasive identification of lung cancer earlier, especially central lung tumors. Therefore, the genetic analysis of sputum using the mini-chip might supplement CT scan for lung cancer early diagnosis.
Lung tumor is genetically heterogeneous and develops from a multistep process driven by critical molecular genetic alterations. It is thus believed that well-designed and-controlled genetic biomarkers could provide a useful approach for lung cancer early detection (3, 6-7). The panel of the genetic probes included in the mini-chip was selected based on the relevance of the gene targets in the pathogenesis of lung tumors (17-22) and our previously identified genetic signatures for primary lung cancer (8-9). HYAL2 is one of several key genes in chromosome 3p21.3 region associated with tumor suppression (17). The homozygous deletions in 3p21.3, including HYAL2, occurred in 10-18% of both lung tumor tissues and cancer cell lines tested (18). The FHIT encompasses the common fragile site FRA3B on chromosome 3, where carcinogen-induced damage can lead to translocations and aberrant transcripts of this gene (19). FHIT inactivation has been found in about half of esophageal, stomach, and colon carcinomas tested (19). In agreement with the observations in our previous research using dual-fluorescence in situ hybridization assay (10), the results obtained from the newly developed mini-chip in this current study showed that the deletions of HYAL2 and FHIT were consistently present in sputum collected from an independent cohort of lung cancer patients. The data again imply that the detection of HYAL2 and FHIT lesions in sputum could be potential genetic test for the early diagnosis of lung cancer. p16 is a well-known important tumor suppressor gene, which regulates roles of CDK4 and p53 in cell cycle G1 progression (20). p16 locates on 9p21 and is frequently deleted in a wide variety of tumors including lung carcinogeneisis (20). SP-A is the most abundant of the four surfactant-specific proteins known to be part of the pulmonary surfactant system (21). The gene is located on 10q22 that is one of the regions most frequently associated with genomic imbalances in lung cancer (21-2). In our previous study, the SP-A deletions were found in 87% of the carcinoma tissues of lung, and significantly associated with increases in the risk of lung cancer relapse (22). Katz et al. recently found that the SP-A genomic deletions detected in sputum cells could predict the presence of lung cancer (23). In the present research, we showed that both p16 and SP-A deletions were found in sputum from lung cancer patients and might be potential biomarkers for the early diagnosis of lung cancer.
Simultaneously and comprehensively evaluating changes of the set of lung cancer-related genes by the mini-chip produced 70% sensitivity and 92% specificity. This finding further characterizes and extends our previous research efforts to develop sputum-based diagnostic tool for lung cancer (10, 13). More importantly, the resulted data from the current study provided evidence that using the panel of markers could be a potential noninvasive tool for identifying lung cancer earlier. Furthermore, the results from the mini-chip assays at 3-month intervals by different staff showed high kappa coefficient, implying that the mini-chip might be a high reproducible and reliable diagnostic technique. In addition, as a small and cost-effective platform, the mini-chip would efficiently and rapidly translate the new biomarkers developed from genomic profiling data by microarray analysis into an inexpensive test for lung cancer diagnosis. The technique might also potentially be applied to other biological fluids for validating and translating newly identified biomarkers for early diagnosis and prediction of treatment response and outcomes of lung cancer patients in future. Moreover, other technological developments, e.g., hardware and software for automated signal enumeration, are being developed and would greatly facilitate the use of the mini-chip as diagnostic tool in clinical settings. For example, Katz et al. used an automated fluorescent dot-counting system to analyze genetic probes tested on sputum and found that the system could rapidly identify cancer cells with high sensitivity, specificity, and efficiency (23). We are planning to integrate the automated dot-counting system into the mini-chip to develop a robust and objective genetic assay.
Three sputum samples collected from the cancer-free individuals were also positive for the genetic aberrations. All the cancer-free subjects whose sputum had the genetic deletions were heavy tobacco smokers with more than 45 pack-year smoking history. Consistently, a univariate analysis demonstrated that there was an association of the genetic deletions with number of smoking pack-years in cancer patients. The data suggested that these lung cancer-related genetic aberrations might reflect chronic exposure to tobacco carcinogens. In the future, development of a new mini-chip assay with genes those are highly specific for lung cancer detection may continue to improve both the sensitivity and specificity of the mini-chip assay.
CT provides very good anatomic imaging, but has limitations in uncertain diagnostic rate for early stage of lung cancer, particularly central airway tumors (4). This justifies the requirement for a new diagnostic technique of such lesions with suspicious imaging features. In this research, we mainly aimed to determine whether testing genetic aberrations by the mini-chip using sputum could improve efficacy of CT for noninvasive diagnosis of early stage lung cancer. As expected, CT imaging was found to perform better with high sensitivity for detecting stage I lung cancer, especially peripheral cancers. However, CT had high false positive and negative rate in detecting central airway tumors, resulting in a comparable low specificity (73%). Interestingly, the weaknesses could be addressed by the mini-chip with the panel of genetic biomarkers, because the combination of the genetic data with CT images substantially improved sensitivity from 73% to 86%, while still maintaining an acceptable specificity (96%) in identifying centrally located lung tumors. Furthermore, the synergetic values might also be found in the detection of whole stage I lung cancer as well as peripheral tumors. The genetic analysis of sputum had high accuracy in diagnosis of central tumors and the changes were closely associated with SC of lung. Possible explanation for the observation might be that either cancers per se or fields of abnormal cells that are found with cancer were more likely to exfoliate abnormal cells into the sputum if they were located in the more central airways, most of which are SC type, than in the periphery of the lung, most of which were AC type (24). Therefore, given outstanding anatomic resolution of CT, the integration the genetic assay with CT imaging would have important clinical significance, because future application of both techniques in parallel could efficiently help clinicians in case finding, and/or making decisions about the management of CT-detected abnormalities of undetermined importance.
To conclude, by making explicit noninvasive detection of early stage lung cancer contributed by the CT scan and genetic analysis of sputum, we have demonstrated the complement between the two diagnostic modalities can be utilized to improve overall diagnostic accuracy. In particular, the mini-chip assay could be as adjunct to CT in finding lesions in central airways. In an ongoing study, we are undertaking a multicenter clinical trial in a large population to comprehensively validate our current findings. Furthermore, positron emission tomography (PET) has been suggested to have sensitivity of 95% and a specificity of 70-85% in diagnosis of lung cancer (25-6). We are planning to carry out a study by integrating the mini-chip with CT and PET systems for a simultaneous genetic, morphologic, and functional imaging strategy for noninvasively diagnosing early stage lung tumor with high accuracy.
Acknowledgments
Grant support: This work was supported in part by National Cancer Institute (NCI) grants CA-135382, CA-137742, and CA-133956, Wendy Will Case Cancer Award, an award from The University of Maryland Statewide Health Network, seed money from American Cancer Society Institutional Research Grant, Associate Member Award from NCI-The Early Detection Research Network, and an clinical innovator award from Flight Attendant Medical Research Institute (all to F. J.).
Footnotes
A Conflict of Interest Statement. All authors have no potential conflict of interest relevant to this manuscript was reported.
Publisher's Disclaimer: This is a PDF file of an unedited manuscript that has been accepted for publication. As a service to our customers we are providing this early version of the manuscript. The manuscript will undergo copyediting, typesetting, and review of the resulting proof before it is published in its final citable form. Please note that during the production process errors may be discovered which could affect the content, and all legal disclaimers that apply to the journal pertain.
References
- 1.Greenlee RT, Hill-Harmon MB, Murray T, et al. Cancer statistics, 2001. CA Cancer J Clin. 2001;51:15–36. doi: 10.3322/canjclin.51.1.15. [DOI] [PubMed] [Google Scholar]
- 2.Frost JK, Ball WC, Jr, Levin ML, et al. Early lung cancer detection: results of the initial (prevalence) radiologic and cytologic screening in the Johns Hopkins study. Am Rev Respir Dis. 1984;130:549–554. doi: 10.1164/arrd.1984.130.4.549. [DOI] [PubMed] [Google Scholar]
- 3.Hirsch FR, Franklin WA, Gazdar AF, Bunn PA., Jr Early detection of lung cancer: clinical perspectives of recent advances in biology and radiology. Clin Cancer Res. 2001;7:5–22. [PubMed] [Google Scholar]
- 4.Toloza EM, Harpole L, McCrory DC. Noninvasive staging of non-small cell lung cancer: a review of the current evidence. Chest. 2003;123:137S–146S. doi: 10.1378/chest.123.1_suppl.137s. [DOI] [PubMed] [Google Scholar]
- 5.Saccomanno G, Archer VE, Auerbach O, Saunders RP, Brennan LM. Development of carcinoma of the lung as reflected in exfoliated cells. Cancer. 1974;33:256–70. doi: 10.1002/1097-0142(197401)33:1<256::aid-cncr2820330139>3.0.co;2-g. [DOI] [PubMed] [Google Scholar]
- 6.Thunnissen FB. Sputum examination for early detection of lung cancer. J Clin Pathol. 2003;11:805–810. doi: 10.1136/jcp.56.11.805. [DOI] [PMC free article] [PubMed] [Google Scholar]
- 7.Belinsky SA. Gene-promoter hypermethylation as a biomarker in lung cancer. Nat Rev Cancer. 2004;4:707–717. doi: 10.1038/nrc1432. [DOI] [PubMed] [Google Scholar]
- 8.Jiang F, Yin Z, Caraway NP, Li R, Katz RL. Genomic profiles in stage I primary non small cell lung cancer using comparative genomic hybridization analysis of cDNA microarrays. Neoplasia. 2004;6:623–35. doi: 10.1593/neo.04142. [DOI] [PMC free article] [PubMed] [Google Scholar]
- 9.Li R, Wang H, Bekele BN, Yin Z, Caraway NP, Katz RL, et al. Identification of putative oncogenes in lung adenocarcinoma by a comprehensive functional genomic approach. Oncogene. 2006;18:2628–35. doi: 10.1038/sj.onc.1209289. [DOI] [PubMed] [Google Scholar]
- 10.Li R, Todd NW, Qiu Q, Fan T, Zhao RY, Rodgers WH, et al. Genetic deletions in sputum as diagnostic markers for early detection of stage I non-small cell lung cancer. Clin Cancer Res. 2007;13:482–7. doi: 10.1158/1078-0432.CCR-06-1593. [DOI] [PubMed] [Google Scholar]
- 11.Li R, Liu Z, Fan T, Jiang F. A novel multiple FISH array for the detection of genetic aberrations in cancer. Lab Invest. 2006;86:619–27. doi: 10.1038/labinvest.3700408. [DOI] [PubMed] [Google Scholar]
- 12.Jiang F. United States Patent 20070178503. In-situ genomic DNA chip for detection of cancer. 2007
- 13.Qiu Q, Todd NW, Li R, Peng H, Liu Z, Yfantis HG, et al. Magnetic enrichment of bronchial epithelial cells from sputum for lung cancer diagnosis. Cancer. 2008;114:275–83. doi: 10.1002/cncr.23596. [DOI] [PMC free article] [PubMed] [Google Scholar]
- 14.Brambilla E, Travis WD, Colby TV, Corrin B, Shimosato Y. The new World Health Organization classification of lung tumours. Eur Respir J. 2001;18:1059–68. doi: 10.1183/09031936.01.00275301. [DOI] [PubMed] [Google Scholar]
- 15.Mountain CF. Revisions in the International System for Staging Lung Cancer. Chest. 1997;6:1710–7. doi: 10.1378/chest.111.6.1710. [DOI] [PubMed] [Google Scholar]
- 16.Diederich S, Wormanns D, Semik M, Thomas M, Lenzen H, Roos N, et al. Screening for early lung cancer with low-dose spiral CT: prevalence in 817 asymptomatic smokers. Radiology. 2002;222:773–81. doi: 10.1148/radiol.2223010490. [DOI] [PubMed] [Google Scholar]
- 17.Lerman MI, Minna JD. The 630-kb lung cancer homozygous deletion region on human chromosome 3p21.3: identification and evaluation of the resident candidate tumor suppressor genes. The International Lung Cancer Chromosome 3p21. 3 Tumor Suppressor Gene Consortium. Cancer Res. 2000;60:6116–33. [PubMed] [Google Scholar]
- 18.Senchenko VN, Liu J, Loginov W, Bazov I, Angeloni D, Seryogin Y, et al. Discovery of frequent homozygous deletions in chromosome 3p21.3 LUCA and AP20 regions in renal, lung, and breast carcinomas. Oncogene. 2004;29:5719–28. doi: 10.1038/sj.onc.1207760. [DOI] [PubMed] [Google Scholar]
- 19.Croce CM, Sozzi G, Huebner K. Role of FHIT in human cancer. J Clin Oncol. 1999;17:1618–24. doi: 10.1200/JCO.1999.17.5.1618. [DOI] [PubMed] [Google Scholar]
- 20.Iwakawa R, Kohno T, Anami Y, Noguchi M, Suzuki K, Matsuno Y, et al. Association of p16 homozygous deletions with clinicopathologic characteristics and EGFR/KRAS/p53 mutations in lung adenocarcinoma. Clin Cancer Res. 2008;12:3746–53. doi: 10.1158/1078-0432.CCR-07-4552. [DOI] [PubMed] [Google Scholar]
- 21.Bruns G, Stroh H, Veldman GM, Latt SA, Floros J. The 35 kd pulmonary surfactant-associated protein is encoded on chromosome 10. Hum Genet. 1987;76:58–62. doi: 10.1007/BF00283051. [DOI] [PubMed] [Google Scholar]
- 22.Jiang F, Caraway NP, Nebiyou Bekele B, Zhang HZ, Khanna A, Wang H, et al. Surfactant protein A gene deletion and prognostics for patients with stage I non-small cell lung cancer. Clin Cancer Res. 2005;11:5417–24. doi: 10.1158/1078-0432.CCR-04-2087. [DOI] [PubMed] [Google Scholar]
- 23.Katz RL, Zaidi TM, Fernandez RL, Zhang J, He W, Acosta C, et al. Automated detection of genetic abnormalities combined with cytology in sputum is a sensitive predictor of lung cancer. Mod Pathol. 2008;8:950–60. doi: 10.1038/modpathol.2008.71. [DOI] [PMC free article] [PubMed] [Google Scholar]
- 24.Byers T, Wolf HJ, Franklin WA, Braudrick S, Merrick DT, Shroyer KR, et al. Sputum cytologic atypia predicts incident lung cancer: defining latency and histologic specificity. Cancer Epidemiol Biomarkers Prev. 2008;17:158–62. doi: 10.1158/1055-9965.EPI-07-0436. [DOI] [PubMed] [Google Scholar]
- 25.Wallace MB, Pascual JM, Raimondo M, Woodward TA, McComb BL, Crook JE, et al. Minimally invasive Endoscopic Staging of Suspected Lung Cancer. JAMA. 2008;299:540–6. doi: 10.1001/jama.299.5.540. [DOI] [PubMed] [Google Scholar]
- 26.Vansteenkiste JF, Stroobants SS. PET scan in lung cancer: current recommendations and innovation. J Thorac Oncol. 2006;1:71–3. [PubMed] [Google Scholar]