

Abstract
The study was designed to test the relative effectiveness of a Navigator intervention delivered face-to-face or by telephone to urban Native American women. The effectiveness of the intervention was evaluated using a design that included a pretest, random assignment to face-to-face or telephone group, and posttest. The Social Cognitive Theory-based intervention was a tailored education program developed to address individual risk factors for breast cancer. At posttest, self-reported mammograms in the past year increased from 29% to 41.3% in the telephone group and from 34.4%: to 45.2% in the face-to-face group. There was no difference in change from pretest to posttest between the telephone and face-to-face groups. Navigators can be effective in increasing adherence to recommendations for screening mammography among urban American Indian women.
Introduction
This study addressed the challenge of increasing mammography screening among urban American Indian women. Results from numerous investigations of the effectiveness of screening for breast cancer suggest that mammography provides the best chance for early detection. 1,2 Factors associated with lower likelihood of receiving mammography include age 60 years and older, low education, African American or Hispanic race, low income, low knowledge about breast cancer risk factors and screening guidelines, lack of health insurance, little contact with health care providers, no family history of breast cancer, and no personal history of breast problems.3–9 Overall, research suggests that factors related to socioeco-nomic status and a low socioeconomic status lifestyle are primary predictors of not receiving screening for breast cancer. American Indian populations are more likely to be of lower income and lower socioeconomic status than other ethnic minority groups. Great variability is evident among breast cancer mortality data for specific Indian Health Service (IHS) areas (tribal-specific mortality data are unavailable). Age-adjusted breast cancer mortality rates among American Indians in geographic regions other than the Southwest and the East are gradually increasing and becoming similar to US rates for breast cancer. Fig 1 illustrates the IHS data from 1994–1998.10 Denver, Colorado, has high numbers of American Indians who are from the Northern Plains. The 5-year relative survival percentage by race and cancer site illustrate that American Indians have the poorest survival from breast cancer than other racial and ethnic groups, such as blacks, Hispanics, and whites. The 5-year breast cancer relative survival rate for American Indian women is 48.8% compared with 75.7% for whites, 73.4% for Hispanics, 62.8% for African Americans, and 69.4% for Native Hawaiians.10 Among the primary reasons for this poor survival is diagnosis of the disease at a later stage, which is often associated with a lack of access to culturally acceptable early detection services (ie, mammography screening). Information gained from examining disease onset and progression within these populations may suggest interventions that could reduce incidence and improve survival among American Indians and be of assistance to people of other races.
Fig. 1.
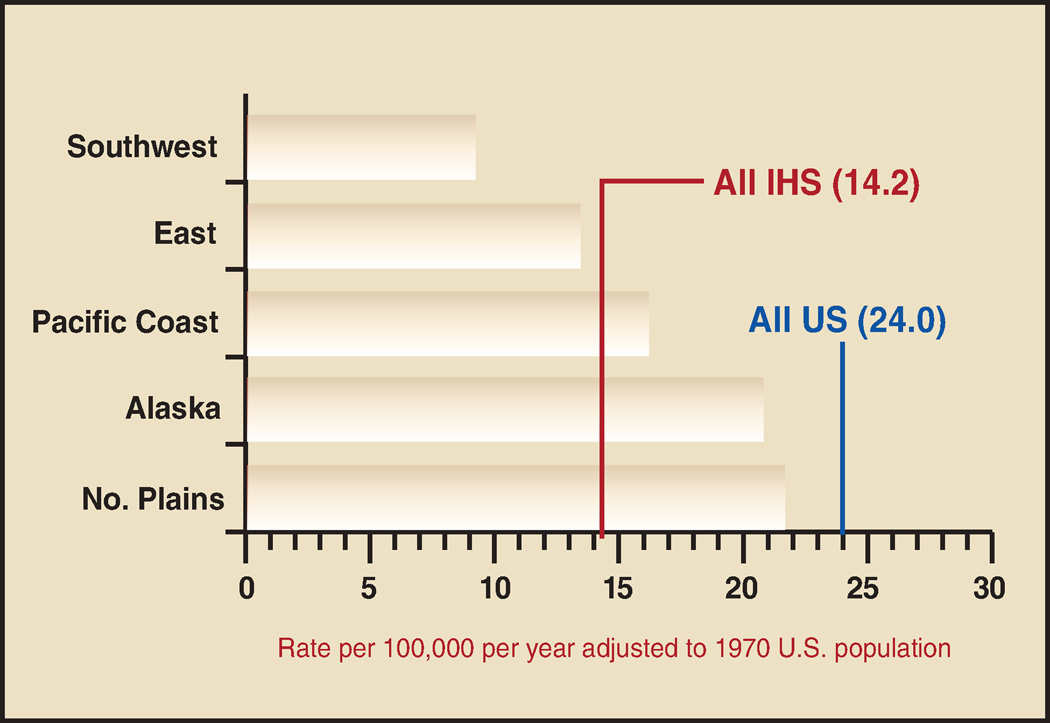
Age-adjusted cancer mortality rates: breast, by region, females, 1994–1998. Courtesy of the Indian Health Service National Epidemiology Program: Roberta Paisano, MHSA, and David Espey, MD.
In this paper, we report on results of a project designed to determine the relative effectiveness of face-to-face and telephone delivery of a culturally sensitive Navigator intervention to increase adherence to guidelines for mammography screening among American Indian women residing in the Denver metropolitan area in Colorado. There is no access to cancer screening through IHS for Native people living in Denver. For example, the IHS-supported urban facility in Denver is composed of outreach or health education only and has not provided any medical services since 1991. The IHS owns a total of 14 mammography machines nationwide, none of which is in the greater Denver area. Access to a fixed mammogram machine in a culturally acceptable setting is essential for American Indian’s participation in early detection programs. This was recently confirmed by a study conducted by the IHS. In 1996, the IHS completed a 19-year retrospective case review of 42 patients with breast cancers at one service unit — from 1974–1989 when no mammography unit was on site and from 1989–1995 after acquiring an onsite fixed mammography unit. The average size of the breast cancers at the time of diagnosis was 4.1 cm in the earlier time period compared with 2.6 cm in the later time period. A favorable trend in the size of breast cancers occurred after mammography became available on site, and rates of screening increased.11
Mammography is the best known method of early detection of breast cancer in women over 40 years of age. Unfortunately, access to culturally acceptable mammography services is limited. Mammography services are available to women of all colors throughout the Denver metropolitan area; however, cultural barriers exist that interfere with effective utilization of those screening services. It is widely accepted that economic and transportation barriers are primarily responsible for lack of participation in mammography programs. However, the Centers for Disease Control and Prevention Breast and Cervical Cancer Control Program (BCCCP) addresses both of these poverty-related barriers, and yet American Indian women continue to have low screening rates.
Urban American Indian Populations
Most previous research on breast cancer among American Indian women has focused on reservation populations, leaving urban populations relatively understudied. However, the urban population of American Indians includes almost 60% of the Native population in the United States. 12 Due to limited annual appropriations by the US Congress, the IHS is limited in its sponsored services. Urban Indian clinics receive, on average, 2% of the total monies allocated by IHS for health care, most of which is specific to alcohol, mental health, and diabetes programs. The urban Indian clinic based in Denver provides only education and referral services and no cancer-related education or services. Thus, the American Indian population living in the Denver Metropolitan urban area must access breast health screening services that are available for the general public and not Native-specific.
The Colorado Mammography Program Database
The Colorado Mammography Program (CMAP) was a surveillance project operating in the Denver metropolitan area. CMAP obtained longitudinal data on approximately 50% of all mammograms provided in the area. This database included 1,200 American Indian women who had ever had a mammogram from one of these facilities. Analysis of CMAP data indicated that American Indian women were less likely to have annual mammograms (approximately 18% compliance) than women of other racial groups.
Methods
Staff at the Native American Cancer Research (NACR) program have used Navigator models in research projects since 1994.13,14 The NACR Navigator model has evolved over the years to include components of the cancer care continuum. This project addresses early detection and is specifically designed to compare the effectiveness of a tailored Navigator intervention through face-to-face or telephone methods of intervention. The project is based on social cognitive theory,15 which suggests that learning is facilitated by observation of successful accomplishment of specific objectives. Using this concept, the American Indian Navigators were trained to provide information regarding the importance of mammography and adherence to guidelines, strategies to overcome barriers to obtaining mammograms and follow-up care, and reinforcement for scheduling and keeping appointments. The overall study design is presented in Fig 2.
Fig. 2.
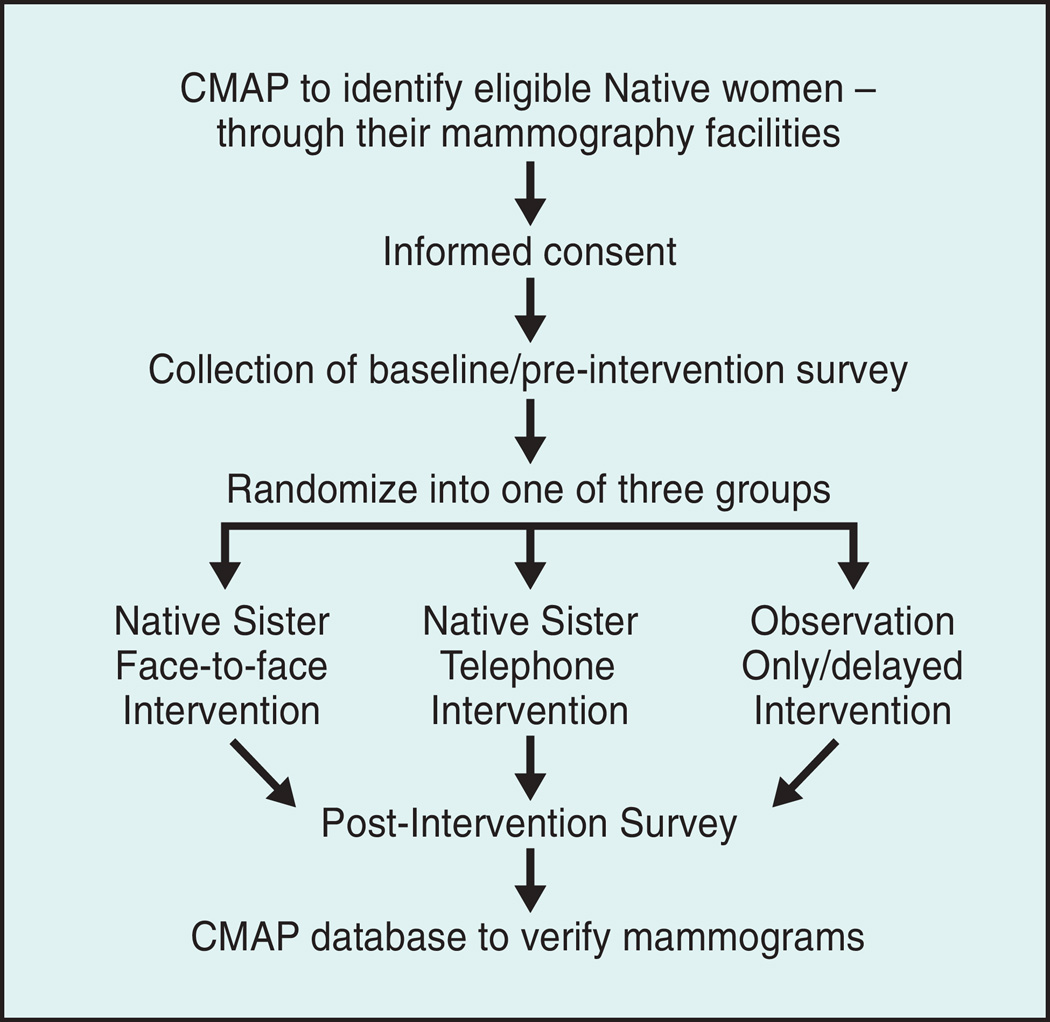
Schematic of overall study design.
Target Population
This study addressed adherence to breast cancer screening guidelines. The target population was urban American Indian women 40 years of age and older who were living in the greater Denver Metropolitan Area and had not had a mammogram within the previous 18 months. Pretest enrollment and data collection began in August 2001 and were completed in September 2002. A total of 929 participants were identified for recruitment, and 157 were enrolled and randomized to face-to-face or telephone intervention.
Recruitment, informed Consent, and the Preintervention Survey
Participants were recruited by telephone. The informed consent process was started, and a baseline (preintervention) survey was implemented for those who agreed to take part in the study. The survey included 24 items and was used for both pretest and posttest to collect data on awareness of efforts in the community to increase screening for breast cancer among American Indian women. Items included demographic characteristics, current employment status, health insurance (including deductibles and copayments), family and personal history of breast cancer, history of symptoms suggestive of breast cancer, and history of mammograms including most recent mammogram date, facility, results, and follow-up recommended. Finally, adherence with recommendations was obtained. Time required to administer the interview ranged from 20 minutes to more than 1 hour. After the surveys were completed, the women were randomized into three groups: face-to-face intervention, telephone intervention, and the control group.
The Intervention
The intervention was delivered individually by trained Native American Navigators,16 called “Native Sisters” by the project. These individuals were recruited from the Denver metropolitan area and were provided with training and support. The approach in which local Native American women have been trained as Navigators has been used successfully in previous projects with American Indian populations in rural populations.17 It has also been used for NACR’s Native American Women’s Wellness through Awareness (NAWWA) Project in two urban areas.13,14
The Tailored Education Brochure
One of the central features of the intervention was a printed brochure, tailored to the characteristics of individual women. Using data from the baseline interview, the brochure was designed to reflect risk factors for breast cancer in the form of the individual’s age, her age of onset of menstruation, age of menopause, family history of breast cancer, age at first childbirth, and breast feeding.
The face-to-face intervention was planned for delivery at the participant’s home, workplace, or mutually convenient location (eg, restaurant). In some instances, however, participants requested that the intervention be provided over the telephone. House cleaning, time constraints, the need for child care, and transportation were the most common reasons for such requests. When requested, the intervention was delivered by telephone, even if the participant was randomized to the face-to-face group. For those in the telephone group, a package that included all of the education information (eg, breast self-examination cards, the personalized brochure) was mailed prior to the intervention session. A time for the telephone intervention was coordinated by the Native Sisters.
The intervention was delivered in one session, regardless of whether it was face-to-face or by telephone. The Native Sister briefly presented information on breast cancer and the value of early detection. Following this introduction, the Native Sister carefully reviewed the individualized brochure. Great care was taken to insure that the information on the brochure was correct and that the participant recognized that it was developed specific to her risk factors. Finally, the participant was asked about obtaining mammograms. The Native Sister was furnished with an exhaustive list of mammography facilities and payment requirements. Low-income participants were also made aware of the resources available from the CDC-funded breast and cervical cancer early detection and prevention program (BCCEDPP). When requested, the Native Sisters provided participants with referral information for the CDC-funded program. Finally, Native Sisters provided participants with an invitation to contact them if additional support was needed about obtaining mammograms or follow-up care. Native Sisters were prepared to assist with identifying mammography facilities, obtaining transportation and child care, assisting with translation for women who were not native English speakers, and other services as needed. Every effort was made to ensure that participants were supported by the Native Sisters in obtaining mammograms and/or follow-up diagnostic services. Intervention visits lasted between 20 and 90 minutes.
Cultural Aspects
The tailored brochure included selected components that are culturally specific to American Indian women. For example, a key item was based on the geographic location of the participants’ tribal affiliations. Thus, if a participant’s tribe was located in the Northern Plains, the risk level was described as “high,” consistent with the elevated breast cancer rates among Native women in the Northern Plains. Likewise, when discussing family history, there is little or no documentation of mutations in BRCA1 or BRCA2 among full-bloods. To date only two families (Aboriginal Cree and Ojibwa) have the same BRCA1 alterations (1510insG, 1506A>G), and both have mixed blood, as is common among most American Indians living in the United States.18 Of the women enrolled in the National Native American Cancer Survivors’ Support Network who have taken part in BRCA1 or BRCA2 testing, none have had the BRCA1 mutations. Thus, when discussing family history, the Native Sisters talk about behavior as a greater risk for breast cancer, and, as is true for women of all racial groups, most women diagnosed with breast cancer have no family history of the disease. The Intervention also involves “gifting,” which is a common practice among most tribal Nations (although our tribal cultures are different from one another, some commonalities remain). “Gifting” is an integral part of most effective Native-specific interventions.19,20
Postintervention Survey
At least 6 months after implementation of the intervention, the women were contacted again, and an edited version (with 16 items) of the survey was administered.
Measurement and Data Analysis
The primary dependent variable used for evaluating the intervention was adherence to guidelines. For participants who received a recommendation for a screening mammogram, adherence referred to obtaining the mammogram in compliance with the guidelines (plus 60 days due to limitations in available mammography services at the time of the postintervention). For participants who received recommendations to obtain follow-up care, adherence referred to obtaining the care as specified. Native Sisters assisted all participants who needed any type of follow-up care. Characteristics of participants included in the analysis included their age, marital status, education, income, health insurance to pay all or part of the cost of screening or follow-up, and personal and family history of breast cancer. Logistic regression was used to assess the effects of the intervention after adjustment for characteristics of the participants. Where appropriate, contingency tables were analyzed by the chi-square test. All statistical tests were two-sided, with P < .05 indicating statistical significance.
Results
The average age of the 157 participants at the pretest was 54.2 years (SD = 9-4). The average age of the participants randomized to the face-to-face group was 54.1 (SD = 9-4), and for the telephone group the average age was 54.7 (SD = 9-1). There was no difference between the average ages of the study group participants at pretest. The posttest was timed to be administered at least 30 days after the date when guidelines recommended mammograms. Posttest data collection began in November 2002 and was completed by the end of November 2003. Of the 157 participants enrolled at pretest, 45 (29%) were lost to follow-up. The loss to follow-up was approximately equal between the face-to-face and telephone intervention groups. This loss to follow-up is common when working with urban Indian populations. The local program tracks accuracy of the databases and cross-references all data with our NACR private database. On average, 50% of contact information is accurate 18 months after collecting the data. The population is highly mobile, sometimes due to moving back and forth between Denver and the home reservations, other times due to moving in with other family or friends within the Greater Denver metropolitan area, or losing telephone access for more than 2 months (the local telephone company retains the phone number for up to 2 months for disconnected numbers, due to unpaid telephone bills). At least 25% of adult urban Indians have their telephone disconnected at least 1 month each year. For example, in August, money may be used to pay for new shoes or clothing for children or grandchildren rather than to pay the telephone bill. The bill is then paid in September) (NACR unpublished data, 2005).
Table 1 shows the age distribution and educational level of the study population according to intervention group. The face-toface and telephone intervention groups differed in terms of age, with the telephone group having more participants in the 65+ age group. The educational levels of the groups were similar, with the largest proportion of participants reporting education beyond high school.
Table 1.
Age and Educational Level of Study Population at Pretest
| Intervention Groups |
Total |
||
|---|---|---|---|
| Face-to-Face | Telephone | n (%) | |
| n (%) | n (%) | ||
| Age (yrs) | |||
| <50 | 29 (37.7) | 24 (18.0) | 53 (25.2) |
| 50–64 | 33 (42.9) | 38 (28.6) | 71 (33.8) |
| 65+ | 15 (19.5) | 71 (53.4) | 86 (41.0) |
| Education Level | |||
| < High school | 8 (11.0) | 9 (13.6) | 17 (12.7) |
| High school or GED | 23 (31.5) | 14 (21.2) | 34 (25.4) |
| > High school | 42 (57.5) | 43 (65.2) | 83(61.9) |
For the primary assessment of intervention effect, we tested the differences in the proportion of women who reported having a mammogram within the past 12 months on the pretest and posttest for both the telephone and face-to-face groups, and we then compared them with data from the CMAP. At the time of the pretest, 51.9% of the control group had had mammograms within the previous 12 months and by the posttest, there was no increase (50%). As Table 2 shows, the change (increase) in the proportion of intervention group participants who had a mammogram within the past 12 months from pretest to posttest was statistically significant (Wilcoxon Signed Ranks Test, z = 2.475, P = .013). A 42% increase occurred in the proportion of women reporting a mammogram within the past 12 months in the group receiving the telephone intervention (P = .029) and a 31% increase in the face-to-face intervention group (P = .197). There was no significant difference between the intervention and comparison group (chi-square = 2.68, P=.10).
Table 2.
Percentage of Participants Reporting Mammograms in the Past 12 Months by Study Group: Pretest and Posttest
| Pretest (%) |
Posttest (%) |
|
|---|---|---|
| Telephone | 29.0 | 41.8 |
| Face-to-face | 34.4 | 45.2 |
| CMAP (comparison) | 51.9 | 50.0 |
Pretest vs Posttest for Navigator interventions, P= .013
Telephone vs face-to-face, P = .83.
CMAP = Colorado Mammography
The results shown in Table 2 indicate that both the telephone and face-to-face intervention methods were associated with increases in mammograms, but the telephone intervention appears to be the more effective of the two approaches. The telephone intervention method is considerably less expensive than face-to-face, but with a low-income population, contacting participants by telephone may lead to excess loss to follow-up. More than half of the women in the intervention had different telephone numbers by the time the postintervention survey was administered.
Discussion
Navigators were effective in reaching urban Native American women and providing an intervention about breast cancer screening that increased the number of Native women who adhered to screening guidelines. To our knowledge, most navigator models have relied on face-to-face contact with individuals. This study demonstrated that telephone methods of implementing the Navigator model were both feasible and successful. The similarity in results for the face-to-face and telephone approaches also suggests that individual preference for the mode of contact is important. A small proportion of participants who had been randomized into the face-to-face group specifically requested that the intervention be implemented by telephone. When asked about these requests, the most common responses from the women were that they did not have time to clean their house to have someone visit, they didn’t have child care to allow them privacy while doing the intervention, or they didn’t have transportation to meet the Native Sister at a designated location. This finding may make it more feasible to implement Navigator models to women who live in remote or rural areas or reservations but have a working telephone. Thus, there is a need to develop, implement, and evaluate Navigator models using both face-to-face and telephone methods for multiple interventions to determine whether this finding is consistent among other studies.
The tailored personalized brochure was well accepted by both intervention groups. Following the study, the control group was recruited to a delayed intervention that included this tailored product. The brochure has also subsequently been integrated into another National Cancer Institute study, “Increasing Mammogram Adherence in Minority Women” (R25 CA 96540). Likewise, the tailored health information concept was expanded to NACR’s ongoing “Native American Cancer Education for Survivors” (R25 CA101938) as an interactive, personalized education program.
When surveyed, American Indian populations typically rank alcohol abuse, diabetes, and violence as their primary health concerns.21 However, cancer remains the second-leading cause of death among Natives over 45 years of age. Cancer as a health priority has gradually been increasing among communities without receiving a great deal of recognition as a growing health concern until the last decade. During the last 5 years, every national and regional American Indian women’s health or wellness gathering has included breast cancer as a conference agenda topic.22
Conclusions
Since there are no known ways to prevent breast cancer, early detection is key to survival and to maintaining a satisfactory quality of life. Most breast cancer diagnoses in American Indian women are late stage in comparison with other racial groups in the same geographic areas. Breast cancer is the leading cause of death for women ages 35 to 54 years.23 Learning how to increase American Indian women’s participation in mammography and follow-up care is key to increasing survival from breast cancer.
Results from our community-based project demonstrate that lay health educators can be effective in increasing adherence to recommendations for screening mammography among urban American Indian women. The results should be interpreted with caution, however. Of the 929 potential participants, only 157 (17%) were enrolled. Even though the study assigned women to study group at random, it is possible that women who enrolled were a select group and not representative of the population. Furthermore, 29% of the study population was lost to follow-up, which may have contributed to the relatively limited intervention effects. At the same time, the loss to follow-up may have exaggerated the intervention effect. The project team was concerned about loss to follow-up at the beginning of the project and instituted procedures to track the women carefully. However, as was anticipated, urban American Indian women frequently move back and forth between the city and their home reservation, and within the city itself. Thus, within an 18-month period of time, half of the telephone numbers were no longer valid. Additional research using larger sample sizes and improved ability to track participants is needed to establish the validity of the findings from this study.
Acknowledgments
This study was supported by the National Cancer Institute “Increasing Mammography for Urban American Indian Women” (R25 CA77665).
Abbreviations used in this paper
- IHS
Indian Health Service
- CMAP
Colorado Mammography Program
- NACR
Native American Cancer Research
References
- 1.Bjurstam N, Bjorneld L, Warwick J, et al. The Gothenburg Breast Screening Trial. Cancer. 2003;97:2387–2396. doi: 10.1002/cncr.11361. [DOI] [PubMed] [Google Scholar]
- 2.Smith RA, Saslow D, Sawyer KA, et al. American Cancer Society guide lines for breast cancer screening: update 2003. CA Cancer J Clin. 2003;53:141–169. doi: 10.3322/canjclin.53.3.141. [DOI] [PubMed] [Google Scholar]
- 3.Warnecke RW. Interventions in black populations. In: Murphy GP, Alan R, editors. Cancer Among Black Populations. New York, NY: Alan R. Liss; 1981. pp. 167–184. [Google Scholar]
- 4.Kitagawa EM, Hauser PM. Differential Mortality in the United States: A Study in Socioeconomic Epidemiology. Cambridge, Mass: Harvard University Press; 1973. [Google Scholar]
- 5.Linden G. The influence of social class in the survival of cancer patients. Am J Public Health. 1969;59:267–274. doi: 10.2105/ajph.59.2.267. [DOI] [PMC free article] [PubMed] [Google Scholar]
- 6.Williams RR, Horm JW. Association of cancer sites with tobacco and alcohol consumption and socioeconomic status of patients: interview study from the Third National Cancer Survey. J Natl Cancer Inst. 1977;58:525–547. doi: 10.1093/jnci/58.3.525. [DOI] [PubMed] [Google Scholar]
- 7.Freeman HP. Cancer in the socioeconomically disadvantaged. CA Cancer J Clin. 1989;39:266–288. doi: 10.3322/canjclin.39.5.266. [DOI] [PubMed] [Google Scholar]
- 8.Lerner M. Access to the American health care system: consequences for cancer control. CA Cancer J Clin. 1989;39:289–295. doi: 10.3322/canjclin.39.5.289. [DOI] [PubMed] [Google Scholar]
- 9.Steiner CB. Access to cancer prevention, detection, and treatment. Cancer. 1991;67(6 suppl):1736–1740. doi: 10.1002/cncr.2820671806. [DOI] [PubMed] [Google Scholar]
- 10.Espey DK, Paisano RE, Cobb N. Cancer Mortality among American Indians and Alaska Natives: Regional Differences, 1994–1998. NIH Pub. No. 97-615-28. Rockville, Md: Indian Health Service; revised October 2003. [Google Scholar]
- 11.Cobb N, Paisano RE. Cancer Mortality Among American Indians and Alaska Natives in the United States: Regional Differences in Indian Health, 1989–1993. IHS Pub No. 97-615-23. Rockville, Md: Indian Health Service; 1997. [Google Scholar]
- 12.Urban Indian Health Institute. The Health Status of Urban American Indians and Alaska Natives Analysis of Selected Vital Records and Census Data Sources. Seattle, Wash: Seattle Indian Health Board; 2004. Mar 14, [Google Scholar]
- 13.Burhansstipanov L, Wound DB, Capelouto N, et al. Culturally relevant “Navigator” patient support: the Native sisters. Cancer Pract. 1998;6:191–194. doi: 10.1046/j.1523-5394.1998.006003191.x. [DOI] [PubMed] [Google Scholar]
- 14.Burhansstipanov L, Dignan MB, Wound DB, et al. Native American recruitment into breast cancer screening: the NAWWA project. J Cancer Educ. 2000;15:28–33. doi: 10.1080/08858190009528649. [DOI] [PubMed] [Google Scholar]
- 15.Bandura A, editor. Self-Efficacy in Changing Societies. New York, NY: Cambridge University Press; 1995. [Google Scholar]
- 16.Eng E, Smith J. Natural helping functions of lay health advisors in breast cancer education. Breast Cancer Res Treat. 1995;35:23–29. doi: 10.1007/BF00694741. [DOI] [PubMed] [Google Scholar]
- 17.Dignan M, Michielutte R, Blinson K, et al. Effectiveness of health education to increase screening for cervical cancer among eastern-band Cherokee Indian women in North Carolina. J Natl Cancer Inst. 1996;88:1670–1676. doi: 10.1093/jnci/88.22.1670. [DOI] [PubMed] [Google Scholar]
- 18.Liede A, Jack E, Hegele RA, et al. Mutation in Brief #498: a BRCA1 Mutation in Native North American Families. [Accessed August 5, 2005];Hum Mutat. 2002 19:460. doi: 10.1002/humu.9027. Available at: http://www3.interscience.wiley.com/cgi-bin/fulltext/91016822/PDFS-TART. [DOI] [PubMed] [Google Scholar]
- 19.Orians CE, Erb J, Kenyon KL, et al. Public education strategies for delivering breast and cervical cancer screening in American Indian and Alaska Native populations. J Public Health Manag Pract. 2004;10:46–53. doi: 10.1097/00124784-200401000-00009. [DOI] [PubMed] [Google Scholar]
- 20.Lantz PM, Orians CE, Liebow E, et al. Implementing women’s cancer screening programs in American Indian and Alaska Native populations. Health Care Women Int. 2003;24:674–696. doi: 10.1080/07399330390227481. [DOI] [PubMed] [Google Scholar]
- 21.Michalek AM, Mahoney MC, Burhansstipanov L, et al. Urban-based Native American cancer-control activities: services and perceptions. J Cancer Educ. 1996;11:159–163. doi: 10.1080/08858199609528420. [DOI] [PubMed] [Google Scholar]
- 22.Burhansstipanov L, Dresser CM. American Indian Monograph No. 1: Documentation of the Cancer Research Needs of American Indians and Alaska Natives. NIH Pub No 93-3603. Bethesda, Md: National Cancer Institute; 1993. D-1. [Google Scholar]
- 23.National Susan G. Komen Breast Cancer Foundation. Facts about Breast Cancer. Dallas, Tex: 1996. Jan, [Google Scholar]