

Abstract
Tiny amounts of carbohydrates (ca. 1 zmol) can be detected quantitatively by a real-time method based on the conjugation of carbohydrates with DNA markers (see picture). The proposed method (glyco-qPCR) provides uniform, ultrasensitive detection of carbohydrates, which can be applied to glycobiology, as well as carbohydrate-based drug discovery.
Keywords: carbohydrates, DNA, glycoconjugates, signal amplification, ultrasensitive detection
The ultrasensitive determination of the carbohydrate components of glycoconjugates is challenging because of their low concentrations in complex biological mixtures and the chemical complexity of glycan chains. A major limitation in the field of glycobiology has been a lack of requisite analytical platforms for biologically active, therapeutic carbohydrates (e.g., glycosaminoglycans (GAGs) and sialylated glycans, such as N-glycans) and glycoconjugates (e.g., proteoglycans (PGs), glycoproteins (GPs), and glycolipids).[1] Unlike nucleic acids, carbohydrates cannot be detected by amplification methods, and in contrast to proteins, there are few carbohydrate-specific antibodies.[2] Moreover, carbohydrates have no natural chromophores or fluorophores, and often show poor ionization efficiency in mass spectrometry (MS).[3] Methods for detecting carbohydrates in subfemtomole levels would greatly facilitate glycomics studies[4,5] on cell surface glycans,[6] and improve our understanding of the biological roles of carbohydrates, protein glycosylation, and carbohydrate–protein interactions involved in the critical biological processes.[4,7,8]
We report a novel glyco-quantitative polymerase chain reaction (Glyco-qPCR) assay platform (Scheme 1) that allows the ultrasensitive detection and quantification of glycans in biological samples. We used chondroitin sulfate (CS) and sialylated N-glycans as model carbohydrates to demonstrate Glyco-qPCR. The CS GAG is a representative O-linked glycan side-chain of many biologically important PGs. Sialylated glycans are commonly found on GPs, PGs, and glycolipids. All target glycans in this study contain a free reducing end and a carboxy group, allowing the introduction of a double label of biotin and DNA.
Scheme 1.
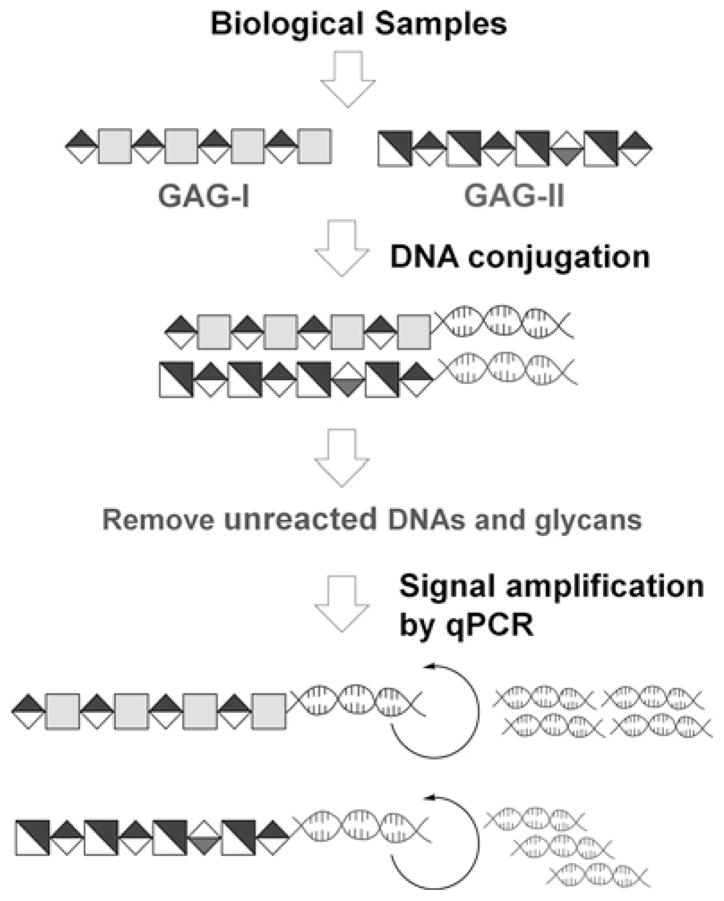
Schematic representation of Glyco-qPCR. Target carbohydrates (GAGs) from biological samples can be conjugated with different DNA markers, followed by removing unreacted DNA and detecting the corresponding GAG–DNA conjugates with amplified signals (qPCR).
Ultrasensitive detection and quantification by Glyco-qPCR relies on a high-affinity biotin–streptavidin interaction combined with qPCR amplification for molecular colocalization of glycan and DNA marker signal amplification of a target carbohydrate (Figure 1a). Because exponential amplification by PCR can permit the routine detection of even a single molecule of DNA,[2,9] we hypothesized that an appropriately designed assay might be similarly used to detect a single or small number of a carbohydrate–DNA conjugates.
Figure 1.
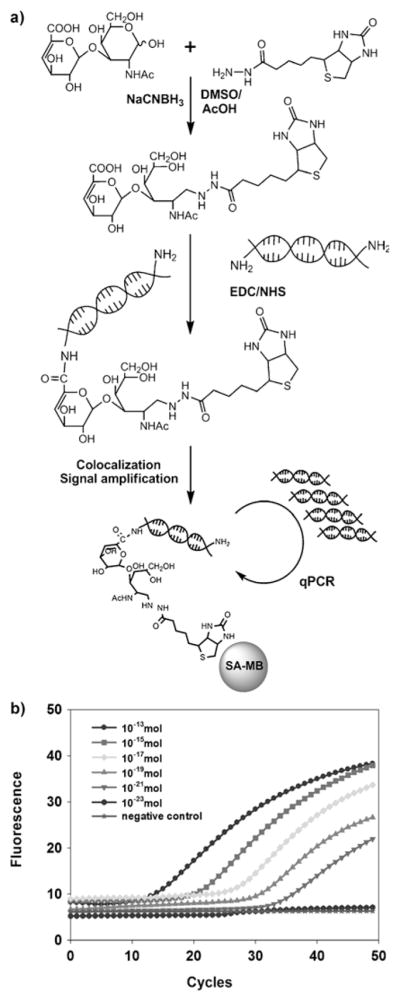
Ultrasensitive detection of carbohydrates using glyco-qPCR. a) Coupling of biotin hydrazide to the reducing end of a CS disaccharide in the presence of NaCNBH3, and subsequent attachment of DNA to the carboxy group of the nonreducing end of the biotinylated CS disaccharide using EDC/NHS. Colocalization and signal amplification is used to increase detection sensitivity of the target carbohydrate. b) Glyco-qPCR amplification plots of recovered BCS–DNA conjugates. Different amounts of BCS and trehalose as negative control were used to determe detection limitation. All samples and controls were amplified in triplicate.
We also describe the application of Glyco-qPCR as a detection platform for the study of carbohydrate–protein interactions of critical importance in biology.[10,11] Glycan arrays, using fluorescent tags for high-throughput detection of carbohydrate–protein binding,[12] often afford inconsistent data as a result of nonspecific interactions and variations in glycan ligand density and orientation on different array platforms.[13] Glyco-qPCR might offer an ultrasensitive alternative to glycan arrays.
CS GAG is a polydisperse, microhetereogenous mixture of polysaccharides that complicates its direct analysis. Thus, CS is commonly enzymatically converted to CS disaccharides prior to its analysis.[14] Biotinylation of a CS disaccharide was accomplished by efficient reductive amination (Figure 1a),[15] and the resulting biotinylated CS disaccharide (BCS) was purified and its structure confirmed by MS and NMR analysis (Supporting Information, Figure S1).
A 5′-amine-terminated DNA marker-I (124 bp, Supporting Information, Figure S2) was prepared by PCR amplification using the pEGFP-N1 plasmid template and two 5′-amino-modifier-C6 primers (Primer-1 and Primer-2, Supporting Information, Table S1). The purified BCS, which contains a carboxy group at its nonreducing end, was then conjugated to 5′-amine-terminated DNA marker-I by EDC/NHS coupling (Figure 1a).[16] The amplified DNA marker-I was next used to obtain a standard curve for qPCR using Taqman qPCR with specific primers for the DNA marker (Primer-3 and Primer-4, Supporting Information, Table S1 and Figure S2). After coupling the 5′-amine-terminated DNA marker-I with BCS, the conjugate (BCS–DNA) was bound to streptavidin-coated magnetic beads (SA-MB) and washed at least ten times with phosphate-buffered saline (PBS) to remove unreacted DNA marker-I. Trehalose, with no carboxy group, was used as a negative control. This negative control and an extensive washing protocol were necessary, because Glyco-qPCR is extremely sensitive in detecting both carbohydrate–DNA conjugate (BCS–DNA) and residual unreacted DNA; the latter resulting in a false positive signal. Despite washing at least ten times, the unreacted DNA (negative control) could still be detected (data not shown). Thus, an enhanced clean up procedure was required. After allowing the BCS–DNA conjugate and the negative-control mixture (trehalose and DNA) to separately bind SA-MB and washing the beads four more times with PBS, agarose gel electrophoresis was performed to completely remove unreacted DNA (Supporting Information, Figure S3). Using this enhanced clean up procedure, the unreacted DNA marker was completely removed, resulting in no signal detection from the negative control (data not shown), thus allowing us to proceed to Glyco-qPCR. Next, solutions containing different amounts of BCS (from 100 fmol to 10 ymol) and a negative control (10 pmol of trehalose) were prepared using serial dilutions to determine the detection limit of Glyco-qPCR. The samples were coupled with 10 pmol of 5′-amine-terminated DNA marker, followed by binding to SA-MB, washing four times with PBS, and agarose gel electrophoresis. The recovered BCS–DNA conjugates were then used as templates for qPCR. An amount of BCS disaccharide of as low as 1 zmol was detected (Figure 1b). Attaching the DNA marker to the reducing end and biotin to the carboxy group also gave satisfactory results, albeit with slightly reduced sensitivity (data not shown).
Encouraged by the highly sensitive detection of BCS–DNA conjugate prepared from pure BCS, we combined capillary electrophoresis (CE) with the Glyco-qPCR, because CE offers the efficient and potentially automatable separation of small quantities of biologically important oligosaccharides.[17] PGs are critically important glycoconjugates present in all animal cells. The PGs of Chinese hamster ovary (CHO) cells, including CS-PGs (CS type A, CSA), have been extensively studied.[18] Their ultrasensitive analysis typically relies on their isolation from a urea extract using an ion-exchange spin column, proteolysis to recover GAG, polysaccharide lyase (e.g., chondroitiniase) digestion to prepare GAG disaccharides, and CE or high-performance liquid chromatography/MS analysis.[7b] Currently, standard analytical approaches for quantitative compositional analysis CS GAGs require approximately 106 cells with UV or MS detection[18,19a] or 5 × 10⁴ cells with BODIPY labeling and fluorescence detection.[19b]
CS disaccharides were obtained from serially diluted CHO cells and subjected to CE in pH 9 in 35 mM borate buffer under normal polarity. CE optimally separates the nonsulfated disaccharide (CS-0S) from the monosulfated, chondroitin-4-sulfate disaccharide (CS-4S) obtained from CHO cell CS. The separated peaks, corresponding to CS-0S and CS-4S, were both collected (Figure 2a).
Figure 2.

Glyco-qPCR detection of CS disaccharides isolated from CHO cells. a) CE separation of CS disaccharides from different number of CHO cells. b–c) The qPCR analysis of the CS disaccharides–DNA conjugate fractionally collected by CE.
The CS disaccharide peaks, from samples with 5 × 10⁷ and 5 × 10⁶ CHO cells could be detected by UV absorbance. In contrast, CS disaccharide peaks in samples from 5 × 10⁵ cells to 50 cells were not detectable by UV absorbance, and the corresponding fractions were blindly collected at the same retention-time windows (Figure 2a). A qPCR reaction was performed on each of the blindly collected CE samples. By combining CE separation with Glyco-qPCR collection, we were able to detect amounts of CS disaccharides (<1 amol of CS-0S and CS-4S) isolated from as few as 500 CHO cells (Figure 2c). Although CS disaccharides could not be detected in CE fractions prepared from 50 CHO cells by Glyco-qPCR, improved DNA marker conjugation and improved or automated recovery would undoubtedly increase the detection sensitivity, possibly ultimately allowing GAG analysis of single cells.
Glyco-qPCR was next applied in analyzing sialylated N-glycans, the most common type of glycans found in GPs and PGs. Recombinant human decorin PG[20,21] was treated with chondroitinase to remove its GAG chain and afford core GP. PNGaseF treatment of the decorin core GP released its N-linked glycans,[21] as confirmed by gel electrophoresis and MS analysis (Supporting Information, Figures S4a and S5). A sialylated N-glycan standard was used as a positive control, and nonsialylated N-glycan standards as a negative control (Supporting Information, Figure S6a). As in the CS disaccharide analysis, we biotinylated the N-glycans at their reducing end and coupled the 5′-amine-terminated DNA marker-I to their nonreducing terminal sialic acid using EDC/NHS. N-glycans, released from 10 ag to 10 μg of the decorin core GP, were biotinylated and conjugated with DNA, unreacted DNA was removed using the enhanced clean up procedure, and a small amount (1 amol) of biotinylated DNA internal standard (DNA marker-II), obtained from the PCR reaction with template plasmid pCR4-Cyp3A4 with Primer-11/12 (Supporting Information, Table S1 and Figure S6b), was added to the sample for normalization. The qPCR analyses of the conjugates (biotin-N-glycan-DNA marker-I) and biotin–DNA internal standard (DNA marker-II for normalization) were performed with specific primers for the DNA marker-I (Primer-3/4) and the DNA marker-II (Primer-7/8), respectively (Supporting Information, Figure S6b–d). The results indicated that 1 fg of PG was required for detecting the PNGaseF-released sialylated N-linked glycans (Supporting Information, Figure S4c). This is a million-fold more sensitive than the 1 ng detection limit of Western blotting (Supporting Information, Figure S4b). This extraordinarily high sensitivity was obtained despite that only a fraction of the decorin N-glycan was sialylated (Supporting Information, Figure S5).
We next applied Glyco-qPCR to sensitive analysis of protein–carbohydrate interaction, as there are several hundred GAG-binding proteins, including protease inhibitors, growth factors and their receptors, chemokines, etc.,[10] representing the glyco-interactome.[22] These proteins have critical roles in developmental and stem cell biology, normal physiology, and pathophysiology.[5,8a] Sensitive and accurate detection and quantification of these interactions remains a critical gap in our fundamental understanding of the glyco-interactome. We focused on the highly specific interaction between the GAG, heparin, and antithrombin III (AT)[23] to establish the ability of glyco-qPCR to serve as an ultra-sensitive method to quantify carbohydrate–protein interactions (Figure 3a). In this proof-of-concept study, the structurally and chemically similar chondroitin sulfate-A (CSA) glycosaminoglycan, known not to interact with AT, was used as a negative control. Surface plasmon resonance confirmed that our DNA primer did not interact with AT (Supporting Information, Figure S7).
Figure 3.

Carbohydrate–protein interaction assay using Glyco-qPCR. a) Glyco-qPCR protocols for heparin–AT interaction assay with heparin–DNA marker-I and chondroitin–DNA marker-II (negative control). b) Data analysis of Glyco-qPCR, exemplified for the detection of heparin–AT interaction. All samples and controls were amplified in triplicate.
Two different DNA markers were amplified by PCR. The DNA marker-I and marker-II were conjugated to the reducing terminus of heparin and CSA, respectively, to decrease DNA interference with protein–GAG interaction. After desalting, mixtures containing 2 μg each of heparin–DNA marker-I and CSA–DNA marker-II were incubated with the immobilized AT in PBS at 4°C overnight. After washing the immobilized AT beads seven times with PBS to remove unbound carbohydrates and DNA, the beads were used as a template for Taqman qPCR with two specific primer pairs (Primers-3/4 for DNA marker-I and Primers-7/8 for DNA maker-II). The DNA marker-I conjugated with heparin was amplified, resulting in increased fluorescence because of heparin–AT interaction (Figure 3b); no increase of the fluorescence signal was observed for the DNA marker-II conjugated with CSA (negative control). Thus, the formation of conjugates of target carbohydrates and specific DNA markers enables the highly selective and sensitive detection of relative binding properties against different target proteins. Additionally, the qPCR offers several advantages, including extreme sensitivity, online monitoring, no need for post-reaction analyses, and reduced risk of contamination.
The novel Glyco-qPCR method described herein provides the ultrasensitive detection of carbohydrates with both a reducing end and a carboxy group. Such functionality is common in many N-glycans, O-glycans, and in GAGs. The described detection and quantification is many orders of magnitude more sensitive than either MS or fluorescence detection. The analysis of aggregate structures in a biological sample, such as total CS content, requires no special separation other than simple sample recovery. More complete analysis, such as CS disaccharide compositional analysis, requires a microseparation by an advanced technique, such as CE. Because automated microfluidic platforms have been reported for CE separations[24] and in qPCR,[25] the development of a seamless, integrated, and automated Glyco-qPCR (on a microfluidic chip running both CE and qPCR) should be possible and afford an even higher sensitivity than reported in this study, thus opening the possibility of single-molecule glycan detection. The incorporation of both a biotin and fluorescent probe[26a] into a single tag might facilitate the optimization of preparative CE for more complex glycan mixtures.[26b] Glyco-qPCR can also be used to quantitatively analyze protein–carbohydrate interactions and may be of importance in studying low-abundance cell-surface glycans,[27] for sensitive virus–carbohydrate interaction assays,[28] and in carbohydrate-based drug discovery.[12a] Moreover, multiple DNA markers, demonstrated in our GAG–protein interaction experiment, could be used to tag individual glycans released from a glycoconjugate. These DNA markers could be used as molecular bar codes,[29] facilitating ultrasensitive glycan identification in the absence of solid supports commonly required in glycan microarrays. In conclusion, this study addresses a major hurdle in glycomics, applying amplification to detect as little as 1 zmol of glycan. Glyco-qPCR can also be used to analyze the glyco-interactome, which is critical for linking the proteome to the glycome.
Experimental Section
Reductive amination and EDC/NHS coupling: The CS disaccharide (5.0 mg, 12.4 μmol) was dissolved in a solution of H2O (0.5 mL) and 20% AcOH (0.1 mL). NaCNBH3 (1.2 mg, 18.6 μmol) and biotin hydrazide (4.8 mg, 18.6 μmol) were added to the reaction mixture. The reaction was stirred at 60°C for 3 days. On each day, additional portions of NaCNBH3 (1.2 mg, 18.6 μmol) and biotin hydrazide (4.8 mg, 18.6 μmol) were added. The reaction mixture was loaded onto a BioGel P2 column (2.5 × 65 cm) and eluted with H2O. Fractions were collected and those containing the product as determined by TLC (nBuOH/AcOH/H2O = 2/2/1) were combined and freeze-dried to afford a white powder. The recovered BCS was dissolved in water (pH 5.5) and then activated with 10-fold excess EDC/NHS at room temperature for 20 min before adding a 5-fold molar excess of 5′-amine-terminated DNA marker in PBS (pH 7.2) and reacting by mixing for 4 h at room temperature. The reaction mixture was recovered by adding to SA-MB (Pierce) in PBS and the beads were washed several times with PBS.
Quantitative PCR (qPCR): The DNA markers were amplified by PCR using template plasmids, pEGFP-N1 (Clontech), and pCR4-Cyp3A4 (Openbiosystem) with specific primers (Supporting Information, Table S1). The concentration of the DNA markers was determined using a NanoDropND-1000 spectrophotometer (Nano-DropTechnologies Inc.). Quantitative PCR was performed using a Taqman probe. Probes for DNA markers (probes 67 and 2 for DNA marker-I and marker-II, respectively) were purchased from Universal Probe Library (Roche Diagnostics). Quantitative PCR was carried out in 25 μL containing carbohydrate–DNA conjugate (or DNA marker itself), primers, a specific Taqman probe, and Brilliant II QRT-PCR Master Mix (Stratagene). Real-time PCR was then performed with the LightCycler 480 (Roche) using a 96-well plate in triplicate. The amplification program consisted of preincubation at 95 °C for 2 min, 50 cycles of 95°C for 15 s and 55°C for 1 min.
Supplementary Material
Footnotes
The authors thank Leyla Gasimli for critical reading of this manuscript, the National Institutes of Health for support in the form of grants no. GM38060, HL101721, and ES020903, and New York Stem Cell Science in the form of grant no. C024334.
Supporting information for this article is available on the WWW under http://dx.doi.org/10.1002/anie.201205112.
Contributor Information
Dr. Seok Joon Kwon, Department of Chemistry and Chemical Biology, Department of Chemical and Biological Engineering, Center for Biotechnology and Interdisciplinary Studies, Rensselaer Polytechnic Institute, Troy, NY 12180 (USA).
Prof. Kyung Bok Lee, Department of Biochemistry, College of Medicine, Konyang University, Daejeon 302-718 (Republic of Korea).
Kemal Solakyildirim, Department of Chemistry and Chemical Biology, Department of Chemical and Biological Engineering, Center for Biotechnology and Interdisciplinary Studies, Rensselaer Polytechnic Institute, Troy, NY 12180 (USA).
Sayaka Masuko, Department of Chemistry and Chemical Biology, Department of Chemical and Biological Engineering, Center for Biotechnology and Interdisciplinary Studies, Rensselaer Polytechnic Institute, Troy, NY 12180 (USA).
Mellisa Ly, Department of Chemistry and Chemical Biology, Department of Chemical and Biological Engineering, Center for Biotechnology and Interdisciplinary Studies, Rensselaer Polytechnic Institute, Troy, NY 12180 (USA).
Dr. Fuming Zhang, Department of Chemistry and Chemical Biology, Department of Chemical and Biological Engineering, Center for Biotechnology and Interdisciplinary Studies, Rensselaer Polytechnic Institute, Troy, NY 12180 (USA)
Dr. Lingyun Li, Department of Chemistry and Chemical Biology, Department of Chemical and Biological Engineering, Center for Biotechnology and Interdisciplinary Studies, Rensselaer Polytechnic Institute, Troy, NY 12180 (USA)
Prof. Jonathan S. Dordick, Department of Chemistry and Chemical Biology, Department of Chemical and Biological Engineering, Center for Biotechnology and Interdisciplinary Studies, Rensselaer Polytechnic Institute, Troy, NY 12180 (USA)
Prof. Robert J. Linhardt, Department of Chemistry and Chemical Biology, Department of Chemical and Biological Engineering, Center for Biotechnology and Interdisciplinary Studies, Rensselaer Polytechnic Institute, Troy, NY 12180 (USA).
References
- 1.Varki A, Cummings RD, Esko JD, Freeze HH, Stanley P, Bertozzi CR, Hart GW, Etzler ME. Essentials of Glycobiology. 2. Cold Spring Harbor Laboratory Press; Woodbury, New York: 2009. [PubMed] [Google Scholar]
- 2.a) Mullis KB, Faloona FA. Methods Enzymol. 1987;155:335. doi: 10.1016/0076-6879(87)55023-6. [DOI] [PubMed] [Google Scholar]; b) Sano T, Smith CL, Cantor CR. Science. 1992;258:120. doi: 10.1126/science.1439758. [DOI] [PubMed] [Google Scholar]
- 3.Zaia J. Omics. 2010;14:401. doi: 10.1089/omi.2009.0146. [DOI] [PMC free article] [PubMed] [Google Scholar]
- 4.a) Hart GW, Copeland RJ. Cell. 2010;143:672. doi: 10.1016/j.cell.2010.11.008. [DOI] [PMC free article] [PubMed] [Google Scholar]; b) Kolarich D, Lepenies B, Seeberger PH. Curr Opin Chem Biol. 2012;16:214. doi: 10.1016/j.cbpa.2011.12.006. [DOI] [PubMed] [Google Scholar]; c) Ly M, Laremore TN, Linhardt RJ. Omics. 2010;14:389. doi: 10.1089/omi.2009.0123. [DOI] [PMC free article] [PubMed] [Google Scholar]; d) Turnbull JE. Biochem Soc Trans. 2010;38:1356. doi: 10.1042/BST0381356. [DOI] [PubMed] [Google Scholar]
- 5.Paulson JC, Blixt O, Collins BE. Nat Chem Biol. 2006;2:238. doi: 10.1038/nchembio785. [DOI] [PubMed] [Google Scholar]
- 6.Hirabayashi J. Glycoconjugate J. 2004;21:35. doi: 10.1023/B:GLYC.0000043745.18988.a1. [DOI] [PubMed] [Google Scholar]
- 7.a) MariÇo K, Bones J, Kattla JJ, Rudd PM. Nat Chem Biol. 2010;6:713. doi: 10.1038/nchembio.437. [DOI] [PubMed] [Google Scholar]; b) Pabst M, Altmann F. Proteomics. 2011;11:631. doi: 10.1002/pmic.201000517. [DOI] [PubMed] [Google Scholar]
- 8.a) Dennis JW, Nabi IR, Demetriou M. Cell. 2009;139:1229. doi: 10.1016/j.cell.2009.12.008. [DOI] [PMC free article] [PubMed] [Google Scholar]; b) Freeze HH, Aebi M. Curr Opin Struct Biol. 2005;15:490. doi: 10.1016/j.sbi.2005.08.010. [DOI] [PubMed] [Google Scholar]; c) Peracaula R, Barrabes S, Sarrats A, Rudd PM, de Llorens R. Dis Markers. 2008;25:207. doi: 10.1155/2008/797629. [DOI] [PMC free article] [PubMed] [Google Scholar]
- 9.Saiki RK, Gelfand DH, Stoffel S, Scharf SJ, Higuchi R, Horn GT, Mullis KB, Erlich HA. Science. 1988;239:487. doi: 10.1126/science.2448875. [DOI] [PubMed] [Google Scholar]
- 10.a) Capila I, Linhardt RJ. Angew Chem. 2002;114:426. doi: 10.1002/1521-3773(20020201)41:3<390::aid-anie390>3.0.co;2-b. [DOI] [PubMed] [Google Scholar]; Angew Chem Int Ed. 2002;41:390. [Google Scholar]; b) Linhardt RJ, Toida T. Acc Chem Res. 2004;37:431. doi: 10.1021/ar030138x. [DOI] [PubMed] [Google Scholar]
- 11.Weis WI, Drickamer K. Annu Rev Biochem. 1996;65:441. doi: 10.1146/annurev.bi.65.070196.002301. [DOI] [PubMed] [Google Scholar]
- 12.a) Liang PH, Wu CY, Greenberg WA, Wong CH. Curr Opin Chem Biol. 2008;12:86. doi: 10.1016/j.cbpa.2008.01.031. [DOI] [PMC free article] [PubMed] [Google Scholar]; b) Song X, Lasanajak Y, Xia B, Heimburg-Molinaro J, Rhea JM, Ju H, Zhao C, Molinaro RJ, Cummings RD, Smith DF. Nat Methods. 2011;8:85. doi: 10.1038/nmeth.1540. [DOI] [PMC free article] [PubMed] [Google Scholar]; c) Stevens J, Blixt O, Paulson JC, Wilson IA. Nat Rev Microbiol. 2006;4:857. doi: 10.1038/nrmicro1530. [DOI] [PMC free article] [PubMed] [Google Scholar]
- 13.Oyelaran O, Gildersleeve JC. Curr Opin Chem Biol. 2009;13:406. doi: 10.1016/j.cbpa.2009.06.021. [DOI] [PMC free article] [PubMed] [Google Scholar]
- 14.Li L, Ly M, Linhardt RJ. Mol Biosyst. 2012;8:1613. doi: 10.1039/c2mb25021g. [DOI] [PMC free article] [PubMed] [Google Scholar]
- 15.Grün CH, van Vliet SJ, Schiphorst WE, Bank CM, Meyer S, Die I van, van Kooyk Y. Anal Biochem. 2006;354:54. doi: 10.1016/j.ab.2006.03.055. [DOI] [PubMed] [Google Scholar]
- 16.Wu CS, Cupps JM, Fan X. Nanotechnology. 2009;20:305502. doi: 10.1088/0957-4484/20/30/305502. [DOI] [PubMed] [Google Scholar]
- 17.Pervin A, al-Hakim A, Linhardt RJ. Anal Biochem. 1994;221:182. doi: 10.1006/abio.1994.1395. [DOI] [PubMed] [Google Scholar]
- 18.Baik JY, Gasimli L, Yang B, Datta P, Zhang F, Glass CA, Esko JD, Linhardt RJ, Sharfstein ST. Metab Eng. 2012;14:81. doi: 10.1016/j.ymben.2012.01.008. [DOI] [PMC free article] [PubMed] [Google Scholar]
- 19.a) Skidmore MA, Guimond SE, Dumax-Vorzet AF, Yates EA, Turnbull JE. Nat Protoc. 2010;5:1983. doi: 10.1038/nprot.2010.145. [DOI] [PubMed] [Google Scholar]; b) Yang B, Chang Y, Weyers AM, Sterner E, Linhardt RJ. J Chromatogr A. 2011;1225:91. doi: 10.1016/j.chroma.2011.12.063. [DOI] [PMC free article] [PubMed] [Google Scholar]
- 20.Seidler DG, Dreier R. IUBMB Life. 2008;60:729. doi: 10.1002/iub.115. [DOI] [PubMed] [Google Scholar]
- 21.a) Ramamurthy P, Hocking AM, McQuillan DJ. J Biol Chem. 1996;271:19578. doi: 10.1074/jbc.271.32.19578. [DOI] [PubMed] [Google Scholar]; b) Tarentino AL, Gomez CM, Plummer TH., Jr Biochemistry. 1985;24:4665. doi: 10.1021/bi00338a028. [DOI] [PubMed] [Google Scholar]
- 22.Polanska UM, Fernig DG, Kinnunen T. Dev Dyn. 2009;238:277. doi: 10.1002/dvdy.21757. [DOI] [PubMed] [Google Scholar]
- 23.Li B, Suwan J, Martin JG, Zhang F, Zhang Z, Hoppensteadt D, Clark M, Fareed J, Linhardt RJ. Biochem Pharmacol. 2009;78:292. doi: 10.1016/j.bcp.2009.04.012. [DOI] [PMC free article] [PubMed] [Google Scholar]
- 24.Linhardt RJ, Toida T. Science. 2002;298:1441. doi: 10.1126/science.298.5597.1441. [DOI] [PubMed] [Google Scholar]
- 25.Asiello PJ, Baeumner AJ. Lab Chip. 2011;11:1420. doi: 10.1039/c0lc00666a. [DOI] [PubMed] [Google Scholar]
- 26.a) Rothenberg BE, Hayes BK, Toomre D, Manzi AE, Varki A. Proc Natl Acad Sci USA. 1993;90:11939. doi: 10.1073/pnas.90.24.11939. [DOI] [PMC free article] [PubMed] [Google Scholar]; b) Chang Y, Yang B, Zhao X, Linhardt RJ. Anal Biochem. 2012;427:91. doi: 10.1016/j.ab.2012.05.004. [DOI] [PMC free article] [PubMed] [Google Scholar]
- 27.Klim JR, Li L, Wrighton PJ, Piekarczyk MS, Kiessling LL. Nat Methods. 2010;7:989. doi: 10.1038/nmeth.1532. [DOI] [PMC free article] [PubMed] [Google Scholar]
- 28.Nilsson EC, Storm RJ, Bauer J, Johansson SM, Lookene A, Angstrom J, Hedenstrom M, Eriksson TL, Frangsmyr L, Rinaldi S, Willison HJ, Pedrosa Domellof F, Stehle T, Arnberg N. Nat Med. 2011;17:105. doi: 10.1038/nm.2267. [DOI] [PubMed] [Google Scholar]
- 29.Sarkar IN, Trizna M. PLoS One. 2011;6:e14689. doi: 10.1371/journal.pone.0014689. [DOI] [PMC free article] [PubMed] [Google Scholar]
Associated Data
This section collects any data citations, data availability statements, or supplementary materials included in this article.