

Abstract
Adipose tissue inflammation plays a role in cardiovascular (CV) and metabolic diseases associated with obesity, insulin resistance, and type 2 diabetes mellitus (T2DM). The interactive effects of exercise training and metformin, two first-line T2DM treatments, on adipose tissue inflammation are not known. Using the hyperphagic, obese, insulin-resistant Otsuka Long-Evans Tokushima Fatty (OLETF) rat model, we tested the hypothesis that treadmill training, metformin, or a combination of these reduces the secretion of proinflammatory cytokines from adipose tissue. Compared with Long-Evans Tokushima Otsuka (LETO) control rats (L-Sed), sedentary OLETF (O-Sed) animals secreted significantly greater amounts of leptin from retroperitoneal adipose tissue. Conversely, secretion of interleukin (IL)-10 by O-Sed adipose tissue was lower than that in L-Sed animals. Examination of leptin and IL-10 secretion from adipose tissue in OLETF groups treated with endurance exercise training (O-EndEx), metformin treatment (O-Met), and a combination of these (O-E+M) from 20 to 32 wk of age indicated that 1) leptin secretion from adipose tissue was reduced in O-Met and O-E+M, but not O-EndEx animals; 2) adipose tissue IL-10 secretion was increased in O-EndEx and O-E+M but not in O-Met animals; and 3) only the combined treatment (O-E+M) displayed both a reduction in leptin secretion and an increase in IL-10 secretion. Leptin and IL-10 concentrations in adipose tissue–conditioned buffers were correlated with their plasma concentrations, adipocyte diameters, and total adiposity. Overall, this study indicates that exercise training and metformin have additive influences on adipose tissue secretion and plasma concentrations of leptin and IL-10.
Keywords: obesity, inflammation, insulin resistance, cardiovascular disease
chronic low-grade systemic inflammation is appreciated as a critical biological link between obesity and its association with cardiovascular (CV) and metabolic diseases (2). The etiology of this inflammation seems to be initiated by excessive lipid accumulation and expansion of adipocytes resulting in the activation of cellular stress pathways, which in turn, signal the recruitment and activation of immune cells into adipose tissue (37). These cells are primarily responsible for the increased circulating concentrations of a number of proinflammatory cytokines and the systemic proinflammatory state that is recognized as a hallmark of obesity and the metabolic syndrome (7). Indeed, inflamed adipose tissue is implicated in the pathogenesis of insulin resistance, type 2 diabetes mellitus (T2DM), endothelial dysfunction, and atherosclerosis (5).
The current standard of care for patients upon diagnosis of T2DM is pharmacologic treatment with metformin, and advice that the patient become physically active and lose weight (1). These therapies are well established as effective glucose-lowering and insulin-sensitizing approaches when prescribed in isolation to insulin-resistant patient populations (4, 22), and there is some evidence to indicate that the inflammatory component of these pathologies can be ameliorated by exercise or metformin treatment when prescribed individually (8, 30, 31, 33, 41). The combined treatments, however, have received less attention. Exercise and metformin produced additive effects on GLUT4 protein expression in skeletal muscle of Zucker diabetic fatty rats fed a high-fat diet, suggesting a possible metabolic benefit of the combined therapies (38). On the other hand, recent data from prediabetic humans indicate that exercise combined with metformin therapy may not necessarily produce favorable influences on certain metabolic syndrome parameters (22, 23). In fact, the typically observed insulin sensitization effect of exercise training may be blunted with metformin cotherapy (22). It is unclear why the combined therapies did not produce beneficial effects, but interestingly, the inflammatory marker C-reactive protein was reduced by both treatments individually but not by the combined therapies (23), raising the hypothesis that inflammation may have played a role. However, the combined effects of exercise training and metformin on systemic inflammatory markers or on the inflammatory phenotype of particular sources of systemic inflammation (e.g., adipose tissue) have, to our knowledge, never been examined.
The aim of the present investigation was to test the hypothesis that exercise training, metformin, and their use in combination decrease secretion of inflammatory markers by adipose tissue and, as a result, normalize plasma concentrations of a panel of cytokines with known roles in insulin resistance and CV disease. The eight cytokines chosen for investigation have established roles in 1) immunity and inflammatory responses [i.e., leptin, interleukin (IL)-6, IL-1β, and tumor necrosis factor (TNF)-α], 2) recruiting immune cells into inflamed tissue [i.e., IL-12p70, monocyte chemoattractant protein (MCP-1), and RANTES (regulated-upon-activation, normal T-cell expressed, and presumably secreted)], and 3) anti-inflammatory effects via repression of proinflammatory cytokine activity and signaling (i.e., IL-10). Using the hyperphagic, obese, insulin-resistant, type 2 diabetic Otsuka Long-Evans Tokushima Fatty (OLETF) rat model, we tested the hypothesis that endurance exercise treadmill training or metformin used both alone and in combination would favorably influence the secretion of these cytokines from adipose tissue. We also hypothesized that treatment effects on adipose tissue cytokine secretion would be related to effects on circulating cytokine levels, adipocyte diameter, and body composition.
METHODS
Animals and experimental design.
Male Long-Evans Tokushima Otsuka (LETO; n = 10) and OLETF rats (n = 48) were obtained at age 4 wk (Tokushima Research Institute, Otsuka Pharmaceutical; Tokushima, Japan). The OLETF rat, characterized by a mutated cholestykinin-1 receptor that results in a hyperphagic phenotype, is an established model of obesity, insulin resistance, and T2DM (12). Animals were individually housed in a temperature-controlled (21°C) environment with 0600–1800 h light and 1800–0600 h dark cycles. The rats were randomly assigned to one of four groups (n = 12/group): 1) sedentary (O-Sed), 2) endurance exercise (O-EndEx), 3) metformin treatment (O-Met), or 4) endurance exercise and metformin combined (O-E+M). Sedentary LETO (L-Sed) animals were used as healthy, nonhyperphagic controls. At age 19 wk, all animals except L-Sed were exposed to treadmill running at 15 m/min for 5 min/day to allow for acclimation to the running stimulus. Treatments began at 20 wk of age, because our group has previously documented that the OLETF rat becomes hyperglycemic and hyperinsulinemic at this age and exhibits elevated hemoglobin (Hb) A1c levels (3, 17, 35, 36). EndEx treatment initially consisted of treadmill running at a speed of 15 m/min on a 15% incline for 5 min/day. Duration and speed were gradually increased by 2–3 min/day and 1–2 m/min per wk such that by wk 4 the animals were running at a speed of 20 m/min on a 15% incline for 60 min/day, 5 days/wk. This training volume was maintained for the remainder of the experiment until animals were killed. Metformin (Bosche Scientific) was administered in drinking water (150 mg·kg−1·day−1 during the first week; 300 mg·kg−1·day−1 thereafter) (25). All groups were given ad libitum access to standard chow with a macronutrient composition of 56% carbohydrate, 17% fat, and 27% protein (Formulab 5008, Purina Mills, St Louis, MO). Rats were anesthetized at 30–32 wk of age with an intraperitoneal injection of sodium pentobarpital (100 mg/kg). Tissues were then harvested and the animals were killed by exsanguination. The last exercise bout for O-EndEx and O-E+M animals was performed ∼18 h prior to death. Food was removed from the cages 12 h prior to death, and water (including metformin-treated water for O-Met and O-E+M groups) was removed on the morning of the experiment (∼1 h prior to death). All protocols were approved by the University of Missouri Animal Care and Use Committee.
Body weight, body composition, and food intake.
Body weights and food intakes were monitored and recorded on a weekly basis. Weekly food intakes were averaged across the period of the intervention (age 20–30 wk). Body composition was assessed by dual energy X-ray absorptiometry (DXA; Hologic QDR-1000, calibrated for rodents) on the day of death. Omental and retroperitoneal (RP) adipose tissue depots were then removed and weighed to the nearest 0.01 g.
Blood parameters.
Whole blood was collected on the day of euthanasia for analysis of glycosylated hemoglobin (HbA1c) by the boronate-affinity high-performance liquid chromatography method (Primus Diagnostics, Kansas City, MO) in the Diabetes Diagnostics Laboratory at the University of Missouri. Serum samples were prepared by centrifugation and stored at −80°C until analysis. Glucose, triglyceride (TG), and nonesterified fatty acid (NEFA) assays were performed by a commercial laboratory (Comparative Clinical Pathology Services, Columbia, MO) on an Olympus AU680 automated chemistry analyzer (Beckman-Coulter, Brea, CA) using commercially available assays according to manufacturers' guidelines. Plasma insulin concentrations were determined using a commercially available, rat-specific enzyme-linked immunosorbent assay (Alpco Diagnostics, Salem, NH). Samples were run in duplicate and manufacturers' controls and calibrators were used according to assay instructions.
Immunohistochemistry.
Formalin-fixed RP adipose tissue samples were processed through paraffin embedment, sectioned at 5 μm, and stained with hematoxylin and eosin for morphometric determinations. Sections were examined using an Olympus BX60 photomicroscope (Olympus, Melville, NY) and photographed at 10× magnification using a Spot Insight digital camera (Diagnostic Instruments, Sterling Heights, MI). For each sample, no less than five fields of view were selected for the analysis. The diameters of at least 100 adipocytes were measured using Image Pro imaging software (MediaCybernetics, Bethesda, MD). The average value of these 100 individually measured adipocyte diameters was calculated for each rat. In addition, the distribution of cells of discrete size categories was examined as described previously (17, 18). A single operator who was blind to the study performed all imaging and adipocyte diameter measurements.
Preparation of adipose tissue–conditioned buffers.
At death, RP adipose tissue depots were harvested for preparation of adipose-conditioned buffer as described previously (29), with minor modifications. Briefly, one of the two RP fat pads were incubated in filter-sterilized physiological saline solution (PSS; pH 7.4; 6 g tissue/ml) for 60 min at 37°C in a shaking water bath. In pilot experiments of 30-, 60-, and 120-min adipose tissue incubations, the 60-min incubation protocol produced optimal results for the purposes of the present study. PSS contained (in mM): 25 3-(N-morpholino)propanesulfonic acid (MOPS), 1.2 NaH2PO4, 5.0 glucose, 2.0 pyruvate, 0.02 EDTA, 145 NaCl, 4.7 KCl, 2.0 CaCl2, and 1.17 MgSO4. Following incubation, the tissue was discarded and the conditioned buffers were aliquoted and stored at −80°C for future analysis. Our modified approach of using 6 g tissue/ml PSS instead of 3 g tissue/ml PSS as described by Payne et al. (29) was chosen in light of the fact that their adipose tissue–conditioned medium contained concentrations of cytokines that were at or near the lower limit of detection of the assay. Thus with a more concentrated conditioned media preparation we expected to observe concentrations of cytokines that were well within the normal limits of the multiplex assay that we employed (and importantly, also used by Payne et al., Ref. 29). Additionally, an alternative approach would have been to use a fixed amount of adipose tissue for the conditioned buffers rather than the whole RP fat pad, and adjusting the volume of sterile PSS added to achieve the desired concentration of 6 g/ml. However, this approach would have required cutting and handling the tissue, which might have been problematic given observations from our group indicating that mincing/cutting of adipose tissue induces substantial (∼200-fold) expression of inflammatory genes such as TNF-α (J.M. Company and F.W. Booth, unpublished observations). Thus all samples were handled with minimal cutting of the tissue beyond that required for the dissection and were rapidly weighed and placed in sterile PSS. It was ensured that buffer volumes were sufficient to cover the entire sample. Finally, the use of a strong buffering agent (i.e., high concentration of MOPS) was employed to prevent unwanted confounding effects of hypoxia and any consequent metabolic acidosis.
Cytokine concentrations in conditioned buffers and plasma.
Adipose tissue–conditioned buffers and plasma samples were assayed in duplicate for concentrations of leptin, IL-1β, IL-6, IL-10, IL-12p70, MCP-1, TNF-α, and RANTES using a multiplex cytokine assay (Millipore Milliplex, cat no. RCYTOMAG-80K; Billerica, MA) on a MAGPIX instrument (Luminex Technologies; Luminex, Austin, TX) according to the manufacturer's instructions.
Statistics.
One-way analysis of variance (ANOVA) was used to test for differences among groups in body weights, food intakes, percent body fat, fat pad weights, adipocyte diameters, and cytokine concentrations in adipose tissue–conditioned buffers and plasma. Fishers protected least significant difference post hoc comparisons were performed in the event of a significant omnibus ANOVA. All analyses were performed using SPSS version 19 software (IBM, Chicago, IL). Data are presented as means ± SE, and P ≤ 0.05 was used as the criterion for statistical significance.
RESULTS
Body weight, body composition, and food intake.
Mean body weights, percent body fat, fat pad masses, and food intake were all significantly greater in the O-Sed group than the L-Sed group (Fig. 1, A–G, P < 0.05). O-EndEx, O-Met, and O-E+M groups had 15%, 6%, and 21% lower body weights than the O-Sed group, respectively (all P < 0.05 vs. O-Sed and P < 0.05 vs. each other; Fig. 1A). The food intake data (Fig. 1B) displayed similar patterns to those of body weights, as O-EndEx, O-Met, and O-E+M animals had 12%, 7%, and 22% lower mean food intakes during wk 20–32 than the O-Sed animals, respectively (all P < 0.05 vs. O-Sed and P < 0.05 vs. each other; Fig. 1B). When these food intake values were normalized to grams of body weight, OLETF groups remained significantly more elevated than L-Sed animals, consistent with their hyperphagic phenotype (P < 0.05, Fig. 1C). However, there were no differences among OLETF groups in normalized food intake (P > 0.05). O-EndEx and O-E+M, but not O-Met animals, had significantly lower percent body fat as measured by DXA than O-Sed animals (P < 0.05; Fig. 1D). Similarly, RP mass in O-Met animals was not significantly different from that of O-Sed animals (P > 0.05), whereas O-EndEx and O-E+M animals had 41% and 50% lower RP mass than O-Sed animals, respectively (P < 0.05; Fig. 1E). O-EndEx, O-Met, and O-E+M animals had 55%, 25%, and 67% lower omental fat pad mass than O-Sed animals (all P < 0.05; Fig. 1F). O-EndEx and O-E+M omental fat masses were not different from each other, but were significantly lower than those in O-Met animals (P < 0.05). Importantly, omental fat mass was not significantly different between O-E+M and L-Sed animals (P > 0.05). Epididymal fat mass was also lower in O-EndEx and O-E+M groups than in the O-Sed groups (P < 0.05), but again the difference between O-Met and O-Sed animals was not significant (P > 0.05; Fig. 1G). Epididymal fat mass of O-E+M animals was lower than that of O-EndEx and O-Met animals, but greater than that of L-Sed animals (all P < 0.05).
Fig. 1.
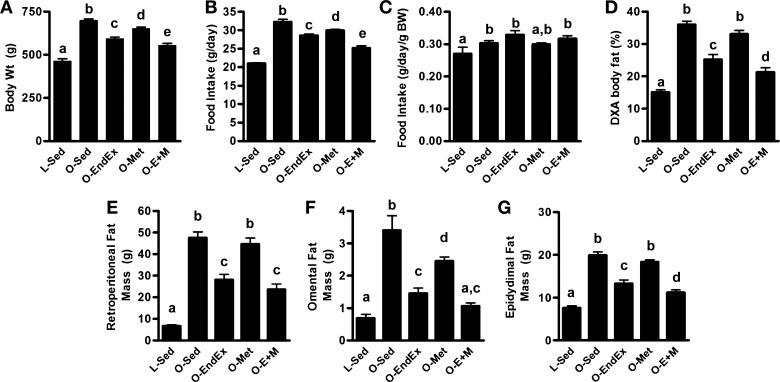
Effects of endurance exercise training, metformin, and their combination on (A) body weight; (B) food intake; (C) food intake normalized to body weight; (D) percent body fat; and retroperitoneal (E), omental (F), and epididymal (G) fat pad masses. Data with unlike letters are significantly different from each other (P < 0.05).
Blood parameters.
Blood parameters are presented in Table 1. HbA1c levels were lower (P = 1.1 × 10⁻¹⁴) in L-Sed than O-Sed animals. Analysis of intervention effects indicated that O-EndEx, O-Met, and O-E+M animals had lower HbA1c levels than O-Sed animals (all P < 0.05), although only O-E+M levels were restored to levels of L-Sed animals such that the pairwise comparison between the two groups was not statistically significant (see exact P values in footnote in Table 1). Serum glucose, insulin, TG, and NEFA levels were all significantly greater in O-Sed than in L-Sed animals (all P < 0.05), and whereas all levels in O-Met animals were not different from those in O-Sed animals, they were all significantly lower in O-EndEx and O-E+M animals (P < 0.05). Further, insulin levels were completely normalized in O-EndEx animals to levels found in L-Sed animals, while glucose, insulin, and TG were all completely normalized in O-E+M animals (although the P values for TG approached statistical significance; see footnote in Table 1).
Table 1.
Blood parameters
| L-Sed | O-Sed | O-EndEx | O-Met | O-E+M | |
|---|---|---|---|---|---|
| Glucose (mg/dl) | 152 ± 4a | 300 ± 12b | 236 ± 22c | 283 ± 21b | 189 ± 9a |
| Insulin (ng/ml) | 3.1 ± 0.4a | 8.2 ± 2.1b | 4.4 ± 0.5a | 7.1 ± 1.0b | 4.3 ± 0.3a |
| HbA1c (%) | 4.9 ± 0.04a | 7.0 ± 0.13b | 5.4 ± 0.03c | 5.3 ± 0.06c | 5.0 ± 0.04a,c |
| TG (mg/dl) | 44 ± 3a | 360 ± 40b | 121 ± 15a* | 337 ± 46b | 125 ± 26a* |
| NEFA (mmol/l) | 0.28 ± 0.02a | 0.92 ± 0.06b | 0.57 ± 0.05c | 0.89 ± 0.06b | 0.53 ± 0.07c |
Values are means ± SE. Values with like letters are significantly different from each other. P values for HbA1c vs. L-Sed were as follows: O-EndEx, P = 0.01; O-Met, P = 0.05; O-E+M, P = 0.52.
P = 0.08 and 0.07 for O-EndEx vs. L-Sed and O-E+M vs. L-Sed comparisons, respectively.
Adipocyte diameters.
The O-Sed group had significantly more adipocytes of larger sizes (i.e., the RP adipocyte diameter distribution curve of the O-Sed group was shifted to the right relative to the L-Sed group; Fig. 2A). Among the OLETF intervention groups, only the O-E+M rats displayed an adipocyte diameter distribution that resembled that of the L-Sed rats (Fig. 2A). Analysis of adipocyte diameter summary data (Fig. 2B) indicated that O-Sed rats had significantly larger average adipocyte diameters than L-Sed rats (P < 0.05), and average adipocyte diameters in O-E+M rats were significantly smaller than those of O-Sed rats but not significantly different from those of L-Sed rats (P > 0.05; Fig. 2B). Adipocyte diameters of O-EndEx animals did not differ from those of other intervention groups.
Fig. 2.

Distribution of RP adipocyte diameters (A) and summary data (B) among groups. The vertical dashed line indicates the median adipocyte diameter of the L-Sed group. Data with unlike letters are significantly different from each other (P < 0.05).
Retroperitoneal adipose tissue cytokine secretion and plasma cytokine concentrations.
RP adipose tissue-secreted leptin (Fig. 3A) was greater in O-Sed animals than in L-Sed animals (2.6-fold, P < 0.05), while that in O-EndEx, O-Met, and O-E+M animals was lower than that of O-Sed animals by 18% (trend: P = 0.07), 33% (P < 0.05), and 50% (P < 0.05), respectively. IL-10 secretion was 43% lower in O-Sed than L-Sed animals (P < 0.05; Fig. 3B). O-EndEx and O-E+M animals had IL-10 secretion levels that were ∼130–140% greater than levels in O-Sed animals (P = 0.02 and P = 0.03, respectively), but they were not different from levels in L-Sed animals (P = 0.75 and P = 0.94, respectively), and O-Met IL-10 secretion was not different from that of O-Sed, O-EndEx, or O-E+M groups (Fig. 3B). Because there were substantial differences among groups in RP mass, it is possible that the contribution of this depot to systemic (plasma) levels of leptin and IL-10 were linked to differences in RP mass. Thus to account for differences in fat pad weights, we calculated secretion levels from the whole fat pad as the product of leptin and IL-10 concentrations in the conditioned buffer (pg/ml) × RP mass (g). Levels of leptin secretion in O-Sed animals from the whole RP pad were ∼17-fold higher than those of the L-Sed group (P < 0.05), while O-EndEx, O-Met, and O-E+M groups had 57%, 45%, and 77% lower levels than the O-Sed group (all P < 0.05; Fig. 3C). Levels of IL-10 secretion in O-Sed animals from the whole RP pad were approximately threefold greater than those of the L-Sed group (P < 0.05), whereas there were no significant differences among O-Sed and the intervention groups (P > 0.05; Fig. 3D).
Fig. 3.

Effects of endurance exercise training, metformin, and their combination on leptin secretion from RP adipose tissue (A), IL-10 secretion from RP adipose tissue (B), leptin secretion × RP mass (C), IL-10 secretion × RP mass (D), plasma leptin concentrations (E), and plasma IL-10 concentrations (F). Data with unlike letters are significantly different from each other (P < 0.05).
Plasma leptin levels were ninefold higher in O-Sed than in L-Sed animals (P < 0.05), whereas O-EndEx and O-E+M animals had, respectively, 65% and 75% lower plasma leptin levels than O-Sed animals (P < 0.05; Fig. 3E). Plasma IL-10 levels were greater in all OLETF groups than the L-Sed group (P < 0.05), and although the mean IL-10 levels were highest in O-EndEx animals, the differences among OLETF groups were not statistically significant (Fig. 3F).
To investigate the functional implications of the effects of the endurance exercise training, metformin, and combined interventions on adipose tissue cytokine secretion, we examined the relationships among mean concentrations of leptin (Fig. 4A) and IL-10 (Fig. 4B) present in adipose tissue–conditioned buffers vs. their mean plasma concentrations. There was a positive linear relationship between concentrations of leptin in adipose tissue–conditioned buffers and plasma across group means (r = 0.85, Fig. 4A). Similarly, there was a strong relationship between secreted and circulating IL-10 concentrations (r = 0.81, Fig. 4B), although this relationship was observed only within the OLETF rats (i.e., when L-Sed means were excluded from the analysis there was no apparent relationship with all groups included). The relationships among group means in plasma leptin and IL-10 concentrations with their respective secretion levels from the whole fat pad (pg/ml × g tissue) were quite strong (r = 0.97 for leptin, r = 0.92 for IL-10; Fig. 4, C and D).
Fig. 4.

Correlations between (A) leptin concentrations in RP adipose tissue-conditioned buffers and plasma leptin concentrations; (B) IL-10 concentrations in RP adipose tissue-conditioned buffers and plasma IL-10 concentrations; (C) the product of leptin secretion × RP mass and plasma leptin concentrations; and (D) the product of IL-10 secretion × RP mass and plasma IL-10 concentrations. Note that the relationship shown for IL-10 (B) is among OLETF groups only.
Adipocyte diameter group means were strongly and positively related to means for adipose tissue-secreted leptin (r = 0.87; Fig. 5A) and negatively related to means for adipose tissue-secreted IL-10 (r = −0.81; Fig. 5B). Similarly, means of percent body fat were positively related to adipose tissue–secreted leptin (r = 0.83; Fig. 5C) and negatively related to adipose tissue–secreted IL-10 (r = −0.83; Fig. 5D).
Fig. 5.
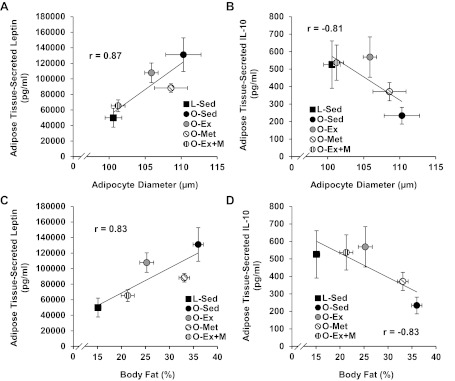
Correlations between adipocyte diameters and RP adipose tissue-secreted leptin (A) and IL-10 (B), and percent body fat and secreted leptin (C) and IL-10 (D).
To gain insight into whether these treatment effects on leptin and IL-10 RP adipose tissue secretion and their plasma concentrations were related to our observations of improved HbA1c levels, we also examined correlations among mean concentrations of plasma leptin and IL-10 concentrations vs. HbA1c levels. Although there was only a weak relationship between plasma IL-10 and HbA1c among the groups (r = 0.20), the relationship between plasma leptin and HbA1c was robust (r = 0.91, Fig. 6).
Fig. 6.

Correlation between plasma leptin and HbA1c levels.
The remaining cytokines examined are presented in Table 2 (adipose tissue) and Table 3 (plasma). There were few statistically significant differences among groups in these cytokines in adipose tissue–conditioned buffers, with the exceptions of higher MCP-1 and IL-6 secretion in L-Sed animals than in the other groups, with TNF-α and IL12-p70 being lowest in O-E+M animals (all P < 0.05; Table 2A). Secretion levels of IL-1β, IL-12p70, MCP-1, and RANTES from the whole RP fat pad (pg/ml × g RP mass) were significantly greater in O-Sed than L-Sed animals (all P < 0.05; Table 2B). The elevations of IL-1β in O-Sed animals were partially corrected in O-EndEx and O-E+M animals (P < 0.05 vs. O-Sed) but not restored to the level found in L-Sed animals, while O-Met IL-1β levels were higher than those of L-Sed animals but were not different from those of O-Sed animals. IL-12p70, MCP-1, and TNF-α were completely normalized (i.e., they were not different from levels in L-Sed animals) in the O-EndEx and O-E+M groups, but not in the O-Met group. RANTES secretion levels from the RP pad were partially reversed in the O-EndEx group, were not different between O-Met and O-Sed groups, and were completely reversed in the O-E+M group.
Table 2.
Adipose tissue-conditioned buffer cytokine concentrations
| A. Conditioned buffer (pg/ml) | L-Sed | O-Sed | O-EndEx | O-Met | O-E+M |
|---|---|---|---|---|---|
| IL-1β | 458 ± 180 | 260 ± 34 | 318 ± 55 | 262 ± 30 | 328 ± 42 |
| IL-6 | 445 ± 128a | 140 ± 50b | 129 ± 41b | 82 ± 27b | 235 ± 67b |
| IL-12p70 | 18 ± 4a,b | 15 ± 3a,b | 12 ± 1a,b | 20 ± 8a | 9 ± 1b |
| MCP-1 | 98 ± 22a | 62 ± 8b | 57 ± 7b | 52 ± 6b | 59 ± 13b |
| TNF-α | 11 ± 2a | 8 ± 2a,b | 7 ± 1a,b | 6 ± 1a,b | 5 ± 2b |
| RANTES | 674 ± 191 | 537 ± 49 | 574 ± 106 | 515 ± 53 | 500 ± 38 |
| B. Conditioned buffer (pg/ml) × RP mass (g) | L-Sed | O-Sed | O-EndEx | O-Met | O-E+M |
|---|---|---|---|---|---|
| IL-1β | 3316 ± 1329a | 12728 ± 1815b | 8781 ± 1315c | 11413 ± 1389b,c | 7648 ± 1156c |
| IL-6 | 3280 ± 1146 | 7203 ± 2704 | 3173 ± 794 | 3551 ± 1314 | 4604 ± 1364 |
| IL-12p70 | 130 ± 39a | 717 ± 111b,c | 351 ± 53a,b | 939 ± 341c | 207 ± 31a |
| MCP-1 | 725 ± 193a | 3042 ± 457b | 1577 ± 226a,c | 2299 ± 301b,c | 1300 ± 276a |
| TNF-α | 74 ± 19a | 367 ± 90b | 179 ± 46a,c | 280 ± 77b,c | 108 ± 30a |
| RANTES | 4861 ± 1449a | 26276 ± 3370b | 15955 ± 3243c | 22720 ± 2434b,c | 11672 ± 1573a,c |
Values are means ± SE. Values with unlike letters are significantly different from each other (P < 0.05).
Table 3.
Plasma cytokine concentrations
| L-Sed | O-Sed | O-EndEx | O-Met | O-E+M | |
|---|---|---|---|---|---|
| IL-1β | ND | 20 ± 12 | 22 ± 10 | 48 ± 12 | 45 ± 22 |
| IL-6 | 14 ± 10a | 718 ± 159b | 344 ± 87a,b | 627 ± 198b | 510 ± 160b |
| IL-12p70 | 10 ± 3a | 78 ± 41b | 28 ± 12a,b | 34 ± 19a,b | 33 ± 13a,b |
| MCP-1 | 36 ± 16a | 54 ± 7a | 15 ± 6b | 57 ± 13a | 12 ± 4b |
| TNF-α | 3 ± 1 | 6 ± 3 | 4 ± 1 | 3 ± 1 | 3 ± 1 |
| RANTES | 1213 ± 189 | 975 ± 54 | 868 ± 115 | 4036 ± 2956 | 850 ± 36 |
Values are means ± SE. Units are pg/ml. Values with unlike letters are significantly different from each other (P < 0.05).
In plasma (Table 3), the O-Sed group had significantly higher IL-6 and IL12p70 concentrations than the L-Sed group, but there were no differences among O-Sed and the OLETF intervention groups (P > 0.05). Plasma MCP-1 concentrations were lower in O-EndEx and O-E+M groups than all other groups (P < 0.05). There were no significant relationships between adipose tissue–conditioned buffer and plasma concentrations among cytokines other than leptin and IL-10.
DISCUSSION
The major findings of the current study are as follows: 1) leptin secretion from adipose tissue is reduced by metformin with or without endurance exercise treadmill training; 2) IL-10 secretion from adipose tissue is increased by treadmill exercise training with or without metformin; and 3) only the combination of endurance training and metformin is effective in both reducing leptin secretion and increasing IL-10 secretion in the OLETF rat model of obesity and insulin resistance. These treatment effects on adipose tissue secretion of leptin and IL-10 were closely linked to effects on adipocyte diameter and body composition and to effects on plasma concentrations. Importantly, our finding that IL-10 secretion was enhanced by exercise training is to our knowledge the first indication that exercise training can increase secretion of an anti-inflammatory factor from adipose tissue. These data highlight the notion put forth by Thyfault and Rector (44) that exercise has a beneficial impact on other tissues besides skeletal muscle. Overall, this study provides evidence from an obese rodent model that treatment of insulin resistance/T2DM with exercise training, metformin, and particularly the two treatments combined, can favorably alter adipose tissue secretion and plasma concentrations of leptin and IL-10 and shift the adipose tissue toward an anti-inflammatory phenotype.
Leptin is secreted primarily from white adipose tissue and, although it was originally believed to function just as a satiety hormone, it is now known that in excess, it may have deleterious effects on numerous tissues (10, 14, 28). The most consistent circulating leptin-lowering effects of exercise have been observed when weight loss is achieved (15, 16, 21, 32, 34, 43). Indeed, the available data suggest that regular exercise without weight loss has little effect on circulating leptin concentrations (21, 43) or leptin gene expression in adipose tissue (46, 47). Our data are in line with those of previous observations, in that leptin secretion and circulating levels were restored in O-E+M animals to the lower levels observed in L-Sed rats. Because this reversal was not observed in either O-EndEx or O-Met animals alone, our data stimulate the hypothesis for future studies that combined metformin therapy and lifestyle modification with exercise training may be optimal for the reduction of circulating leptin concentrations in obese, insulin-resistant humans. Furthermore, data from rodents (17, 27, 49) and humans (16, 34) also support the idea that alterations in adipocyte size are closely associated with circulating leptin concentrations. This is in agreement with our observed relationship between adipocyte diameters and adipose tissue leptin secretion, which was in turn, related to plasma leptin concentrations (whether expressed as concentrations in the conditioned buffers or as secretion from the whole fat pad). There is some evidence that metformin also is effective in reducing plasma leptin concentrations (8) and in vitro secretion from cultured adipose tissue (26); however, the combined treatments have not been previously investigated. Therefore, our study provides the first evidence that the combination of exercise and metformin treatment initiated at the onset of T2DM and moderate insulin resistance not only reduces the secretion of leptin from adipose tissue, but restores leptin secretion to the level observed in lean, healthy rats (L-Sed).
The anti-inflammatory actions of IL-10 include suppression of nuclear factor-κB induction by proinflammatory cytokines (e.g., TNF-α and IL-1β) and stimulation of an anti-inflammatory gene expression program (42). It seems possible that the effect on adipose tissue IL-10 could have systemic consequences for circulating levels of IL-10, because secreted and plasma IL-10 levels were correlated within the OLETF groups. Thus given the well-established anti-inflammatory role of IL-10, our data suggest that adipose tissue–derived IL-10 may be a signal participating in the beneficial effects of exercise on numerous tissues. Our data are generally consistent with previous findings regarding the effects of endurance training on IL-10 secretion/expression by different cell types. Basal IL-10 production by circulating monocytes has been documented to increase by ∼10-fold following 6 mo of moderate endurance exercise training in patients at risk for ischemic heart disease (39). Exercise training also increased IL-10 expression in RP fat in a cachectic rodent model (20) as well as in healthy rats (19). To the best of our knowledge, the effects of metformin on adipose tissue–secreted or circulating levels of IL-10 have not been previously studied. The present study suggests that metformin therapy alone does not alter IL-10 secretion from adipose tissue.
Although we have focused the present report on our leptin and IL-10 data, there were some notable findings regarding the other cytokines included in our panel. First, our findings of greater adipose tissue IL-6 secretion in the L-Sed group than all OLETF groups (Table 2A), with greater IL-6 plasma concentrations in the O-Sed group than in the L-Sed group (Table 3), were unexpected. However, on the basis of prior evidence that IL-6 can stimulate lipolysis in adipocytes (45) and the smallest adipocyte diameters being associated with the highest IL-6 secretion in L-Sed and O-E+M groups in our study, we can speculate that the greater IL-6 release from adipose tissue in these groups may reflect the known lipolytic effects of IL-6. Regarding our plasma IL-6 data, chronic circulating IL-6 concentrations are elevated in patients with inflammatory conditions such as CV disease and T2DM, which is consistent with our findings. However, IL-6 unequivocally has anti-inflammatory effects on several organs and tissues (6, 33), and it is known that a high circulating level of IL-6 in chronic low-grade inflammatory states does not necessarily mean that IL-6 is proinflammatory in every condition (31). In addition, plasma MCP-1 and IL-12p70 were elevated in O-Sed animals and reduced to near L-Sed levels in O-EndEx animals, further supporting the efficacy of regular exercise for the reduction of systemic inflammation. However, these effects were not entirely consistent with concentrations observed in adipose tissue–conditioned buffers. Indeed, secretion of MCP-1 and several other cytokines (although only MCP-1 reached statistical significance) was, surprisingly, higher in the L-Sed group than all OLETF groups. A possible explanation for these dissociations between cytokine concentrations in the RP adipose tissue–conditioned buffers (Table 2A) and plasma concentrations (Table 3) might be that hyperphagia/obesity (O-Sed) and the different interventions produced markedly different total RP weights among the groups (Fig. 1E). Thus the total contribution of adipose tissue–derived cytokines to the plasma concentrations might be driven by not only the amount of secretion per unit of tissue but also by the tissue mass. To gain insight into this issue, we calculated the product of cytokine concentrations in the conditioned buffers × RP mass (Fig. 4, C and D and Table 2B). This metric seems to provide an index of RP adipose tissue contribution to the systemic circulation, because 1) total RP secretions of leptin and IL-10 were closely linked to their plasma concentrations, 2) the differences between L-Sed and O-Sed groups in MCP-1 secretion from the whole RP pad were more in line with plasma concentrations, and 3) O-EndEx and O-E+M animals experienced partial or complete restoration of several cytokines to levels found in L-Sed animals (IL-1β, IL-12p70, MCP-1, TNF-α, and RANTES) when taking into account the differences among groups in RP fat mass in this manner. Thus taken together, these data indicate that exercise training, metformin, and particularly their combination might favorably influence the mass and inflammatory phenotype of adipose tissue in the OLETF rat, with potential functional relevance for systemic (plasma) levels of the adipose-derived cytokines we examined.
Metformin increases fat oxidation during exercise (24), which could explain why our O-E+M rats had smaller adipocyte diameters, lower percentages of fat, and lower omental fat mass than the O-EndEx group. Because the current literature supports the idea that the key initiating step in adipose tissue inflammation is adipocyte hypertrophy and subsequent infiltration of inflammatory immune cells (2, 9), we speculate that the normalization (i.e., complete restoration to L-Sed levels) of adipocyte diameter in the O-E+M group is an important mechanism underlying our observation of normalized HbA1c levels in this group. In support of this speculation, our data indicate that only O-E+M animals exhibited complete normalization in adipocyte diameter, which was also associated with complete normalization of leptin secretion and plasma leptin levels, which were in turn, associated with the normalized HbA1c levels (Fig. 6). These data are consistent with the notion that adipocyte hypertrophy (more so than increases in percent of fat or adipose tissue mass, which were not restored to L-Sed levels in any OLETF intervention group) is a key therapeutic target for the treatment of obesity-related CV and metabolic complications (9).
Recent studies in humans indicate that adding metformin to exercise training might actually blunt favorable training-induced adaptations in CV/metabolic variables in the OLETF rat such as insulin sensitivity (22) and metabolic syndrome score (23). In contrast, we observed additive beneficial effects of the combined therapies on glucose, insulin, and HbA1c such that levels in O-E+M animals were restored to those in L-Sed animals. Thus there is clearly a need for further work to reconcile the discrepancy between the previous findings from humans and the present data from the OLETF rat model. Nevertheless, our findings of improved HbA1c, glucose, and insulin levels were closely linked to adipose tissue–secreted leptin and plasma leptin concentrations. Because leptin can inhibit insulin-stimulated glucose uptake in skeletal muscle and adipose tissue (11, 40, 48), it seems possible that attenuated adipose tissue–derived leptin secretion might play a mechanistic role in the favorable effects of combined endurance training and metformin treatment on glycemic control in the OLETF rat model.
Limitations.
Although our study achieved its primary aim of testing the hypothesis that endurance exercise plus metformin can improve inflammatory cytokine secretion from adipose tissue, we were unable to answer all of the mechanistic questions related to its outcomes. Because our goal was to study adipose tissue as a tissue (i.e., a collection of cells with their in vivo interactions remaining largely intact), our study did not establish the contributions of adipocytes vs. resident immune cells within the adipose tissue to the secretion of IL-10, leptin, and the other cytokines we examined. However, on the basis of substantial evidence, it seems likely that leptin was largely derived from the adipocytes while the remaining cytokines were primarily derived from the nonadipose immune cells residing within the tissue (7). Further, our approach of studying secretion from whole adipose tissue explants has been promoted as a strategy for studying the effects of lifestyle interventions on adipose tissue physiology (13). Nevertheless, examination of the effects of exercise training and metformin on adipocytes and adipose tissue–resident immune cells in isolation will be an important priority for future studies. Additionally, because the effects of our interventions on body composition and adipocyte sizes were closely related to effects on cytokine secretion, we cannot be certain whether the altered cytokine secretion was due to exercise training/metformin effects per se or simply a consequence of changes in adipose tissue mass or cell size. Further studies are required to examine the effects of the interventions used in the present study, independent of changes in fat mass, on adipose tissue inflammation. We also did not assess clearance of the cytokines from the circulation, which likely influenced our observations relative to plasma cytokine concentrations in addition to secretion. Finally, we have not yet examined whether other tissues (e.g., the vasculature) might be favorably influenced by exercise/metformin treatment-induced changes in their “crosstalk” with adipose tissue.
Conclusions.
In summary, combined metformin and exercise training treatment had more potent effects than either treatment alone on adipose tissue secretion and plasma concentrations of IL-10 and leptin in OLETF rats. These effects of combined exercise training and metformin were associated with complete reversal of elevations in serum glucose and insulin levels, HbA1c, omental fat mass, and adipocyte diameters. Overall, we conclude that the combination of exercise training and metformin therapy may be an effective approach to attenuate the adipose tissue inflammation associated with obesity and metabolic disease.
GRANTS
Funding was provided by National Institutes of Health Grants T32-AR048523 (N.T.J. and J.S.M) and RO1-HL036088 (M.H.L.), Veterans Administration Grant VA-CDA-IK2 BX001299–01 (R.S.R.), American Heart Association Grant 11POST5080002 (J.P.), and anonymous gifts (F.W.B.) This work was supported in part with resources and the use of facilities at the Harry S. Truman Memorial Veterans Hospital in Columbia, MO.
DISCLOSURES
No conflicts of interest, financial or otherwise, are declared by the author(s).
AUTHOR CONTRIBUTIONS
Author contributions: N.T.J., J.P., F.W.B., R.S.R., and M.H.L. conception and design of research; N.T.J., J.P., A.A.A.-E., D.S.B., J.S.M., H.J.L., and R.S.R. performed experiments; N.T.J. and J.P. analyzed data; N.T.J., J.P., R.S.R., and M.H.L. interpreted results of experiments; N.T.J. and A.A.A.-E. prepared figures; N.T.J. and J.P. drafted manuscript; N.T.J., J.P., A.A.A.-E., D.S.B., J.S.M., H.J.L., F.W.B., R.S.R., and M.H.L. edited and revised manuscript; N.T.J., J.P., A.A.A.-E., D.S.B., J.S.M., H.J.L., F.W.B., R.S.R., and M.H.L. approved final version of manuscript.
ACKNOWLEDGMENTS
The authors gratefully acknowledge the excellent technical assistance of Pam Thorne and Grace Meers.
REFERENCES
- 1. American Diabetes Association Standards of medical care in diabetes–2012. Diabetes Care 35 Suppl 1: S11–S63, 2012 [DOI] [PMC free article] [PubMed] [Google Scholar]
- 2. Bays HE. Adiposopathy is “sick fat” a cardiovascular disease? J Am Coll Cardiol 57: 2461–2473, 2011 [DOI] [PubMed] [Google Scholar]
- 3. Bunker AK, Arce-Esquivel AA, Rector RS, Booth FW, Ibdah JA, Laughlin MH. Physical activity maintains aortic endothelium-dependent relaxation in the obese type 2 diabetic OLETF rat. Am J Physiol Heart Circ Physiol 298: H1889–H1901, 2010 [DOI] [PMC free article] [PubMed] [Google Scholar]
- 4. Diabetes Prevention Program Research Group Reduction in the incidence of Type 2 diabetes with lifestyle intervention or metformin. N Eng J Med 346: 393–403, 2002 [DOI] [PMC free article] [PubMed] [Google Scholar]
- 5. Donath MY, Shoelson SE. Type 2 diabetes as an inflammatory disease. Nat Rev Immunol 11: 98–107, 2011 [DOI] [PubMed] [Google Scholar]
- 6. Ellingsgaard H, Hauselmann I, Schuler B, Habib AM, Baggio LL, Meier DT, Eppler E, Bouzakri K, Wueest S, Muller YD, Hansen AM, Reinecke M, Konrad D, Gassmann M, Reimann F, Halban PA, Gromada J, Drucker DJ, Gribble FM, Ehses JA, Donath MY. Interleukin-6 enhances insulin secretion by increasing glucagon-like peptide-1 secretion from L cells and alpha cells. Nat Med 17: 1481–1489, 2011 [DOI] [PMC free article] [PubMed] [Google Scholar]
- 7. Fain JN. Release of inflammatory mediators by human adipose tissue is enhanced in obesity and primarily by the nonfat cells: a review. Mediators Inflamm 2010: 513948, 2010 [DOI] [PMC free article] [PubMed] [Google Scholar]
- 8. Gomez-Diaz RA, Talavera JO, Pool EC, Ortiz-Navarrete FV, Solorzano-Santos F, Mondragon-Gonzalez R, Valladares-Salgado A, Cruz M, Aguilar-Salinas CA, Wacher NH. Metformin decreases plasma resistin concentrations in pediatric patients with impaired glucose tolerance: a placebo-controlled randomized clinical trial. Metabolism 61: 1247–1255, 2012 [DOI] [PubMed] [Google Scholar]
- 9. Hajer GR, van Haeften TW, Visseren FL. Adipose tissue dysfunction in obesity, diabetes, and vascular diseases. Eur Heart J 29: 2959–2971, 2008 [DOI] [PubMed] [Google Scholar]
- 10. Hall JE, da Silva AA, do Carmo JM, Dubinion J, Hamza S, Munusamy S, Smith G, Stec DE. Obesity-induced hypertension: role of sympathetic nervous system, leptin, and melanocortins. J Biol Chem 285: 17271–17276, 2010 [DOI] [PMC free article] [PubMed] [Google Scholar]
- 11. Ishizuka T, Ernsberger P, Liu S, Bedol D, Lehman TM, Koletsky RJ, Friedman JE. Phenotypic consequences of a nonsense mutation in the leptin receptor gene (fak) in obese spontaneously hypertensive Koletsky rats (SHROB). J Nutr 128: 2299–2306, 1998 [DOI] [PubMed] [Google Scholar]
- 12. Kawano K, Hirashima T, Mori S, Saitoh Y, Kurosumi M, Natori T. Spontaneous long-term hyperglycemic rat with diabetic complications. Otsuka Long-Evans Tokushima Fatty (OLETF) strain. Diabetes 41: 1422–1428, 1992 [DOI] [PubMed] [Google Scholar]
- 13. Klimcakova E, Kovacikova M, Stich V, Langin D. Adipokines and dietary interventions in human obesity. Obes Rev 11: 446–456, 2010 [DOI] [PubMed] [Google Scholar]
- 14. Knudson JD, Payne GA, Borbouse L, Tune JD. Leptin and mechanisms of endothelial dysfunction and cardiovascular disease. Curr Hypertens Rep 10: 434–439, 2008 [DOI] [PubMed] [Google Scholar]
- 15. Kohrt WM, Landt M, Birge SJ., Jr Serum leptin levels are reduced in response to exercise training, but not hormone replacement therapy, in older women. J Clin Endocrinol Metab 81: 3980–3985, 1996 [DOI] [PubMed] [Google Scholar]
- 16. Kraemer RR, Kraemer GR, Acevedo EO, Hebert EP, Temple E, Bates M, Etie A, Haltom R, Quinn S, Castracane VD. Effects of aerobic exercise on serum leptin levels in obese women. Eur J Appl Physiol Occup Physiol 80: 154–158, 1999 [DOI] [PubMed] [Google Scholar]
- 17. Laye MJ, Rector RS, Warner SO, Naples SP, Perretta AL, Uptergrove GM, Laughlin MH, Thyfault JP, Booth FW, Ibdah JA. Changes in visceral adipose tissue mitochondrial content with type 2 diabetes and daily voluntary wheel running in OLETF rats. J Physiol 587: 3729–3739, 2009 [DOI] [PMC free article] [PubMed] [Google Scholar]
- 18. Laye MJ, Thyfault JP, Stump CS, Booth FW. Inactivity induces increases in abdominal fat. J Appl Physiol 102: 1341–1347, 2007 [DOI] [PubMed] [Google Scholar]
- 19. Lira FS, Rosa JC, Yamashita AS, Koyama CH, Batista ML, Jr, Seelaender M. Endurance training induces depot-specific changes in IL-10/TNF-alpha ratio in rat adipose tissue. Cytokine 45: 80–85, 2009 [DOI] [PubMed] [Google Scholar]
- 20. Lira FS, Yamashita AS, Rosa JC, Koyama CH, Caperuto EC, Batista ML, Jr, Seelaender MC. Exercise training decreases adipose tissue inflammation in cachectic rats. Horm Metab Res 44: 91–98, 2012 [DOI] [PubMed] [Google Scholar]
- 21. Lowndes J, Zoeller RF, Caplan JD, Kyriazis GA, Moyna NM, Seip RL, Thompson PD, Angelopoulos TJ. Leptin responses to long-term cardiorespiratory exercise training without concomitant weight loss: a prospective study. J Sports Med Phys Fitness 48: 391–397, 2008 [PubMed] [Google Scholar]
- 22. Malin SK, Gerber R, Chipkin SR, Braun B. Independent and combined effects of exercise training and metformin on insulin sensitivity in individuals with prediabetes. Diabetes Care 35: 131–136, 2012 [DOI] [PMC free article] [PubMed] [Google Scholar]
- 23. Malin SK, Nightingale J, Choi SE, Chipkin SR, Braun B. Metformin modifies the exercise training effects on risk factors for cardiovascular disease in impaired glucose tolerant adults. Obesity (Silver Spring). First published May 25, 2012; doi:10.1038/oby.2012.133 [DOI] [PMC free article] [PubMed] [Google Scholar]
- 24. Malin SK, Stephens BR, Sharoff CG, Hagobian TA, Chipkin SR, Braun B. Metformin's effect on exercise and postexercise substrate oxidation. Int J Sport Nutr Exerc Metab 20: 63–71, 2010 [DOI] [PubMed] [Google Scholar]
- 25. Matsumoto T, Noguchi E, Ishida K, Kobayashi T, Yamada N, Kamata K. Metformin normalizes endothelial function by suppressing vasoconstrictor prostanoids in mesenteric arteries from OLETF rats, a model of type 2 diabetes. Am J Physiol Heart Circ Physiol 295: H1165–H1176, 2008 [DOI] [PubMed] [Google Scholar]
- 26. Mick GJ, Wang X, Ling Fu C, McCormick KL. Inhibition of leptin secretion by insulin and metformin in cultured rat adipose tissue. Biochim Biophys Acta 1502: 426–432, 2000 [DOI] [PubMed] [Google Scholar]
- 27. Miyazaki S, Izawa T, Ogasawara JE, Sakurai T, Nomura S, Kizaki T, Ohno H, Komabayashi T. Effect of exercise training on adipocyte-size-dependent expression of leptin and adiponectin. Life Sci 86: 691–698, 2010 [DOI] [PubMed] [Google Scholar]
- 28. Parola M, Marra F. Adipokines and redox signaling: impact on fatty liver disease. Antioxid Redox Signal 15: 461–483, 2011 [DOI] [PubMed] [Google Scholar]
- 29. Payne GA, Borbouse L, Bratz IN, Roell WC, Bohlen HG, Dick GM, Tune JD. Endogenous adipose-derived factors diminish coronary endothelial function via inhibition of nitric oxide synthase. Microcirculation 15: 417–426, 2008 [DOI] [PMC free article] [PubMed] [Google Scholar]
- 30. Pedersen BK. The diseasome of physical inactivity—and the role of myokines in muscle-fat cross talk. J Physiol 587: 5559–5568, 2009 [DOI] [PMC free article] [PubMed] [Google Scholar]
- 31. Pedersen BK, Febbraio MA. Muscles, exercise and obesity: skeletal muscle as a secretory organ. Nat Rev Endocrinol 8: 457–465, 2012 [DOI] [PubMed] [Google Scholar]
- 32. Perusse L, Collier G, Gagnon J, Leon AS, Rao DC, Skinner JS, Wilmore JH, Nadeau A, Zimmet PZ, Bouchard C. Acute and chronic effects of exercise on leptin levels in humans. J Appl Physiol 83: 5–10, 1997 [DOI] [PubMed] [Google Scholar]
- 33. Petersen AM, Pedersen BK. The anti-inflammatory effect of exercise. J Appl Physiol 98: 1154–1162, 2005 [DOI] [PubMed] [Google Scholar]
- 34. Polak J, Klimcakova E, Moro C, Viguerie N, Berlan M, Hejnova J, Richterova B, Kraus I, Langin D, Stich V. Effect of aerobic training on plasma levels and subcutaneous abdominal adipose tissue gene expression of adiponectin, leptin, interleukin 6, and tumor necrosis factor alpha in obese women. Metabolism 55: 1375–1381, 2006 [DOI] [PubMed] [Google Scholar]
- 35. Rector RS, Thyfault JP, Uptergrove GM, Morris EM, Naples SP, Borengasser SJ, Mikus CR, Laye MJ, Laughlin MH, Booth FW, Ibdah JA. Mitochondrial dysfunction precedes insulin resistance and hepatic steatosis and contributes to the natural history of nonalcoholic fatty liver disease in an obese rodent model. J Hepatol 52: 727–736, 2010 [DOI] [PMC free article] [PubMed] [Google Scholar]
- 36. Rector RS, Uptergrove GM, Borengasser SJ, Mikus CR, Morris EM, Naples SP, Laye MJ, Laughlin MH, Booth FW, Ibdah JA, Thyfault JP. Changes in skeletal muscle mitochondria in response to the development of type 2 diabetes or prevention by daily wheel running in hyperphagic OLETF rats. Am J Physiol Endocrinol Metab 298: E1179–E1187, 2010 [DOI] [PMC free article] [PubMed] [Google Scholar]
- 37. Shoelson SE, Lee J, Goldfine AB. Inflammation and insulin resistance. J Clin Invest 116: 1793–1801, 2006 [DOI] [PMC free article] [PubMed] [Google Scholar]
- 38. Smith AC, Mullen KL, Junkin KA, Nickerson J, Chabowski A, Bonen A, Dyck DJ. Metformin and exercise reduce muscle FAT/CD36 and lipid accumulation and blunt the progression of high-fat diet-induced hyperglycemia. Am J Physiol Endocrinol Metab 293: E172–E181, 2007 [DOI] [PubMed] [Google Scholar]
- 39. Smith JK, Dykes R, Douglas JE, Krishnaswamy G, Berk S. Long-term exercise and atherogenic activity of blood mononuclear cells in persons at risk of developing ischemic heart disease. JAMA 281: 1722–1727, 1999 [DOI] [PubMed] [Google Scholar]
- 40. Sweeney G, Keen J, Somwar R, Konrad D, Garg R, Klip A. High leptin levels acutely inhibit insulin-stimulated glucose uptake without affecting glucose transporter 4 translocation in l6 rat skeletal muscle cells. Endocrinology 142: 4806–4812, 2001 [DOI] [PubMed] [Google Scholar]
- 41. Tan BK, Heutling D, Chen J, Farhatullah S, Adya R, Keay SD, Kennedy CR, Lehnert H, Randeva HS. Metformin decreases the adipokine vaspin in overweight women with polycystic ovary syndrome concomitant with improvement in insulin sensitivity and a decrease in insulin resistance. Diabetes 57: 1501–1507, 2008 [DOI] [PubMed] [Google Scholar]
- 42. Tedgui A, Mallat Z. Cytokines in atherosclerosis: pathogenic and regulatory pathways. Physiol Rev 86: 515–581, 2006 [DOI] [PubMed] [Google Scholar]
- 43. Thong FS, Hudson R, Ross R, Janssen I, Graham TE. Plasma leptin in moderately obese men: independent effects of weight loss and aerobic exercise. Am J Physiol Endocrinol Metab 279: E307–E313, 2000 [DOI] [PubMed] [Google Scholar]
- 44. Thyfault JP, Rector RS. Exercise: not just a medicine for muscle? J Physiol 588: 2687–2688, 2010 [DOI] [PMC free article] [PubMed] [Google Scholar]
- 45. van Hall G, Steensberg A, Sacchetti M, Fischer C, Keller C, Schjerling P, Hiscock N, Moller K, Saltin B, Febbraio MA, Pedersen BK. Interleukin-6 stimulates lipolysis and fat oxidation in humans. J Clin Endocrinol Metab 88: 3005–3010, 2003 [DOI] [PubMed] [Google Scholar]
- 46. Vieira VJ, Valentine RJ, Wilund KR, Antao N, Baynard T, Woods JA. Effects of exercise and low-fat diet on adipose tissue inflammation and metabolic complications in obese mice. Am J Physiol Endocrinol Metab 296: E1164–E1171, 2009 [DOI] [PMC free article] [PubMed] [Google Scholar]
- 47. Vieira VJ, Valentine RJ, Wilund KR, Woods JA. Effects of diet and exercise on metabolic disturbances in high-fat diet-fed mice. Cytokine 46: 339–345, 2009 [DOI] [PMC free article] [PubMed] [Google Scholar]
- 48. Wang JL, Chinookoswong N, Scully S, Qi M, Shi ZQ. Differential effects of leptin in regulation of tissue glucose utilization in vivo. Endocrinology 140: 2117–2124, 1999 [DOI] [PubMed] [Google Scholar]
- 49. Zachwieja JJ, Hendry SL, Smith SR, Harris RB. Voluntary wheel running decreases adipose tissue mass and expression of leptin mRNA in Osborne-Mendel rats. Diabetes 46: 1159–1166, 1997 [DOI] [PubMed] [Google Scholar]