Abstract
In this study, we assessed kinematics and viscoelastic features of knee joint in adults with Down syndrome (DS) by means of the Wartenberg pendulum test. This test allows the measuring of the kinematics of the knee joint during passive pendular motion of leg under the influence of gravity. In addition, by a combination of kinematic and anthropometric data, pendulum test provides estimates of joint viscoelastic properties by computing damping and stiffness coefficients. To monitor the occurrences of muscle activation, the surface electromyogram (EMG) of muscle rectus femoris was recorded. The experimental protocol was performed in a group of 10 adults with DS compared with 10 control adults without DS. Joint motion amplitude, velocity, and acceleration of the leg during the first knee flexion significantly decreased in persons with DS with respect to those without DS. This behavior was associated with the activation of rectus femoris in subjects with DS that resulted in increasing of joint resistance shortly after the onset of the first leg flexion. The EMG bursts mostly occurred between 50 and 150 ms from the leg flexion onset. During the remaining cycles of pendular motion, persons with DS exhibited passive leg oscillations with low tonic EMG activity and reduced damping coefficient compared with control subjects. These results suggest that adults with DS might perform preprogrammed contractions to increase joint resistance and compensate for inherent joint instability occurring for quick and unpredictable perturbations. The reduction of damping coefficients observed during passive oscillations could be a predictor of muscle hypotonia.
Keywords: hypotonia, Wartenberg test, rectus femoris, viscosity
down syndrome (ds) is characterized by chromosomal abnormalities associated with cognitive and motor disturbances. Most of motor impairments exhibited by persons with DS depend on ligament laxity (27) and hypotonia (28, 31) that appear early during development (17, 18). As a consequence, they show joint hyperflexibility (3, 33), increasing of variability during motor performance, and difficulty in maintaining upright standing and locomotion stability (1, 9, 38). Several authors reported that persons with DS may compensate for their congenital mechanical instability, accomplishing specific motor responses, such as increasing muscle activation or performing patterns of co-contraction (5, 8, 14, 16).
Although these studies dealt with important factors affecting the motor behavior in DS, the complexity of the active voluntary actions chosen in the experimental procedures greatly reduced the possibility to provide basic and objective quantification of the mechanical status of joint motion in persons with DS. To find out a few representative parameters and to identify the basic process for a functional evaluation of DS motor disability, we used the Wartenberg pendulum test (41). This test allows the performance of a quantitative analysis of the kinematics of knee joint during passive swings of leg about the gravitational resting position. In addition, by a combination of kinematic and anthropometric data, the pendulum test provides estimates of joint viscoelastic properties.
Two possible outcomes can be envisioned, depending on the ability of persons with DS to allow a passive leg motion. Given ligament laxity and hypotonia, we hypothesized that persons with DS should show large knee joint excursion and reduced damping of leg oscillations. An alternative outcome could be exhibited if the individuals with DS would respond to leg dropping by automatic muscular activations: in this case, the range of leg motion and the associated kinematics should be reduced.
METHODS
Subjects.
Twenty-five persons with DS from the Italian Association of Down People were enrolled in this study according to the following criteria of inclusion: good general health, understanding of simple verbal instructions, no history of seizures, absence of current medications, and no previous surgical procedures on the lower extremities. The exclusion criteria were as follows: inability to relax or low compliance/participation to the execution of the test, and arbitrary and erratic leg oscillations during the test. According to these exclusion criteria, 15 persons with DS were excluded from the experimental testing. Therefore, 10 subjects with DS (6 men and 4 women; age: 26 ± 5 yr) were selected, and 10 subjects without DS (5 men and 5 women; age: 24 ± 5 yr) served as controls.
The research project was approved by the local ethics committee of University of Catania. Before inclusion in the study, a written and informed consent was obtained by parents or guardians of persons with DS, as well as by control subjects.
Procedures.
For each participant, we took a series of anthropometric data: lower limb dominance, total body weight and height, and leg-foot length. The leg-foot length was measured from lateral femoral condyle to the ground, with the subjects in the standing position.
Each subject was investigated in the sitting-up position with the trunk inclined approximated 40° from the horizontal to provide a comfortable starting position (Fig. 1A). The participants received extensive explanation and demonstration of the procedure, and, in particular, we verified that persons with DS had a full comprehension of the test. For each trial, the examiner lifted the relaxed lower limb to the horizontal position, and, after few seconds, she left the leg to swing passively between flexions and extensions until it stopped at resting position. The pendulum test was performed on the dominant limb and repeated at least 10 times for each subject, with a minimum pause of 1 min between the trials. The same examiner carried out the test across all of the sessions.
Fig. 1.
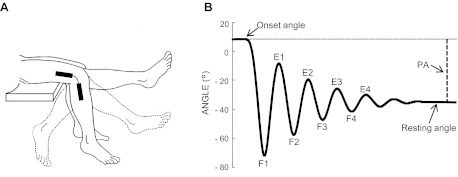
Experimental arrangement to perform pendulum test. A: the leg passively swung from an extended position to rest. An electrogoniometer recorded the angular displacements of knee joint, and a couple of surface electrodes recorded the electromyogram (EMG) activity at the rectus femoris. B: typical kinematic trajectory reporting the knee angle variations and the main landmarks for further kinematic and dynamic computations. F1–F4, angles of reversal at the end of each swing flexion; E1–E4, angles of reversal at the end of each swing extension; PA, plateau amplitude.
Recording systems.
Angular displacements of the leg oscillatory movements were recorded by an electrogoniometer placed on the lateral side of the tested limb (Fig. 1A). We used adhesive strips to attach one arm of the electrogoniometer to the thigh and the other arm to the lower leg. After aligning the axis of the electrogoniometer arms with the knee flexion/extension axis, a voltage signal proportional to knee angle was recorded.
Kinematic data were low-pass filtered with a zero-lag second-order Butterworth filter with 5-Hz cutoff frequency. The kinematic traces were monitored online, and trials showing abnormal or erratic oscillations were rejected.
Electromyographic (EMG) data were collected using surface electrodes placed over the rectus femoris: the EMG signal was amplified and sampled at 1 kHz, then, offline, it was full-wave rectified and high-pass filtered (20 Hz).
All of the measurements were sampled at 1 kHz and recorded with a portable device (POCKETEMG by Bioengineering Technology and System, BTS, Milan, Italy). Kinematic data were resampled at 200 Hz for further processing.
Measurements and estimations.
Kinematic and EMG measurements were elaborated to obtain the following parameters (Fig. 1B): onset angle corresponding to the angle at rest before the onset of the first flexion; resting angle corresponding to the angle at rest position; plateau amplitude (PA) measured between onset angle and resting angle; angles of reversal at the end of each swing flexion (F1–F4) and extension (E1–E4); relaxation index: RI = F1/PA, that is the normalized first peak flexion angle; mean value and peak angular velocity of knee movements during the first flexion; mean value and first and second peak angular acceleration during the first flexion; EMG area during the first flexion and over the three successive oscillations obtained by computing the integral of the filtered EMG signals (low-pass filter: second-order Butterworth filter with a cutoff of 10 Hz); and latencies of EMG responses measured with respect to the onset of the first flexion.
In addition, to describe the patterns of muscle activations, the entire data set of EMG activities, recorded in all trials and in all subjects with DS, was reduced to a few representative waveforms by using the principal component analysis (PCA).
By means of this analysis, we extracted from the data set of EMG traces (n = 100) a smaller number of uncorrelated waveforms, the principal components (PCs), accounting for most of the data set variance and representing the most common waveform patterns across the population. The original elements of the data set can then be reconstructed from the linear sum of all of the PCs weighted by coefficients that describe their relationships with the original EMG traces (weighting coefficients). These weighting coefficients represent the Pearson product-moment correlation between the elements of the original data set (EMG waveforms) and each PC computed.
To simplify the interpretation of the PC waveforms and their relationship with the EMG responses regarding each subject, we applied varimax rotation, that is, an orthogonal rotation that changes iteratively the basis factors (i.e., the PCs) to achieve maximal separation in the distribution of the response vectors in PC space. (For extensive reviews on the PCA methodology, see Refs. 15 and 20.)
Finally, we used kinematic and anthropometric data to estimate the damping coefficient (B) and stiffness coefficient (K) for the first three flexions (F1, F2, F3) and extensions (E1, E2, E3) of knee joint. We restricted the measure of damping and stiffness coefficients to passive motion assuming a linear viscoelasticity (i.e., a second-order system; 26).
Damping coefficient (B) was estimated by computing the damping ratio (ζ) and the natural frequency (ω) obtained from the data of each trial. We used the following equations:
| (1) |
where D = θ1/θ2, that is, the ratio of the peak angle of one cycle (θ1) to the peak angle of the following cycle (θ2).
| (2) |
where T is the period of one cycle.
Using Eqs. 1 and 2, the value of damping coefficient (B) was obtained as follows:
| (3) |
where J is the sagittal moment of inertia applying to the leg-foot complex rotation around the knee axis.
The K was calculated from the following:
| (4) |
The estimation for J and mass characteristics (i.e., mass and length of the leg-foot complex) were obtained for each subject according to anthropometric data reported by Winter (43).
Statistical analysis.
For all subjects, means and standard deviations of each parameter were calculated, pooling together all trials performed on each session. The comparison between groups of each parameter was performed by using Student's t-test.
Damping and stiffness coefficients across the cycles were modeled by a general linear model with repeated measures, using the repetition of consecutive cycles as within-subjects factor and the groups (control subjects vs. subjects with DS) as between-subjects factor. Post hoc t-tests were computed for differences between the groups for each cycle interval. The critical value of F was adjusted by Greenhouse-Geisser procedure after checking the data for sphericity, that is, the correlations among all combinations of trials were equal. This extra test addresses a specific assumption for validating the repeated-measures ANOVA (44).
A linear regression model was performed to correlate EMG activity to mechanical parameters.
The level of significance for all tests was set to P < 0.05.
All data analysis was performed using Matlab version R2011b (Mathworks, Natick, MA) and SYSTAT, version 11 (Systat, Evanston, IL).
RESULTS
Kinematic and EMG traces recorded during single trials in one control subject and in two persons with DS are illustrated in Fig. 2. Some important differences between control (Fig. 2A) and persons with DS (Fig. 2, B and C) regarded the first swing (shaded regions in the plots). The example reported in Fig. 2B shows that knee maximum excursion, RI, peaks, and mean values for velocity (MV) and acceleration (MA) during the first swing were smaller in this person with DS than in the control subject. The kinematics of the subject with DS was associated with a large EMG phasic activity, which occurred at the onset of the first oscillation and during the leg dropping, whereas the EMG trace of control subject was characterized by constant low tonic activity.
Fig. 2.
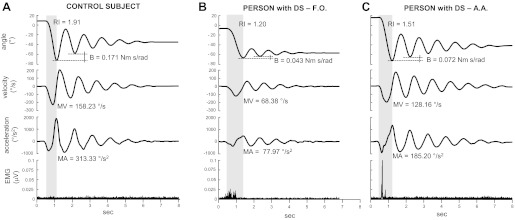
Examples of kinematic and EMG traces recorded in one subject without Down syndrome (DS; A) and in two subjects with DS (subjects F.O. and A.A.; B and C). Shadow areas highlight the first flexion. RI, relaxation index; B, damping coefficient; MV, mean velocity during the first flexion; MA, mean acceleration during the first flexion.
In comparing the other person with DS (subject AA; Fig. 2C) with the control subject, small differences emerged for knee maximum excursion, peak velocity, and the first peak acceleration during the first flexion. On the other hand, RI, MV, MA, and the second peak acceleration were reduced in the person with DS. This person also showed evident EMG activation, but the bursts were more peaked compared with the other person with DS. Overall, these differences lead to a slowing of the leg-down movement in persons with DS compared with the control person.
During the cycles following the first swing, the EMG traces showed a tonic activity for all three subjects, with the lowest level recorded in the person with DS represented in Fig. 2B. The oscillations were slightly damped in the two persons with DS: the damping coefficients (B) between the first and the second peak of flexion (F1 and F2) were much larger in control subject than in persons with DS.
For each subject the kinematic and EMG traces were consistent across the 10 trials.
Comparing the two samples of subjects, we found that persons with DS and the control group showed significant statistical differences for all kinematic parameters measured during the first swing, except for the first peak acceleration (Fig. 3, A–E): RI was 1.45 ± 0.23 for DS and 1.91 ± 0.16 for controls, P < 0.01; MV was 119.8 ± 32.6°/s for DS and 157.6 ± 11.4°/s for controls, P < 0.01; peak velocity was −197.1 ± 55.9°/s for DS and −241.7 ± 17.7°/s for controls, P < 0.05; MA was 173.9 ± 65.7°/s2 for DS and 283.2 ± 25.5°/s2 for controls, P < 0.01; PA1 was −756.6 ± 205.7°/s2 for DS and −782.2 ± 98.5°/s2 for controls, P = not significant; PA2 was 941.5 ± 377.9°/s2 for DS and 1,817.1 ± 222.3°/s2 for controls, P < 0.01. The value of EMG area corresponding to the interval between onset and F1 was greater in the group of persons with DS than in the control group (Fig. 3F; 3.17 ± 0.23 μv·sampling unit for DS and 1.32 ± 0.32 μv·sampling unit for controls; P < 0.01), whereas the EMG area between the first and the fourth peak of flexion was smaller in subjects with DS than in the control group (Fig. 3F; 0.59 ± 0.14 μv·sampling unit for DS and 0.94 ± 0.29 μv·sampling unit for controls; P < 0.05).
Fig. 3.
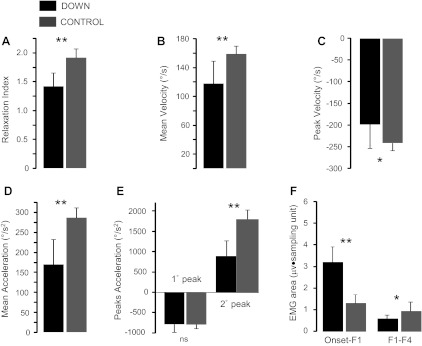
Summary of statistic comparisons between subjects with and without DS concerning kinematic [RI (A), MV (B), peak velocity (C), MA (D), peak acceleration (E)] and EMG (F) parameters. Data are expressed as means and SDs. *P < 0.05. **P < 0.01. ns, Not significant.
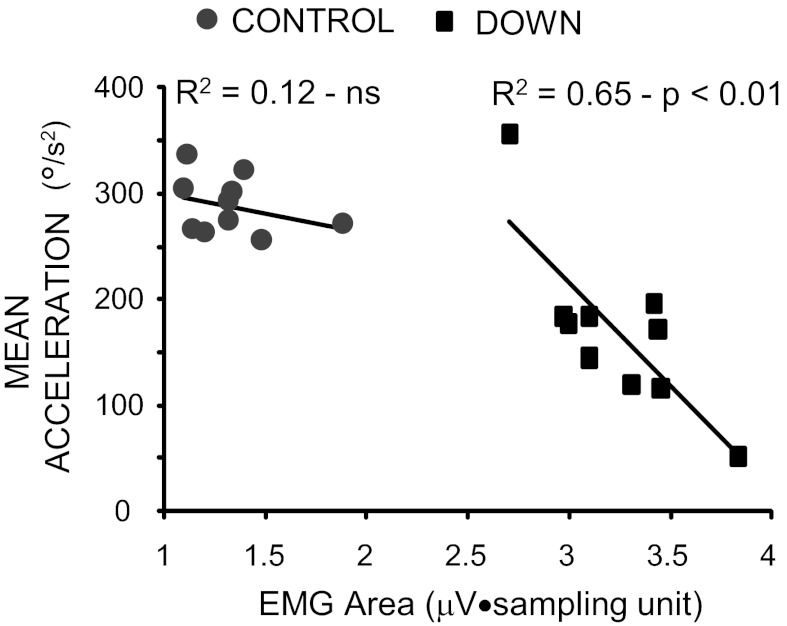
The influence of EMG activity on the kinematics of the first swing in the two groups was evaluated by using a univariate linear regression analysis, where the EMG area was compared with the MA (Fig. 4). The plot shows that, in people with DS, 65% of the variance of MA was explained by EMG activity (square symbols; R2 = 0.65; P < 0.01), whereas, in the control subjects, the association between MA and EMG activity was weak with no statistical significance (circle symbols; R2 = 0.12; P = not significant). Thus most of the slowing in leg kinematics observed in persons with DS depended on muscle activation.
Fig. 4.
Relationship between changes of MA and EMG area during the first flexion. The linear regression analysis was performed separately for each group. Each data point represents the average value obtained over the 10 trials for each subject.
To provide more quantitative insight on the different patterns of EMG activity in the first swing across trials performed by persons with DS, we summarized the entire data set (100 trials) into few waveforms by using the technique of PCA (see methods). Figure 5A represents the first six PCs extracted from the original database, which accounted for the 87% of total variance. Higher order PCs each explained a very small fraction of the variance (<3.2%) and described high-frequency oscillations of the EMG activity, hardly distinguishable from noise.
Fig. 5.
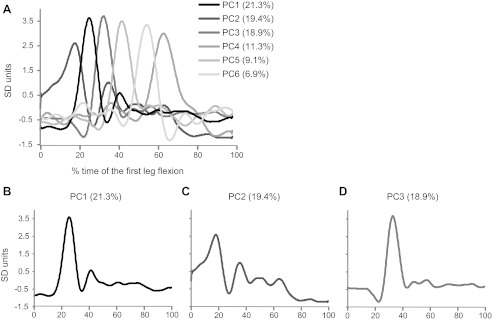
Principal component (PC) analysis performed on the data set of EMG responses recorded in the persons with DS during the first flexion. A: the first six components, accounting for the 86.9% of the total variance, are distributed on the basis of their occurrences over the time interval of the first swing. For each component are reported the fraction of variance accounted. The three most important components have been extracted for a better clearness and are illustrated, respectively, in B, C, and D. The axes of time are divided in percentage of the interval time between movement onset and the first flexion peak.
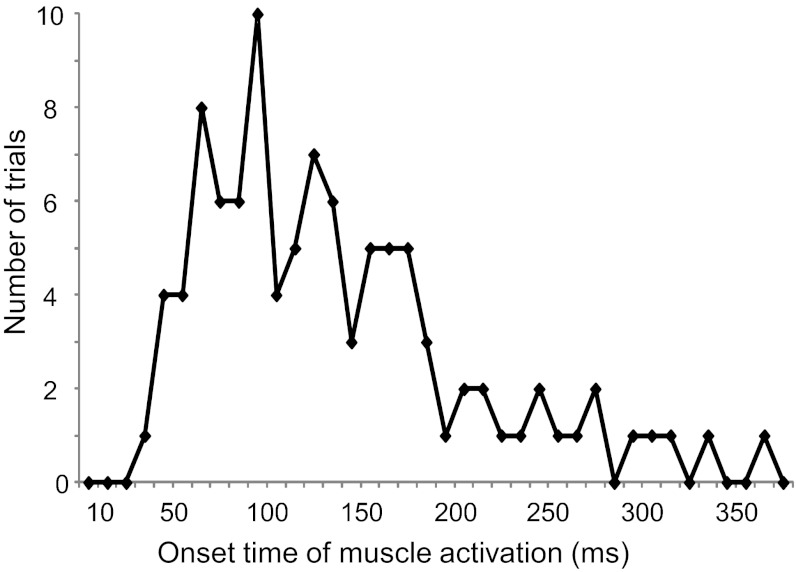
By examining the temporal distribution of the first six PCs, the EMG waveforms were widespread along almost all of the duration of the first leg flexion. The onset of the first three PCs (Fig. 5, B–D), which explained the largest fraction of the data set variance (59.7%), occurred during the first 20% of the entire time of the first swing, whereas the remaining PCs, which explained a smaller fraction of the variance (27.3%), occurred during the remaining time of the first leg flexion. The first three PCs represented in Fig. 5, B–D, showed two major patterns of EMG response: PC1 (Fig. 5B) and PC2 (Fig. 5C) exhibited a biphasic profile more evident in the PC2 than on the PC1; the PC3 (Fig. 5D) and the other significant components showed unimodal response pattern. Noteworthy, the not normalized average time corresponding to the 100% of first oscillation in the Fig. 5 was 735 ± 87 ms. Thus almost all of the EMG activity represented in the first three PC waveforms occurred during the first 150 ms from the movement onset. A more accurate distribution of the time initiation of the muscle activation measured for each trial is illustrated in Fig. 6. Only 5% of the responses occurred at very short latency (<50 ms), while most of the latencies (∼60%) were between 50 and 150 ms.
Fig. 6.
Distribution of the latencies of EMG bursts with respect to the onset of leg movement. In the plot are represented latencies measured in all of the data set of EMG traces recorded in persons with DS.
To verify if some PCs represent univocally a single subject, we examined the distributions of the weighting coefficients of the first six PCs for each trial of the data set. We set at 0.4 an arbitrary threshold value of weighting coefficients to highlight which subjects predominantly contributed to each PC waveform. As reported in Table 1, only the sixth PC exhibited a weighting coefficient >0.4, corresponding to a single subject (S.A.), whereas the contribution to the lower order PCs derived from the combination of two to five subjects. Noteworthy, the number of subjects who contributed to each PC increased with the variance explained. Thus, although the EMG traces were consistent within a single subject, the six PC waveforms represent a common modality of EMG response to leg dropping distributed across the subjects with DS.
Table 1.
Weight coefficients computed for the first six principal components with respect to the original traces recorded in each person with Down syndrome
| A.A. | B.E. | C.G. | D.L. | D.E. | E.D. | F.O. | G.M. | S.A. | T.D. | |
|---|---|---|---|---|---|---|---|---|---|---|
| PC1 (21.3%) | 0.24 | 0.51 | 0.08 | 0.55 | 0.48 | 0.03 | 0.60 | 0.45 | 0.01 | 0.33 |
| PC2 (19.4%) | 0.05 | 0.05 | 0.78 | 0.56 | 0.42 | 0.07 | 0.24 | 0.36 | 0.07 | 0.66 |
| PC3 (18.9%) | 0.48 | 0.07 | 0.52 | 0.23 | 0.22 | 0.19 | 0.61 | 0.33 | 0.33 | 0.10 |
| PC4 (11.3%) | 0.10 | 0.02 | 0.21 | 0.03 | 0.06 | 0.59 | 0.07 | 0.09 | 0.41 | 0.03 |
| PC5 (9.1%) | 0.41 | 0.10 | 0.34 | 0.05 | 0.19 | 0.09 | 0.04 | 0.08 | 0.41 | 0.04 |
| PC6 (6.9%) | 0.28 | 0.09 | 0.18 | 0.15 | 0.12 | 0.13 | 0.02 | 0.01 | 0.47 | 0.03 |
PC, principal component. Initials are of the 10 subjects. The absolute values of r > 0.4 are in bold.
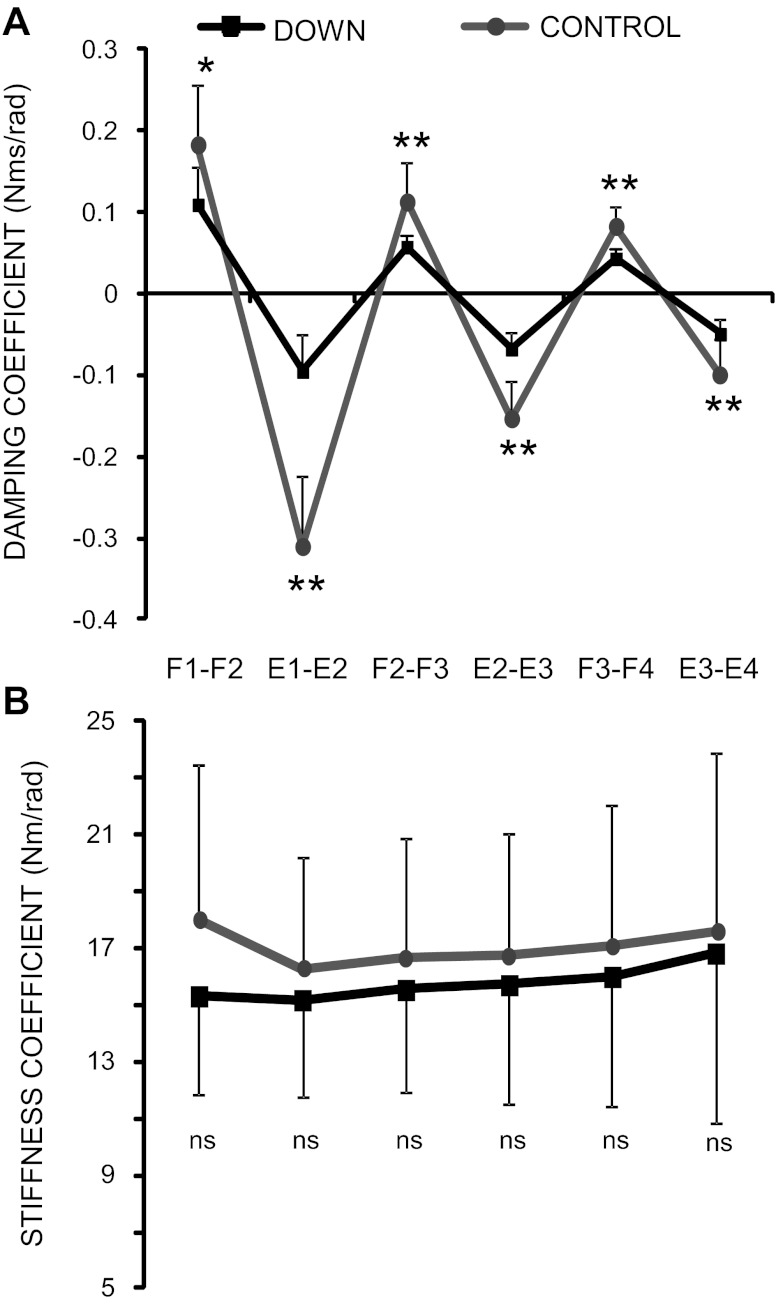
To estimate the viscoelastic properties of the knee joint during the first three cycles, we calculated the damping and stiffness coefficients (Fig. 7). The damping coefficient (Fig. 7A) changed between the two groups [F(1,5) = 9.57, P < 0.01] and across the cycles [F(1,5) = 159.72, P < 0.0001] with a significant interaction between groups and cycles [F(1,5) = 26.59, P < 0.0001]. Persons with DS show an important reduction of the damping coefficient in relation to control subjects for each cycle: the less significant difference was exhibited between F1 and F2 [0.11 ± 0.05 Nm·s/rad for DS and 0.18 ± 0.08 Nm·s/rad for controls, F(1,5) = 60.31, P < 0.05], while the most significant difference occurred between E1 and E2 [−0.09 ± 0.04 Nm·s/rad for DS and −0.31 ± 0.09 Nm·s/rad for controls, F(1,5) = 421.53, P < 0.0001]. When the damped behavior was estimated using damping ratio (see methods), the changes across the cycles and the differences between the groups were statistically comparable to those obtained using the damping coefficient.
Fig. 7.
Damping (A) and stiffness (B) coefficients estimated for the subjects with and without DS over the three cycles following the first flexion. F1–F4, peak angles of flexions; E1–E4, peak angles of extensions. Data are expressed as means and SDs. *P < 0.05. **P < 0.01.
The values of the stiffness coefficient (Fig. 7B) were less variable over the cycles compared with the damping coefficient. Although the data indicate a reduction of stiffness coefficient in persons with DS, the interindividual variability restricted the possibility to find statistically significant differences between the two groups for all of the cycles.
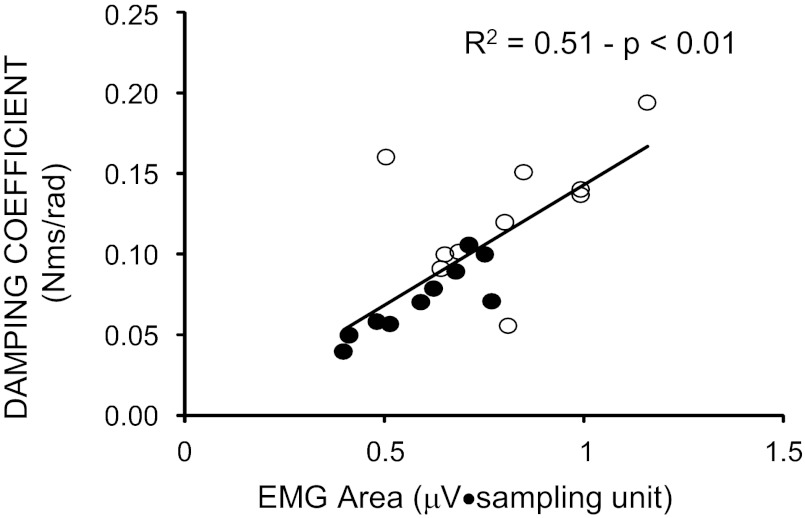
A linear regression was performed to quantify the association between changes of damping coefficient and EMG activation occurred during the oscillations following the first flexion. Figure 8 demonstrates a direct relationship between the two parameters, with 51% of the variation of damping coefficient explained by the variation of tonic EMG changes (R2 = 0.51, P < 0.01). The damping coefficient and the level of tonic EMG activity decreased, passing from subjects without DS (open circles) to those with DS (solid circles).
Fig. 8.
Relationship between the changes of mean values of damping coefficient and EMG area during the three cycles following the first flexion. The linear regression analysis was performed, collecting the data from both groups. Each data point represents the average value obtained over the 10 trials for each subject.
DISCUSSION
The Wartenberg test was used in this study to investigate the mechanical behavior of passive knee joint movements in individuals with DS. This is the first time that this technique is used in persons with DS, and the results have provided novel insights on the functional characterization of the joint tissues laxity and muscle hypotonia typical of this syndrome.
Bursts of EMG, recorded at rectus femoris, occurred during the first flexion in subjects with DS, producing an overall reduction of the knee kinematics, whereas control subjects showed a tonic activity. The EMG activity was tonically maintained throughout the following oscillations of the leg in both groups, but persons with DS exhibited a reduced muscular tone and less damping behavior with respect to control subjects.
These responses clearly demonstrated that persons with DS are able to adaptively modulate muscle activity, producing rapid bursts to contrast sudden joint variations or restoring the basic muscle hypotonia during the relaxed limb oscillations. To our knowledge, no research has examined this topic with such a detailed quantification and by means of an objective and easily reproducible protocol.
Muscle activation in persons with DS: simple reflex or preprogrammed strategies?
The Wartenberg test has been extensively used to quantify passive leg motion in healthy persons, as well as in several pathological conditions (6, 12, 25, 40, 41). When a subject is able to relax and not to interfere with the pendulum motion, mechanical data reflected mainly the intrinsic passive characteristics of knee joint and associated tissues. In some cases, such as in patients with spasticity, muscle activation could occur during the first flexion or during the entire period of oscillations, producing a high variability of the leg kinematics (12, 13). In our experiments, the control group showed typical passive responses, but the large EMG bursts exhibited by persons with DS indicated an active neuromuscular involvement once the leg initiated the first flexion.
The latency distribution and the shapes of the EMG bursts during the first swing can be useful data to provide some insights on the origin of the muscular activity observed in subjects with DS (Figs. 5 and 6). Previous studies reported that, when subjects are instructed to actively react to a rapid joint displacement, a sequence of responses occurs in the muscles that are stretched (24, 29, 30, 34). The earliest reaction results from the activation of spinal stretch reflexes, since its latency is compatible with the time course of the group Ia-mediated monosynaptic reflex: 20 ms for biceps brachii (24) and 44 ms for tibialis anterior (34). One or two successive bursts can be observed shortly after the first response: for the leg, there are commonly reported two components that occur at mean latencies of 69 and 95 ms for tibialis anterior (34). The longest delayed component may involve transcortical loop, but it is fast enough to be considered involuntary as the previous bursts (10, 30, 34). The earliest voluntary muscle activation can occur after 100 ms (29, 30).
The variety of EMG responses observed in this work for persons with DS included all of the categories listed above, but the long-loop reflex and/or the earliest voluntary activations were more represented. In fact, only 5% of the responses occurred at very short latency (<50 ms), whereas ∼60% of the activations showed latencies between 50 and 150 ms (Fig. 6). In addition, PCA analysis revealed two modalities of responses (unimodal and bimodal) summarized by few waveforms: the first three PCs explained ∼60% of total variance and showed latencies ranging between 100 and 150 ms (Fig. 5). The first three PCs were common in almost all of the subjects with DS (Table 1), indicating a similarity of responses in reacting to the leg perturbation. Thus the muscle activity observed during the first swing should emerge from a common preprogrammed neural process more complex and flexible than a simple spinal network, such as the stretch reflex.
Several evidences suggest that these reactions contribute to the stiffness of single muscles (32) or joint soft tissues (19, 36, 45). Specifically, the sensitivity of long-loop reflex is not fixed, but it can be modulated to compensate for single-joint perturbations during interactions with compliant or unstable environments (2, 10, 11, 21). The presence of long-loop reflex and/or voluntary EMG activity during the first leg flexion in persons with DS may be associated with the need to increase joint stability and compensate for joint and muscular laxity. This possibility is supported by several studies that demonstrated an active increase of joint stiffness in persons with DS, either during movement execution (4, 7, 8, 14, 16, 35, 39), or in performing postural tasks (5, 42). To maximize stability, persons with DS may employ a strategy of muscle cocontraction (4, 5, 16, 23, 42) or increase the duration of the muscle burst (8). Interestingly, Latash et al. (22) reported that subjects with DS modulated long-loop reflexes, either when they were instructed to actively react to unexpected perturbations, or when the subjects were asked to relax, as in the present experiments.
The possibility that persons with DS can build up these adaptive processes during the development period is indicated by many studies on walking in toddlers or preadolescents with DS (7, 8, 14, 16, 35, 37, 39). These authors revealed specific strategies employed by toddlers or preadolescents with DS to maximized walking, such as increasing stiffness more during swing than stance phase (16), or increasing muscle bursts duration (8). Moreover, preadolescents with DS can adjust the acquired mechanical strategies modulating stiffness and force by appropriate training (37).
In line with these outcomes, the muscle activation observed in persons with DS after the release of the leg may be the consequence of motor adaptations learned to increase joint stability, especially in case of sudden disturbances, even during passive motions.
Two alternative explanations for the occurrences of muscle bursts during the first swing can be envisioned. First, it is possible that persons with DS may be less compliant with the instructions to relax over the examination time. The state of subjects' relaxation and understanding were of primary concern to this study. In fact, we excluded those subjects who showed large erratic changes of movement trajectory during the first swing and over the successive oscillations. In addition, the consistency of EMG timing response across trials for each subject and the low tonic activity after the first flexion make us confident that the subjects were adequately relaxed, and that muscle responses were produced by automatic preprogrammed motor commands.
A second alternative explanation may be that, although persons with DS understood the instructions and tried to relax, they were not able to modulate long-loop reflexes, and they responded to perturbation the same as in active reactions. This possibility is in contrast to the finding reported by Latash et al. (22), who demonstrated that persons with DS changed the level of EMG response in accord with different values of unloading and loading arm when reacting to unexpected perturbation: the modulation occurred either when the subjects were asked to react actively, or when they were instructed to remain relaxed after the perturbation. However, in the latter case, with respect to the active reactions, they modulated the responses differently in accordance with the loading condition. Consistently, we infer that muscle reactions reported in our experiments were neuronal automatisms modulated to adapt the movement to specific experimental conditions.
Overall, our data, combined with the cited studies, strongly suggest that persons with DS might elaborate patterns of muscle activation to increase joint stability. In daily life, this patterns can optimize tasks such as walking, upright standing, reaching, and grasping.
Damping coefficient and muscle hypotonia.
A second significant finding reported in these experiments is the decrease of damping coefficient over the oscillations following the first flexion in persons with DS compared with control subjects. The damping coefficient is a measure associated with how quickly the amplitude of peak oscillations diminishes (see methods): as consecutive flexion or extension peaks became closer, lower values of damping coefficient are detected. This behavior depends on passive viscoelastic resistances that knee joint tissues provide to contrast gravitational torque. The diminution of damping coefficient is consistent with ligamentous laxity and muscle hypotonia characterizing persons with DS. In fact, these features cause a decrease of passive resistances with a consequent decrease of the rate of reduction of peaks amplitudes.
When the leg swings passively back and forth and slowly comes to rest, it behaves according to a “second-order damped system” (see methods). In this condition, damping coefficient reflects the changes of the viscosity component of viscoelastic passive joint resistances: viscosity decreases as damping coefficient decreases (26). The laxity of soft joint tissues or muscle hypotonia may contribute to the reduction of viscosity-dependent resistances. In this work, we can only account for the decrease of the tonic muscle activation in persons with DS, confirming the broadly reported evidences that hypotonia is a typical feature of persons with DS (18, 28, 31). Thus the reduction of damping coefficient may depend, at least in part, on a reduction of viscosity connected to muscle hypotonia.
The idea that damping coefficient can be considered as a predictor of muscle tone variations is supported by several studies on patients with spasticity that demonstrated changes of damping coefficient related to changes of muscle tone (6, 12, 25). For example, Lin et al. (25), by using the Wartenberg test on upper limb and implementing three mathematical models to estimate stiffness and viscosity, found that damping coefficient increases as muscle tone increases, regardless of the model applied. Similarly, applying the pendulum test to the leg, a reduction of damping coefficient was reported once the hypertonia was removed by anesthesia (12) or after botulinum toxin treatment (6); that is, as the muscle relaxed, the leg movement became less damped.
The lack of statistical differences reported for the stiffness coefficient may depend on intersubject variability, but, at least in part, it could be due to a low specificity of this parameter in representing the mechanical state of persons with DS during passive motion. Since stiffness coefficient accounts for the elastic component of joint passive resistance while damping coefficient contributes mainly to the viscosity-depending resistance (6, 26, 40), these results point out the reduction of viscosity rather than elastic resistance as the major source for joint laxity in DS (12).
This set of data and the results of our experiments suggest that damping coefficient, evaluated by means of the Wartenberg test, may be a proposal parameter for a quantitative estimation of muscle tone in persons with DS as an alternative to subjective assessments of the resistance to passive movement.
Conclusion.
The leg of persons with DS behaved differently with respect to that of subjects without DS when the pendulum test is performed. At the starting of the test, the unpredictable onset of the movement leg induced the persons with DS to activate muscle contraction to resist the sudden leg dropping. As the leg oscillated about the gravitational resting position, they became relaxed, since any unexpected interaction with the environment occurred. During the oscillations, muscle tone decreased, and the hypotonia was associated with less damping of the oscillations. We showed that the Wartenberg pendulum test might be a valid tool for the quantification of these adaptations, and it can be considered useful either to further elucidate the physiological origin of these biomechanical patterns or for diagnostic employ.
DISCLOSURES
No conflicts of interest, financial or otherwise, are declared by the author(s).
AUTHOR CONTRIBUTIONS
Author contributions: A.C., M.S.V., and M.C. conception and design of research; A.C. and M.S.V. analyzed data; A.C., M.S.V., and M.C. interpreted results of experiments; A.C. prepared figures; A.C., M.S.V., and M.C. drafted manuscript; A.C., M.S.V., and M.C. edited and revised manuscript; A.C., M.S.V., M.P., M.R.P., and M.C. approved final version of manuscript; M.S.V., M.P., and M.R.P. performed experiments.
REFERENCES
- 1. Agiovlasitis S, Motl RW, Ranadive SM, Fahs CA, Yan H, Echols GH, Rossow L, Fernhall B. Energetic optimization during over-ground walking in people with and without Down syndrome. Gait Posture 33: 630–634, 2011 [DOI] [PubMed] [Google Scholar]
- 2. Akazawa K, Milner TE, Stein RB. Modulation of reflex EMG and stiffness in response to stretch of human finger muscle. J Neurophysiol 49: 16–27, 1983 [DOI] [PubMed] [Google Scholar]
- 3. Angelopoulou N, Tsimaras V, Christoulas K, Mandroukas K. Measurement of range of motion in individuals with mental retardation and with or without Down syndrome. Percept Mot Skills 89: 550–556, 1999 [DOI] [PubMed] [Google Scholar]
- 4. Aruin AS, Almeida GL, Latash ML. Organization of a simple two-joint synergy in individuals with Down syndrome. Am J Ment Retard 101: 256–268, 1996 [PubMed] [Google Scholar]
- 5. Aruin AS, Almeida GL. A co-activation strategy in anticipatory postural adjustments in persons with Down syndrome. Motor Control 1: 178–191, 1997 [Google Scholar]
- 6. Bianchi L, Monaldi F, Paolucci S, Iani C, Lacquaniti F. Quantitative analysis of the pendulum test: application to multiple sclerosis patients treated with botulinum toxin. Funct Neurol 14: 79–92, 1999 [PubMed] [Google Scholar]
- 7. Black D, Chang CL, Kubo M, Holt K, Ulrich B. Developmental trajectory of dynamic resource utilization during walking: toddlers with and without Down syndrome. Hum Mov Sci 28: 141–154, 2009 [DOI] [PMC free article] [PubMed] [Google Scholar]
- 8. Chang CL, Kubo M, Ulrich BD. Emergence of neuromuscular patterns during walking in toddlers with typical development and with Down syndrome. Hum Mov Sci 28: 283–296, 2009 [DOI] [PubMed] [Google Scholar]
- 9. Cimolin V, Galli M, Grugni G, Vismara L, Precilios H, Albertini G, Rigoldi C, Capodaglio P. Postural strategies in Prader-Willi and Down syndrome patients. Res Dev Disabil 32: 669–673, 2011 [DOI] [PubMed] [Google Scholar]
- 10. Dietz V, Discher M, Trippel M. Task-dependent modulation of short- and long-latency electromyographic responses in upper limb muscles. Electroencephalogr Clin Neurophysiol 93: 49–56, 1994 [DOI] [PubMed] [Google Scholar]
- 11. Doemges F, Rack PM. Task-dependent changes in the response of human wrist joints to mechanical disturbance. J Physiol 447: 575–585, 1992 [DOI] [PMC free article] [PubMed] [Google Scholar]
- 12. Fee JW, Jr, Miller F. The Leg Drop Pendulum Test performed under general anesthesia in spastic cerebral palsy. Dev Med Child Neurol 46: 273–281, 2004 [DOI] [PubMed] [Google Scholar]
- 13. Fowler EG, Nwigwe AI, Ho TW. Sensitivity of the pendulum test for assessing spasticity in persons with cerebral palsy. Dev Med Child Neurol 42: 182–189, 2000 [DOI] [PubMed] [Google Scholar]
- 14. Galli M, Rigoldi C, Brunner R, Virji-Babul N, Giorgio A. Joint stiffness and gait pattern evaluation in children with Down syndrome. Gait Posture 28: 502–506, 2008 [DOI] [PubMed] [Google Scholar]
- 15. Glaser EM, Ruchkin DS. Evoked potentials: principal components and varimax analysis. In: Principles of Neurobiological Signal Analysis. New York: Academic, 1976 [Google Scholar]
- 16. Gontijo APB, Mancini MC, Silva PLP, Chagas PSC, Sampaio RF, Luz RE, Fonseca ST. Changes in lower limb co-contraction and stiffness by toddlers with Down syndrome and toddlers with typical development during the acquisition of independent gait. Hum Mov Sci 27: 610–621, 2008 [DOI] [PubMed] [Google Scholar]
- 17. Haley SM. Sequence of development of postural reactions by infants with Down syndrome. Dev Med Child Neurol 29: 674–679, 1987 [DOI] [PubMed] [Google Scholar]
- 18. Harris SR. Neuromotor development of infants with Down syndrome. Dev Med Child Neurol 27: 99–100, 1985 [DOI] [PubMed] [Google Scholar]
- 19. Kearney RE, Stein RB, Parameswaran L. Identification of intrinsic and reflex contributions to human ankle stiffness dynamics. IEEE Trans Biomed Eng 44: 493–504, 1997 [DOI] [PubMed] [Google Scholar]
- 20. Kleinbaum DG, Kupper LL, Muller KE. Variable reduction and factor analysis. In: Applied Regression Analysis and Other Multivariable Methods. Boston, MA: PWS-Kent, 1988 [Google Scholar]
- 21. Krutky MA, Ravichandran VJ, Trumbower RD, Perreault EJ. Interactions between limb and environmental mechanics influence stretch reflex sensitivity in the human arm. J Neurophysiol 103: 429–440, 2010 [DOI] [PMC free article] [PubMed] [Google Scholar]
- 22. Latash ML, Almeida GL, Corcos DM. Preprogrammed reactions in individuals with Down syndrome: the effects of instruction and predictability of the perturbation. Arch Phys Med Rehabil 74: 391–399, 1993 [PubMed] [Google Scholar]
- 23. Latash ML. Motor coordination in Down syndrome: the role of adaptive changes. In: Perceptual-Motor Behavior in Down Syndrome, edited by Weeks DJ, Chua R, Elliott D. Champaign, IL: Human Kinetics, 2000 [Google Scholar]
- 24. Liddell EGT, Sherrington CS. Reflexes in response to stretch (myotatic reflexes). Proc R Soc Lond B Biol Sci 96: 212–242, 1924 [Google Scholar]
- 25. Lin CCK, Lin CCW, Ke TY, Ju MS. Biomechanical models for modified pendulum test of the upper limb. J Med Bio Eng 21: 257–262, 2001 [Google Scholar]
- 26. Lin DC, Rymer WZ. A quantitative analysis of pendular motion of the lower leg in spastic human subjects. IEEE Trans Biomed Eng 38: 906–918, 1991 [DOI] [PubMed] [Google Scholar]
- 27. Livingstone B, Hirst P. Orthopedic disorders in school children with Down's syndrome with special reference to the incidence of joint laxity. Clin Orthop Relat Res 207: 74–76, 1986 [PubMed] [Google Scholar]
- 28. Lydic JS, Steele C. Assessment of the quality of sitting and gait patterns in children with Down syndrome. Phys Ther 59: 1489–1494, 1979 [DOI] [PubMed] [Google Scholar]
- 29. Marsden CD, Merton PA, Morton HB, Rothwell JC, Traub MM. Reliability and efficacy of the long-latency stretch reflex in the human thumb. J Physiol 316: 47–60, 1981 [DOI] [PMC free article] [PubMed] [Google Scholar]
- 30. Matthews PBC. The human stretch reflex and the motor cortex. Trends Neurosci 14: 87–91, 1991 [DOI] [PubMed] [Google Scholar]
- 31. Morris AF, Vaughan SE, Vaccaro P. Measurements of neuromuscular tone and strength in Down's syndrome children. J Ment Defic Res 26: 41–46, 1982 [DOI] [PubMed] [Google Scholar]
- 32. Nichols TR, Houk JC. Improvement in linearity and regulation of stiffness that results from actions of stretch reflex. J Neurophysiol 39: 119–142, 1976 [DOI] [PubMed] [Google Scholar]
- 33. Parker AW, James B. Age changes in the flexibility of Down's syndrome children. J Ment Defic Res 29: 207–218, 1985 [DOI] [PubMed] [Google Scholar]
- 34. Petersen N, Christensen LOD, Morita H, Sinkjær T, Nielsen J. Evidence that a transcortical pathway contributes to stretch reflexes in the tibialis anterior muscle in man. J Physiol 512: 267–276, 1998 [DOI] [PMC free article] [PubMed] [Google Scholar]
- 35. Rigoldi C, Galli M, Albertini G. Gait development during lifespan in subjects with Down syndrome. Res Dev Disabil 32: 158–163, 2011 [DOI] [PubMed] [Google Scholar]
- 36. Sinkjaer T, Toft E, Andreassen S, Hornemann BC. Muscle stiffness in human ankle dorsiflexors: intrinsic and reflex components. J Neurophysiol 60: 1110–1121, 1988 [DOI] [PubMed] [Google Scholar]
- 37. Smith BA, Kubo M, Black DP, Holt KG, Ulrich BD. Effect of practice on a novel task-walking on a treadmill: preadolescents with and without Down syndrome. Phys Ther 87: 766–777, 2007 [DOI] [PubMed] [Google Scholar]
- 38. Smith BA, Ulrich BD. Early onset of stabilizing strategies for gait and obstacles: older adults with Down syndrome. Gait Posture 28: 448–455, 2008 [DOI] [PMC free article] [PubMed] [Google Scholar]
- 39. Ulrich BD, Haehl V, Buzzi UH, Kubo M, Holt KG. Modeling dynamic resource utilization in populations with unique constraints: preadolescents with and without Down syndrome. Hum Mov Sci 23: 133–156, 2004 [DOI] [PubMed] [Google Scholar]
- 40. Valle MS, Casabona A, Sgarlata R, Garozzo R, Vinci M, Cioni M. The pendulum test as a tool to evaluate passive knee stiffness and viscosity of patients with rheumatoid arthritis. BMC Musculoskelet Disord 7: 89, 2006 [DOI] [PMC free article] [PubMed] [Google Scholar]
- 41. Wartenberg R. Pendulousness of the legs as a diagnostic test. Neurology 1: 8–24, 1951 [DOI] [PubMed] [Google Scholar]
- 42. Webber A, Virji-Babul N, Edwards R, Lesperance M. Stiffness and postural stability in adults with Down syndrome. Exp Brain Res 155: 450–458, 2004 [DOI] [PubMed] [Google Scholar]
- 43. Winter DA. Anthropometry. In: Biomechanics and Motor Control of Human Movement. Hoboken: NJ: Wiley, 2009 [Google Scholar]
- 44. Winter EM, Eston RG, Lamb KL. Statistical analyses in the physiology of exercise and kinanthropometry. J Sports Sci 19: 761–775, 2001 [DOI] [PubMed] [Google Scholar]
- 45. Zhang LQ, Rymer WZ. Simultaneous and nonlinear identification of mechanical and reflex properties of human elbow joint muscles. IEEE Trans Biomed Eng 44: 1192–1209, 1997 [DOI] [PubMed] [Google Scholar]


