

Abstract
Sleep deprivation was previously reported to alter microRNA (miRNA) levels in the brain; however, the direct effects of any miRNA on sleep have only been described recently. We determined miRNA 138 (miR-138), miRNA let-7b (let-7b), and miRNA 125a-5p (miR-125a) levels in different brain areas at the transitions between light and dark. In addition, we examined the extent to which inhibiting these miRNAs affects sleep and EEG measures. We report that the levels of multiple miRNAs differ at the end of the sleep-dominant light period vs. the end of the wake-dominant dark period in cortical areas, hippocampus, and hypothalamus. For instance, in multiple regions of the cortex, miR-138, let-7b, and miR-125a expression was higher at the end of the dark period compared with the end of the light period. Intracerebroventricular injection of a specific inhibitor (antiMIR) to miR-138 suppressed sleep and nonrapid eye movement sleep (NREMS) EEG delta power. The antiMIR to let-7b did not affect time in state but decreased NREMS EEG delta power, whereas the antiMIR to miR-125a failed to affect sleep until after 3 days and did not affect EEG delta power on any day. We conclude that miRNAs are uniquely expressed at different times and in different structures in the brain and have discrete effects and varied timings on several sleep phenotypes and therefore, likely play a role in the regulation of sleep.
Keywords: slow-wave activity, RNA interference, antagomir
micrornas (mirnas) are short, noncoding RNAs that regulate diverse biological functions. They do so by mediating mRNA stability and/or impeding its subsequent translation into protein. Previously, we demonstrated that sleep loss alters brain miRNA levels; the magnitude and direction of those effects and the specific miRNAs affected by sleep loss were brain-structure specific (8). Subsequently, we showed that one of the miRNAs upregulated in the hippocampus by sleep loss—miRNA 132 (miR-132)—directly alters sleep (10). However, because multiple miRNAs and their potential mRNA targets are altered by sleep (7, 23, 28), we predicted that brain miRNA levels would be different after the sleep period compared with the end of the active period. To that end, miRNA abundance was measured in multiple brain regions sampled at the end of the 12-h light or dark photoperiods in rats. Herein, we demonstrate that the expression of several miRNAs was different in specific brain structures at these two times, representing high (prelight onset) and low (predark onset) propensity for sleep.
To investigate the hypothesis that miRNAs are involved in the regulation of sleep, we injected specific inhibitors (antiMIRs) to miRNA 138 (miR-138), miRNA let-7b (let-7b), or miRNA 125a-5p (miR-125a) intracerebroventricularly (ICV) and then measured sleep responses. In vivo silencing of miRNAs using modified oligonucleotides has been demonstrated previously by others (11, 12, 20). These miRNAs were chosen because each was affected by sleep loss (8), and there were large differences in the cortical levels of each at different times of the day. We now report that miR-138, let-7b, and miR-125a inhibitors given ICV differentially alter sleep/wake durations and nonrapid eye movement sleep (NREMS) EEG slow-wave activity (SWA; 0.5-4 Hz). Collectively, current results reinforce the hypothesis that miRNAs play a role in sleep regulation.
METHODS
Animals
Animal use was in compliance with National Institutes of Health standards and approved by Washington State University's Institutional Animal Care and Use Committee. All protocols were designed to minimize animal discomfort. Male Sprague-Dawley rats weighing 275–325 g were procured from Taconic Farms (Hudson, NY) and maintained in Association for Assessment and Accreditation of Laboratory Animal Care-approved housing at 23°C ± 1°C. Rats were given food ad libitum and kept on a 12:12-h light (110 ± 5 lx)/dark cycle. For tissue collection in the microarray study, animals were killed by decapitation. At the completion of the sleep studies, rats were killed by carbon dioxide inhalation, followed by cervical dislocation.
Brain miRNA Detection
Two groups of rats (n = 8 each) were acclimated to the light cycle for 10 days for the determination of brain miRNA levels at the end of the light or dark periods using the bioarray miRNA assay. The end of the dark period is the beginning of the sleep period in nocturnal rats when sleep propensity is high. At the end of the light period, sleep propensity is low, as evidenced by rats showing little sleep for the next few hours if left undisturbed. Following decapitation, the hippocampus, hypothalamus, prefrontal cortex, occipital cortex, and somatosensory cortex were dissected using landmarks reported previously (6). Each sample was immersed in RNAlater (Ambion, Austin, TX), placed at 4°C overnight, and then stored at −20°C until RNA was isolated for hybridization on microarrays. RNA isolation, fractionation, labeling, and array hybridization were performed with Ambion's isolation kit, labeling kit, and mirVana bioarrays (Cat. #1560, #1562, and #1564V2, respectively), as described previously (8). The starting quantities of enriched, small RNAs varied between structures (23.5–51.8 μg for the hippocampus, 33.8–48.5 μg for the hypothalamus, 29.0–52.2 μg for the prefrontal cortex, 19.2–46.4 μg for the occipital cortex, and 20.0–48 μg for the somatosensory cortex). Equal amounts of RNA were applied to each array slide. Thus for each of the five structures, four independent samples for each time point were hybridized, according to the manufacturer's protocol. Following hybridization, array slides were scanned, and GenePix Pro 6.0 (Molecular Devices, Sunnyvale, CA) was used to digitize and quantify the array data. The array-specific, positive-control pixel densities were calculated and used to normalize pixel densities of miRNA probes in quadruplicate, and these averages were used to depict the change in miRNA species between the two time points.
Surgery
Rats used for polysomnographic recording and ICV instrumentation were anesthetized with ketamine-xylazine (87 and 13 mg/kg im). Rats were provided with a guide cannula at −1.8 mm posterior, −1.5 mm lateral to bregma, and −3.2 to −3.7 mm ventral to the skull surface. Penetration of the ventricle was determined in the following manner: pyrogen-free saline (PFS) was loaded into a sterilized apparatus consisting of 15 cm Silastic tubing (0.31 mm internal diameter/0.64 external diameter; Helix Medical, Carpinteria, CA), attached to a cannula that was secured within a guide cannula and held by the stereotax calipers. The tubing was then taped to the vertical stereotax arm and the cannula lowered to the point where the PFS column began to flow downward, indicating that the lateral ventricle had been breached. Four stainless-steel jewelry screws with wire leads were positioned at 2 mm rostral or 5.0 mm caudal to the coronal suture and ±3.0 mm on either side of the sagittal suture for EEG recording. A reference screw was placed 3.0 mm posterior to lambda, and nuchal muscles were penetrated with an electromyography (EMG) wire to detect muscle tonus. All wire leads were inserted into a six-pin plug interface (Plastics One, Roanoke, VA), and dental composite (Patterson Dental, St. Paul, MN) was used to affix the electrode wires, guide cannula, and plug interface in position.
After a minimum of 5 days recovery, rats received acute ICV microinjections with 50 ng angiotensin II (Sigma, St. Louis, MO) in 4 μl PFS using a PHD 2000 microinjector (Harvard Apparatus, Holliston, MA) to induce a drinking response, confirming cannula patency (13). Only rats that consumed >5 ml water in 25 min were included in the study.
Oligonucleotide Inhibitors
Single-stranded inhibitors of miR-138, let-7b, or miR-125a (Cat. #AM11727, #AM11050, and #AM12561, respectively), hereafter referred to as antiMIR-138, antiMIR-let7b, and antiMIR-125a, respectively, were purchased from Ambion. Ambion's Negative Control #1 for antiMIRs (Cat. #AM17010) was used as a nonsensical oligonucleotide control.
Recordings and Injections
Rats were handled for 5 min for each of 5 days, during which, their cannula obturators were loosened and retightened to habituate the animal to the experimental protocol. Rats were acclimated in the recording chamber with the recording cable attached for at least 48 h before recordings began. The tethered cable connecting the differential EEG electrode pairs and EMG electrodes was attached to a six-channel commutator (Plastics One), and cables from the commutator were routed to a Grass Technologies Model 15, Model 15A54, 32-channel amplifier (Grass-Telefactor, West Warwick, RI). All amplified signals were digitized at 128 Hz. EEG was filtered below 0.1 Hz and above 100 Hz, whereas EMG was filtered below 30 Hz and above 3 kHz.
After 2 days of adaptation to the recording chamber and 30 min before light onset, animals were removed from the recording set-up, and a 4-pmole dose of antiMIR negative-control sequence was injected in a volume of 4 μl over 2.5 min, after which, the animals were reattached, and recordings began for 24 h. Then, animals were detached from the tether and received antiMIR-138 (n = 9), -let7b (n = 8), or -125a (n = 7) at the same volume and dose (4 pmole) as the control injection. Recordings resumed for the next 7 days.
The vigilance states of wake, NREMS, and rapid eye movement sleep (REMS) were manually scored offline in 10-s epochs using SleepSign for Animal software (Kissei Comtec, Nagano, Japan), as reported previously (10), except only the negative-control day and treatment days 1–3 and 7 were scored and analyzed. Briefly, NREMS was characterized by high-amplitude EEG slow waves in the 0.5- to 4-Hz range, and REMS consisted of less-varied and lower-amplitude waves with a pronounced theta component (6–9 Hz) and low EMG activity, whereas waking was characterized by variable low-amplitude EEG waves in multiple frequencies and elevated EMG activity.
EEG signals were subjected to rodent-specific, threshold-surpassed artifact exclusion, followed by fast Fourier transformation (FFT), and were extracted using a Hanning window filter calculated by SleepSign for Animal software. For each treatment day, EEG SWA (0.5–4 Hz), during NREMS, REMS, or wake, was extracted in 12-h blocks of a light or dark period and normalized to the state-specific EEG SWA corresponding to the negative-control day 12-h light or dark period. For EEG spectral analyses, FFTs were extracted in 12-h time blocks in 0.5 Hz bins. Total spectral content for NREMS-scored epochs in the 0.5- to 20-Hz range was summed for each 12-h time block and sums averaged across the 24-h negative-control day to yield a reference value used to normalize each 12-h bin of negative-control and treatment days. Thus normalized EEG power (μV2) spectrum averages from the first or last 12 h of each day were expressed as a fractional percent of total negative-control power in 0.5 Hz bins.
Statistics
SPSS v.17 software (IBM, Armonk, NY) was used to perform Student's t-tests to analyze miRNA expression of miR-138, let-7b, and miR-125a at the five brain regions from extracts taken at the end of the light period or at the end of the dark period. For ICV injections, time in NREMS, REMS, and NREMS EEG SWA data were analyzed in 12-h time blocks using repeated measures one-way ANOVAs for light and dark conditions of negative-control and treatment days 1–3 and 7. Power spectrum of the first 12 h on each treatment day was analyzed using 2 × 40 ANOVA with factors of treatment and 0.5 Hz bins from 0.5 to 20 with SPSS v.17 software. When the main effects or interaction effects were significant (P < 0.05), a priori comparisons of treatment at each time block or Hz were conducted with a reduced alpha of P < 0.01 to reduce family-wise error rates.
RESULTS
Brain miRNA Levels Change with Time of Day
Multiple regions of the cortex manifested higher levels of miR-138, let-7b, and miR-125a at prelight onset compared with predark onset. miR-138, let-7b, and miR-125a each showed their largest relative fold decreases in the somatosensory cortex and moderate decreases in the occipital cortex at predark onset compared with prelight onset. miR-138 also showed decreases in the prefrontal cortex at predark onset compared with prelight onset, along with let-7b but not miR-125a. Higher levels of miR-138 were also observed at prelight onset in the hippocampus and hypothalamus. However, in these two structures, no differences in let-7b or miR-125a levels were detected (Fig. 1).
Fig. 1.

Region-specific differential expression of brain microRNAs (miRNAs) at 2 times. Data derived from 4 independent arrays for each structure and each time point (40 total arrays), showing miRNA expression of miRNA 138 (miR-138; A), miRNA let-7b (Let-7b; B), and miRNA 125a-5p (miR-125a; C) at the end of the dark phase (prelight onset; black bars) and the end of the light phase (predark onset; white bars) in 5 brain regions: the hippocampus (Hippo), hypothalamus (Hypo), prefrontal cortex (PFCtx), occipital cortex (OccCtx), and somatosensory cortex (SSCtx). Equal amounts of RNA were applied to each array slide. Data are expressed as mean (±SE) optical density normalized to positive-control spots on each array (*P < 0.05; **P < 0.01; ***P < 0.001).
The miRNA detection bioarray is semiquantitative, based on normalization to positive-control spots on each array. Thus the highest concentrations of miRNAs were detected in the hippocampus, relatively moderate miRNA levels in the hypothalamus and prefrontal cortex, and lower miRNA levels in the occipital and somatosensory cortices. Disregarding structure and time of day, let-7b was expressed approximately threefold higher than miR-138 or miR-125a levels (Fig. 1).
Sleep Amounts and EEG SWA Following ICV Administration of miRNA Inhibitors
AntiMIR-138.
Neither NREMS nor REMS amounts were altered during the first post-antiMIR-138 injection treatment day (day 1; Fig. 2A), typical of the delayed small interfering RNA (siRNA) effects on sleep (4, 27). Decreased NREMS amounts observed during the light phase on days 2 and 3 were recovered by day 7 post-antiMIR-138 injection (F4,40 = 2.87, P < 0.05). AntiMIR-138 did not significantly alter the duration of REMS on any day (Fig. 2A).
Fig. 2.
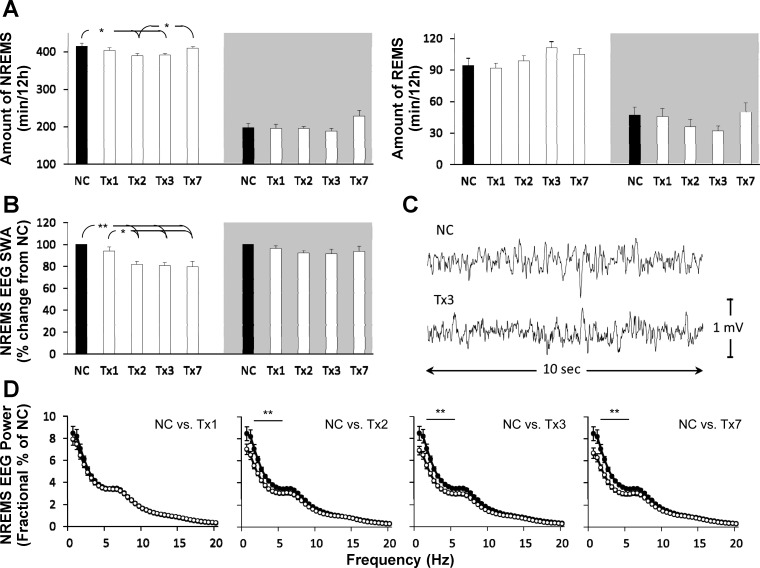
The miR-138 inhibitor attenuates both sleep duration and nonrapid eye movement sleep (NREMS) slow-wave activity (SWA). Effects of intracerebroventricular (ICV) injection of negative control (NC; black-filled bars) and 4 pmoles of a specific single-stranded inhibitor of miR-138 (antiMIR-138; white-filled bars) on (A) sleep duration, (B) NREMS EEG SWA, and (D) NREMS EEG power during the light period of each day. A representative EEG trace (C) from a 10-s NREMS-scored epoch within the 1st h of the light period of NC or 3 days after antiMIR-138 injection. Gray areas depict the lights-off/wake-dominant period. Tx, treatment day; REMS, rapid eye movement sleep (*P < 0.05; **P < 0.01; n = 9).
AntiMIR-138 significantly affected EEG SWA during NREMS in the light phase (F4, 40 = 7.57, P < 0.001) but not during the dark phase (Fig. 2B). Pairwise comparisons indicate that NREMS EEG SWA was reduced substantially on treatment days 2, 3, and 7 compared with treatment day 1 or the negative-control day. Spectral analyses of NREMS-scored EEG epochs from the light period of each day indicated significant decreases in the 1.5- to 5-Hz range on treatment days 2, 3, and 7 compared with negative control (treatment: F4, 40 = 8.55, P < 0.001; Hz × treatment: F156, 1,560 = 2.47, P < 0.01; Fig. 2D).
AntiMIR-let7b.
No significant changes in the amount of NREMS, REMS, or wake were observed on any day following antiMIR-let7b compared with negative-control injections (Fig. 3A). However, antiMIR-let7b injection significantly attenuated NREMS EEG SWA during the light phase on treatment days 2, 3, and 7 compared with treatment day 1 or negative control (F4, 35 = 6.19, P < 0.01; Fig. 3B).
Fig. 3.
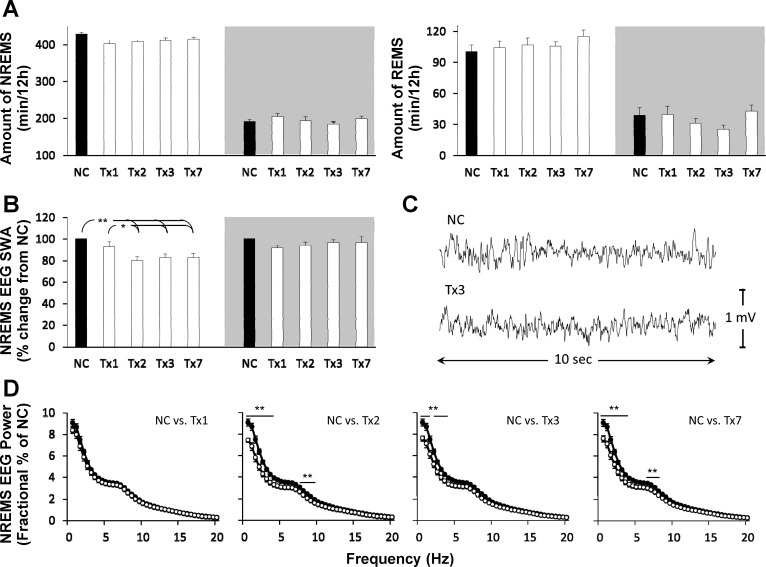
The let-7b inhibitor alters NREMS SWA but not sleep duration. Effects of ICV injection of NC (black-filled bars) and 4 pmoles of a specific single-stranded inhibitor of let-7b (antiMIR-let7b; white-filled bars) on (A) sleep duration, (B) NREMS EEG SWA, and (D) NREMS EEG power during the light period of each day. A representative EEG trace (C) from a 10-s NREMS-scored epoch within the 1st h of the light period of NC or 3 days after antiMIR-let7b injection. Gray areas depict the lights-off/wake-dominant period (*P < 0.05; **P < 0.01; n = 8).
Except for the 1.5- to 1.99-Hz bin on treatment day 3, power spectral analyses of NREMS-scored epochs during the light phase indicated significant decreases in the 0.5- to 3.5-Hz range on treatment days 2, 3, and 7 (treatment: F4, 35 = 7.65, P < 0.001; Hz × treatment: F156, 1,365 = 2.85, P < 0.001; Fig. 3D) from negative control. In addition, decreases in several 0.5 Hz bins within the theta range (6–9 Hz) were also observed.
AntiMIR-125a.
On day 7 after injection of antiMIR-125a, there was a decrease in NREMS amounts during the light phase (F4, 30 = 8.33, P < 0.001) and an increase in NREMS amounts during the subsequent dark phase (F4, 30 = 7.42, P < 0.001; Fig. 4A). Conversely, wake was increased during the light phase (F4, 30 = 6.32, P < 0.01) and decreased during the dark phase (F4, 30 = 6.72, P < 0.01) compared with negative control. NREMS or wake amounts on treatment days 1–3 did not differ from negative control, and there were no significant changes in REMS amounts following antiMIR-125a treatment during the light or dark periods (Fig. 4A). No significant changes in NREMS EEG SWA were detected (Fig. 4B). Accordingly, NREMS EEG spectral analyses indicated no significant treatment effects on any recording day (Fig. 4D).
Fig. 4.
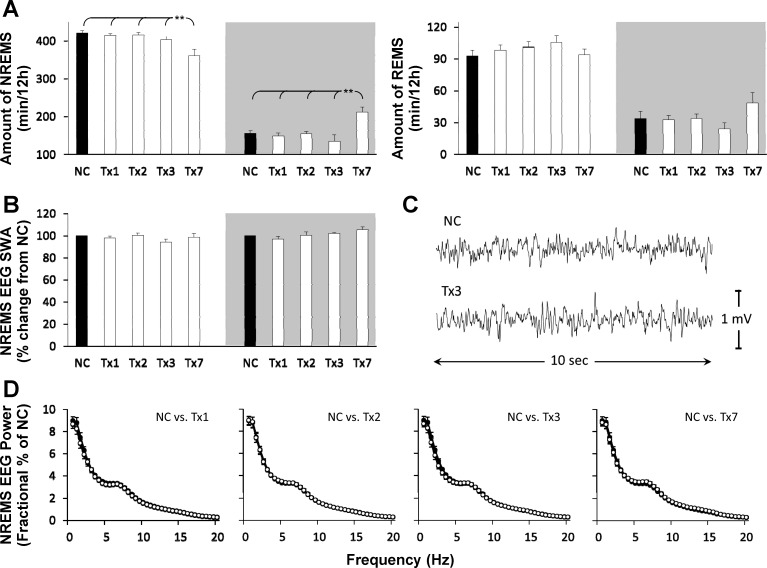
The miR-125a inhibitor alters time in sleep but not NREMS SWA. Effects of ICV injection of NC (black-filled bars) and 4 pmoles of a specific single-stranded inhibitor of miR-125a (antiMIR-125a; white-filled bars) on (A) sleep duration, (B) NREMS EEG SWA, and (D) NREMS EEG power during the light period of each day. A representative EEG trace (C) from a 10-s NREMS-scored epoch within the 1st h of the light period of NC or 3 days after antiMIR-125a injection. Gray areas depict the lights-off/wake-dominant period (**P < 0.01; n = 7).
DISCUSSION
A major finding reported herein is that the expression of several miRNAs differs at the end of dark vs. the end of light periods, corresponding to the peaks and nadirs of sleep propensity in rodents (2). Thus the changes in miRNAs may be a consequence of the sleep-wake cycle or a light-dependent rhythm. The former is much more likely, given that >80% of brain mRNA transcripts that vary throughout the day do so in a sleep-dependent manner (22). Light exposure can induce miRNA expression (5) but may be the result of local neuronal activity. Changes in miRNA expression across time were reported previously (5, 26, 30), and the relative magnitude of those time-dependent changes was of the same order of magnitude of those reported here. The current study, whereas not collecting samples at as many time points as previous circadian rhythm studies, analyzed three areas of cortex, hypothalamus, and hippocampus, thereby enhancing the spatial resolution of miRNA expression. This approach turned out to be beneficial, as the time-of-day-dependent changes in miRNA expression are indeed different in different areas of the brain. The direction of the effect was such that the selected miRNA species in the cortex are lower in abundance at the end of the light period compared with the end of the dark period. The miRNAs studied in this report also change with sleep deprivation (8). By comparison, all three of these miRNAs were upregulated in the hippocampus and downregulated in the hypothalamus and prefrontal and somatosensory cortices following sleep deprivation (8).
Our finding of global downregulation of cortical miRNAs across the sleep period is contrary to the proposition made by Mackiewicz et al. (21), who report that dicer-1 mRNA increases with sleep, thereby suggesting the enhancement of miRNA production during sleep. The endonuclease, dicer, is a core enzymatic regulator of miRNA maturation via excision of the pre-miRNA loop structure. Interestingly, dicer itself is a validated target of let-7b, potentially allowing it to affect general miRNA processing (14, 17). However, our data support the concept of upregulated protein synthesis during sleep, also mentioned by Mackiewicz et al. (21), because miRNAs are capable of destabilizing mRNA and/or impeding its translation (15, 16, 25). The effect of particular miRNA expression patterns on their target mRNAs and protein synthesis remains to be shown.
Another key finding and one that demonstrates the causal nature of miRNA involvement in sleep is that injections of each miRNA inhibitor manifest separate and distinct effects on sleep phenotypes. Injection of antiMIR-138 decreased total sleep time (NREMS and REMS combined) by >1 h over treatment days 2 and 3. In humans, even small amounts of sleep loss over consecutive nights compromise daily functioning (1, 29). The lower total sleep amounts after injection of antiMIR-138 are consistent with findings obtained using conditional dicer knockout (KO) mice; these dicer KO mice have decreased miR-138 levels compared with wild-type mice (18). The dicer KO mice also have increased motor activity, especially at the beginning hours of the light period (18), suggesting decreased total sleep time, as we observed following antiMIR-138 treatment (Fig. 2A). A caveat of this interpretation is that the constituent levels of many miRNAs were altered in the dicer KO mice. Another miRNA inhibitor-specific phenotype was observed following antiMIR-let7b injection, which did not alter time in NREMS, REMS, or wake on any day, but NREMS EEG SWA was affected. Conversely, no changes were observed in EEG SWA following antiMIR-125a or initially in state amounts on treatment days 1–3; however, on day 7, there was a transition of sleep time from the light to the dark period and vice versa. The prolonged onset of these effects is intriguing yet mechanistically difficult to explain.
EEG SWA during NREMS is often interpreted as a measure of sleep intensity (2, 9). The deficits in NREMS EEG SWA following miRNA inhibition of miR-138 and let-7b were prominent and in the case of antiMIR-138, persisted after sleep amounts returned to normal (antiMIR-let7b-induced NREMS EEG SWA deficits were also present on day 7). The majority of the NREMS EEG SWA effects occurred during the light period, which could be due to a floor effect, because in rats, NREMS EEG SWA is lower during the dark phase (3, 19). Regardless, that the actions of miR-138 and let-7b inhibition effectively suppress NREMS EEG SWA during the light phase when the majority of NREMS and REMS episodes occurs suggests that miRNAs alter a sleep phenotype.
The expression pattern of NREMS EEG SWA following miR-138 and let-7b inhibition is consistent with the cortical array results reported herein. Cortical miR-138 and let-7b levels are low when animals are killed at the end of light, and rat NREMS EEG SWA is low at this time (3, 19, 24). Because antiMIR-138- and antiMIR-let7b-induced decreases in NREMS EEG SWA are mostly restricted to the light phase, it may suggest that at least one of the targets of these miRNAs could be co-regulated by a circadian factor. This idea is also supported by the day 7 effects of antiMIR-125a, wherein the rats showed an arrhythmic sleep pattern (i.e., NREMS suppressed during the light and enhanced during the dark). Although speculative, it is possible that miR-125a modulates a target that is expressed in an infradian timescale. miRNAs have already been linked to circadian function, and several miRNAs themselves show a daily rhythmic expression (5, 30), whereas others manifest an ultradian expression pattern (26).
The latency to effect (i.e., lack of change in sleep/wake times and SWA on treatment day 1) is consistent with our previous in vivo attempts to manipulate RNA abundance (27) via ICV delivery with siRNAs, which use the classic miRNA enzymatic machinery. That sleep amounts after antiMIR-let7b were not altered, yet NREMS EEG SWA was affected, coupled with the observations that following antiMIR-125a, NREMS EEG SWA did not change, but NREMS duration did, would indicate that EEG SWA is independently regulated from sleep duration (9).
miRNAs have many potential mRNA targets, for instance, the miR-138, let-7b, and miR-125a lists each contain >1,200 potential targets, as determined by sequence alignment algorithms. It seems likely that miRNAs regulate sleep by affecting the stability of mRNA transcripts that have already been identified as being involved in sleep regulation or otherwise affected by sleep. Precisely how such actions are carried out in a coordinated manner to regulate sleep or other biological rhythms remains to be determined. The complexity of the miRNA actions is great in that it involves multiple target mRNAs, some being degraded and others being stabilized, time-of-day-dependent transcription of many of the target mRNAs, differential rates of translation of each target mRNA, and differential actions of the subsequent proteins on EEG SWA and sleep duration. Such complexity renders miRNA biology difficult to relate directly to physiological function at this time, although it provides a means of integrative, regulatory possibilities and richness to biology. Current results clearly demonstrate heterogeneous consequences on the sleep EEG after manipulation of miR-138, let-7b, or miR-125a and thus provide a basis for further investigations.
In conclusion, we identified three miRNAs that are preferentially expressed at the end of the active period in rodents (end of the dark phase). Two of these miRNA inhibitors affected sleep duration, two affected NREMS EEG SWA, and all appear to be involved in the long-term regulation of sleep. It is highly probable that other miRNAs, including miR-132 (10), are also involved in sleep regulation.
GRANTS
Support for this work was provided by National Institute of Neurological Disorders and Stroke Grant Numbers NS31453 and NS25378 to J. M. Krueger.
DISCLOSURES
No authors have any conflicts of interest pertaining to the contents of this manuscript.
AUTHOR CONTRIBUTIONS
Author contributions: C.J.D. and J.M.K. conception and design of research; C.J.D. performed experiments; C.J.D. and J.M.C. analyzed data; C.J.D., J.M.C., and J.M.K. interpreted results of experiments; C.J.D. prepared figures; C.J.D., J.M.C., and J.M.K. drafted manuscript; C.J.D., J.M.C., and J.M.K. edited and revised manuscript; C.J.D., J.M.C., and J.M.K. approved final version of manuscript.
ACKNOWLEDGMENTS
We thank Andrew M. Elmer for technical assistance in sleep scoring, artifact exclusion, and FFT extractions.
REFERENCES
- 1. Belenky G, Wesensten NJ, Thorne DR, Thomas ML, Sing HC, Redmond DP, Russo MB, Balkin TJ. Patterns of performance degradation and restoration during sleep restriction and subsequent recovery: a sleep dose-response study. J Sleep Res 12: 1–12, 2003 [DOI] [PubMed] [Google Scholar]
- 2. Borbely AA. A two process model of sleep regulation. Hum Neurobiol 1: 195–204, 1982 [PubMed] [Google Scholar]
- 3. Borbely AA, Neuhaus HU. Sleep deprivation: effects on sleep and EEG in the rat. J Comp Physiol 133: 71–87, 1979 [Google Scholar]
- 4. Chen L, Thakkar MM, Winston S, Bolortuya Y, Basheer R, McCarley RW. REM sleep changes in rats induced by siRNA-mediated orexin knockdown. Eur J Neurosci 24: 2039–2048, 2006 [DOI] [PMC free article] [PubMed] [Google Scholar]
- 5. Cheng HY, Papp JW, Varlamova O, Dziema H, Russell B, Curfman JP, Nakazawa T, Shimizu K, Okamura H, Impey S, Obrietan K. microRNA modulation of circadian-clock period and entrainment. Neuron 54: 813–829, 2007 [DOI] [PMC free article] [PubMed] [Google Scholar]
- 6. Churchill L, Taishi P, Wang M, Brandt J, Cearley C, Rehman A, Krueger JM. Brain distribution of cytokine mRNA induced by systemic administration of interleukin-1beta or tumor necrosis factor alpha. Brain Res 1120: 64–73, 2006 [DOI] [PubMed] [Google Scholar]
- 7. Cirelli C, Gutierrez CM, Tononi G. Extensive and divergent effects of sleep and wakefulness on brain gene expression. Neuron 41: 35–43, 2004 [DOI] [PubMed] [Google Scholar]
- 8. Davis CJ, Bohnet SG, Meyerson JM, Krueger JM. Sleep loss changes microRNA levels in the brain: a possible mechanism for state-dependent translational regulation. Neurosci Lett 422: 68–73, 2007 [DOI] [PMC free article] [PubMed] [Google Scholar]
- 9. Davis CJ, Clinton JM, Jewett KA, Zielinski MR, Krueger JM. Delta wave power: an independent sleep phenotype or epiphenomenon? J Clin Sleep Med 7: S16–S18, 2011 [DOI] [PMC free article] [PubMed] [Google Scholar]
- 10. Davis CJ, Clinton JM, Taishi P, Bohnet SG, Honn KA, Krueger JM. MicroRNA 132 alters sleep and varies with time in brain. J Appl Physiol 111: 665–672, 2011 [DOI] [PMC free article] [PubMed] [Google Scholar]
- 11. Elmen J, Lindow M, Schutz S, Lawrence M, Petri A, Obad S, Lindholm M, Hedtjarn M, Hansen HF, Berger U, Gullans S, Kearney P, Sarnow P, Straarup EM, Kauppinen S. LNA-mediated microRNA silencing in non-human primates. Nature 452: 896–899, 2008 [DOI] [PubMed] [Google Scholar]
- 12. Elmen J, Lindow M, Silahtaroglu A, Bak M, Christensen M, Lind-Thomsen A, Hedtjarn M, Hansen JB, Hansen HF, Straarup EM, McCullagh K, Kearney P, Kauppinen S. Antagonism of microRNA-122 in mice by systemically administered LNA-antimiR leads to up-regulation of a large set of predicted target mRNAs in the liver. Nucleic Acids Res 36: 1153–1162, 2008 [DOI] [PMC free article] [PubMed] [Google Scholar]
- 13. Epstein AN, Fitzsimons JT, Simons BJ. Drinking caused by the intracranial injection of angiotensin into the rat. J Physiol 200: 98–100, 1969 [PubMed] [Google Scholar]
- 14. Forman JJ, Legesse-Miller A, Coller HA. A search for conserved sequences in coding regions reveals that the let-7 microRNA targets dicer within its coding sequence. Proc Natl Acad Sci USA 105: 14879–14884, 2008 [DOI] [PMC free article] [PubMed] [Google Scholar]
- 15. Guo H, Ingolia NT, Weissman JS, Bartel DP. Mammalian microRNAs predominantly act to decrease target mRNA levels. Nature 466: 835–840, 2010 [DOI] [PMC free article] [PubMed] [Google Scholar]
- 16. Humphreys DT, Westman BJ, Martin DI, Preiss T. MicroRNAs control translation initiation by inhibiting eukaryotic initiation factor 4E/cap and poly(A) tail function. Proc Natl Acad Sci USA 102: 16961–16966, 2005 [DOI] [PMC free article] [PubMed] [Google Scholar]
- 17. Jakymiw A, Patel RS, Deming N, Bhattacharyya I, Shah P, Lamont RJ, Stewart CM, Cohen DM, Chan EK. Overexpression of dicer as a result of reduced let-7 microRNA levels contributes to increased cell proliferation of oral cancer cells. Genes Chromosomes Cancer 49: 549–559, 2010 [DOI] [PMC free article] [PubMed] [Google Scholar]
- 18. Konopka W, Kiryk A, Novak M, Herwerth M, Parkitna JR, Wawrzyniak M, Kowarsch A, Michaluk P, Dzwonek J, Arnsperger T, Wilczynski G, Merkenschlager M, Theis FJ, Kohr G, Kaczmarek L, Schutz G. MicroRNA loss enhances learning and memory in mice. J Neurosci 30: 14835–14842, 2010 [DOI] [PMC free article] [PubMed] [Google Scholar]
- 19. Krueger JM, Taishi P, De A, Davis CJ, Winters BD, Clinton J, Szentirmai E, Zielinski MR. ATP and the purine type 2 X7 receptor affect sleep. J Appl Physiol 109: 1318–1327, 2010 [DOI] [PMC free article] [PubMed] [Google Scholar]
- 20. Krutzfeldt J, Rajewsky N, Braich R, Rajeev KG, Tuschl T, Manoharan M, Stoffel M. Silencing of microRNAs in vivo with “antagomirs”. Nature 438: 685–689, 2005 [DOI] [PubMed] [Google Scholar]
- 21. Mackiewicz M, Shockley KR, Romer MA, Galante RJ, Zimmerman JE, Naidoo N, Baldwin DA, Jensen ST, Churchill GA, Pack AI. Macromolecule biosynthesis: a key function of sleep. Physiol Genomics 31: 441–457, 2007 [DOI] [PubMed] [Google Scholar]
- 22. Maret S, Dorsaz S, Gurcel L, Pradervand S, Petit B, Pfister C, Hagenbuchle O, O'Hara BF, Franken P, Tafti M. Homer1a is a core brain molecular correlate of sleep loss. Proc Natl Acad Sci USA 104: 20090–20095, 2007 [DOI] [PMC free article] [PubMed] [Google Scholar]
- 23. Pack AI, Galante RJ, Maislin G, Cater J, Metaxas D, Lu S, Zhang L, Von Smith R, Kay T, Lian J, Svenson K, Peters LL. Novel method for high-throughput phenotyping of sleep in mice. Physiol Genomics 28: 232–238, 2007 [DOI] [PubMed] [Google Scholar]
- 24. Pappenheimer JR, Koski G, Fencl V, Karnovsky ML, Krueger J. Extraction of sleep-promoting factor S from cerebrospinal fluid and from brains of sleep-deprived animals. J Neurophysiol 38: 1299–1311, 1975 [DOI] [PubMed] [Google Scholar]
- 25. Pillai RS, Bhattacharyya SN, Artus CG, Zoller T, Cougot N, Basyuk E, Bertrand E, Filipowicz W. Inhibition of translational initiation by Let-7 microRNA in human cells. Science 309: 1573–1576, 2005 [DOI] [PubMed] [Google Scholar]
- 26. Shende VR, Goldrick MM, Ramani S, Earnest DJ. Expression and rhythmic modulation of circulating microRNAs targeting the clock gene Bmal1 in mice. PloS One 6: e22586, 2011 [DOI] [PMC free article] [PubMed] [Google Scholar]
- 27. Taishi P, Churchill L, Wang M, Kay D, Davis CJ, Guan X, De A, Yasuda T, Liao F, Krueger JM. TNFalpha siRNA reduces brain TNF and EEG delta wave activity in rats. Brain Res 1156: 125–132, 2007 [DOI] [PMC free article] [PubMed] [Google Scholar]
- 28. Terao A, Wisor JP, Peyron C, Apte-Deshpande A, Wurts SW, Edgar DM, Kilduff TS. Gene expression in the rat brain during sleep deprivation and recovery sleep: an Affymetrix GeneChip study. Neuroscience 137: 593–605, 2006 [DOI] [PMC free article] [PubMed] [Google Scholar]
- 29. Van Dongen HP, Maislin G, Mullington JM, Dinges DF. The cumulative cost of additional wakefulness: dose-response effects on neurobehavioral functions and sleep physiology from chronic sleep restriction and total sleep deprivation. Sleep 26: 117–126, 2003 [DOI] [PubMed] [Google Scholar]
- 30. Yang M, Lee JE, Padgett RW, Edery I. Circadian regulation of a limited set of conserved microRNAs in Drosophila. BMC Genomics 9: 83, 2008 [DOI] [PMC free article] [PubMed] [Google Scholar]