Abstract
Purpose.
To quantify cells in the ocular anterior chamber (AC) by optical coherence tomography (OCT).
Methods.
A time-domain anterior segment OCT system was used to image latex microsphere suspensions in vitro and the AC of uveitis and normal subjects in vivo. The OCT scan pattern, consisting of 2- and 4-mm-diameter concentric circular scans, was divided into central, superior, and inferior regions. A computer algorithm was developed to automatically identify particles in OCT images. A uveitis specialist used slit-lamp biomicroscopy to grade the AC cells on a scale of 0 to 4+.
Results.
Latex microspheres and AC cells were visualized as reflective spots in OCT images. OCT latex microsphere concentration measurements were highly correlated to known particle concentrations (r = 1.000) and had an efficiency of 0.72. In 30 nongranulomatous and 12 granulomatous eyes, the OCT cell counts correlated well with slit-lamp grades in all three regions (Spearman's rho coefficient: >0.63). The average OCT cell count was 3.7 cells/grade in nongranulomatous eyes and 2.0 cells/grade in granulomatous eyes. OCT revealed significant amounts of inferior AC cells in 5 of 16 quiescent uveitis eyes (mean ± SD: 19.9 ± 7.4 cells). OCT captured rare cells in normal eyes (1.1 ± 1.1 cells centrally).
Conclusions.
OCT provided quantitative information on AC inflammatory cells. The OCT cell counts correlated well with clinical grading, and particles in the inferior AC that were missed by slit-lamp examination were detected by OCT. OCT could be a valuable tool for the diagnosis and management of anterior uveitis.
Optical coherence tomography (OCT) provided quantitative anterior chamber inflammatory cell counts that correlated well with clinical grading. Cells in the inferior anterior chamber that were missed by slit-lamp examination were detected by OCT.
Introduction
Inflammation in the anterior segment of the eye causes breakdown of the blood–aqueous barrier and results in an increase in the number of cells and the protein concentration of the aqueous humor. Examination of the aqueous humor by slit-lamp biomicroscopy is the primary method used to evaluate the severity of anterior segment inflammation. However, slit-lamp microscopy grading of cells is subjective and relies heavily on the experience of the examiner. Moreover, slit-lamp assessment may be difficult in eyes with corneal opacification due to corneal edema.
Optical coherence tomography (OCT) provides micrometer-level resolution and allows cross-sectional imaging of the anterior chamber (AC). OCT AC cell grading (Lowder C, et al. IOVS 2004;45:ARVO E-abstract 3372) and keratic precipitate evaluation were reported in eyes with both clear and edematous corneas.1 In this study, we demonstrated a method using OCT to automatically quantify the number of the cells in the AC of the eye.
Methods
Optical Coherence Tomography Imaging
The anterior segment OCT prototype system (Carl Zeiss Meditec Inc., Dublin, CA) used in this study was previously described.2 In brief, it was a time-domain OCT system utilizing a wavelength of 1310 nm and a scan speed of 2000 axial scans per second. The axial resolution was 17 μm in tissue, and the transverse resolution was 45 μm. The axial scan depth of 8 mm (in air) was sampled to 768 pixels in OCT images.
An “AC grading” scan pattern was designed to image cells in the AC. It was composed of two concentric circular scans with diameters of 2 and 4 mm (Fig. 1). The inner and outer circular scans consisted of 256 and 512 axial scans, respectively. Each AC grading scan was divided into three regions: central (inner circular scan), superior (superior semicircle of the outer circular scan), and inferior (inferior semicircle of the outer circular scan).
Figure 1. .
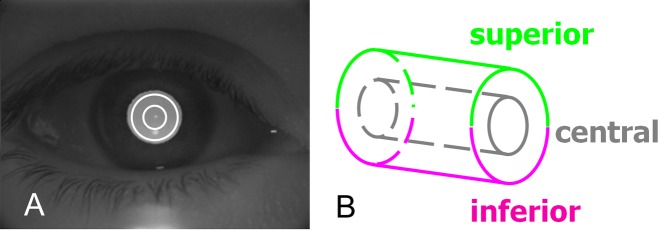
OCT scan pattern for imaging the anterior chamber of the eye. (A) Concentric circular scans of 2- and 4-mm diameters were overlaid on a charge-coupled device image. (B) Data from the central, superior, and inferior regions were analyzed.
In Vitro Measurement
Latex microspheres (Duke Scientific Corporation, Palo Alto, CA) were suspended in distilled water. The average latex microsphere diameter was 3 μm and chosen according to a published report.3 Microsphere suspensions with different particle concentrations were put in disposable plastic cuvettes and imaged with the AC grading scan pattern. The cuvette wall was positioned at approximately the same depth position in OCT scans. The latex microspheres were visualized as hyperreflective spots in OCT images. The microsphere suspension concentrations were 7, 14, 35, 70, 140, 350, and 700 particles/mm3. Each suspension was gently agitated manually to avoid sedimentation before the OCT image was taken.
We developed an image-processing algorithm to automatically identify the cuvette wall and the latex microspheres in OCT images (Fig. 2A). The latex microspheres were identified as hyperreflective spots with high signal intensities in the fluid suspension. To be differentiated from OCT speckle noise, a particle had to be larger than 2 pixels in the image based on 4-connected pixel connectivity (Fig. 2B). Moreover, each adjoining pixel had to have a signal level higher than the reflectance threshold BG + 2(BG_STD), where BG was the average signal level and BG_STD was the SD of the signal level of air. The number of latex microspheres in the central region was recorded for each concentration level.
Figure 2. .
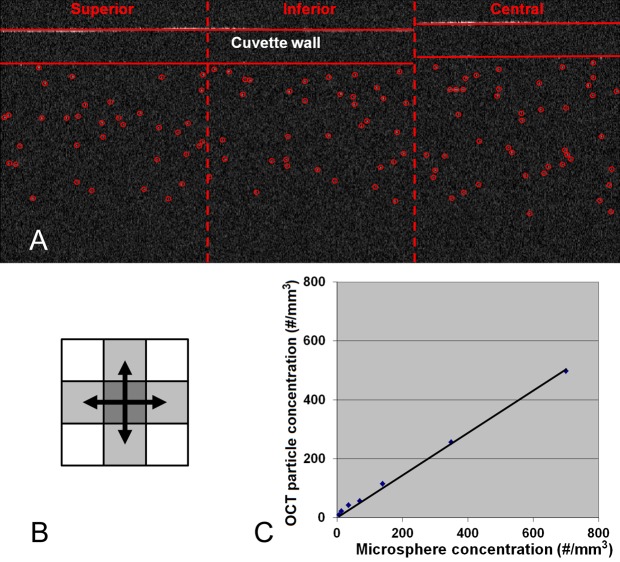
In vitro experiment. (A) OCT images of the latex microsphere suspension in a cuvette. (B) 4-Connected pixel connectivity. (C) Plot of the OCT-measured particle concentration versus latex microsphere concentration.
The concentration of the microsphere suspension measured by OCT was calculated as the number of microspheres identified in the OCT image divided by the valid OCT scan volume. The valid OCT scan volume of the central region was estimated as
 |
where Dcentral was the diameter of the inner circular scan (2 mm), Δx was the transverse resolution (0.045 mm), and dv was the valid fluid suspension depth. The valid fluid suspension depth was the smaller number between the actual fluid depth (below the inner cuvette wall) measured from the OCT image and 2b/nwater, where b = (πΔx2)/2λ was the confocal parameter of the OCT system, λ was the center wavelength (1310 nm), and nwater was the group index of water at 1310 nm (1.342).4
In Vivo Measurement
Subjects.
Anterior uveitis patients were recruited in this prospective cross-sectional observational study at the Cleveland Clinic Cole Eye Institute (Cleveland, OH) between November 2003 and June 2004. The quiescent fellow eye of unilaterally active cases was included in the study if it had a previous episode of uveitis. Randomly selected single eyes of normal subjects were included to serve as a control group. This study followed the tenets of the Declaration of Helsinki, was in accordance with the Health Insurance Portability and Accountability Act of 1996, and was approved by the institutional review board of Cleveland Clinic. Written informed consent was obtained from all subjects after explanation of the nature and possible consequences of the study.
Clinical Examination.
A detailed slit-lamp examination was performed in all cases by an ophthalmologist (CL). The inflammatory cells and macrophages presented in the AC were graded using an ordinal scale according to the total number of cells observed in slit-lamp microscope fields (1 × 1-mm slit beam). The ordinal scale was modified from Hogan et al.5: 0 for no detected cells, 0.5+ for 1–5 cells per field, 1+ for 6–10 cells, 2+ for 11–20 cells, 3+ for 21–50 cells, and 4+ for >50 cells. A descriptor of “nongranulomatous” or “granulomatous” was assigned to each eye with active anterior uveitis. Other slit-lamp observations, such as the presence of pigment granules in the AC and keratic precipitates on the corneal endothelium, were recorded.5
Optical Coherence Tomography Examination.
The OCT imaging was performed with the patient in the sitting position. The subject's head was stabilized by a chin–forehead rest, and the gaze of the eye was stabilized by an internal fixation target. There was no physical contact between the scanning module and the eye.
Three AC grading scans were obtained for each eye. The scan was centered at the corneal vertex. The cornea was positioned at approximately the same depth position in OCT scans and the posterior cornea boundary had to be clearly visible and continuous. Unqualified scans were retaken without saving. The OCT image contained the cornea, AC, part of the crystalline lens, and sometimes part of the iris (Fig. 3). Software algorithms were developed to automatically identify cells inside the AC area. First, the posterior corneal surface and the anterior lens surface (or the anterior surface of the iris if the iris was captured) were detected from the OCT image. Then the cells were identified as hyperreflective particles in the AC with the method we used to detect the latex microspheres as described in the previous section.
Figure 3. .
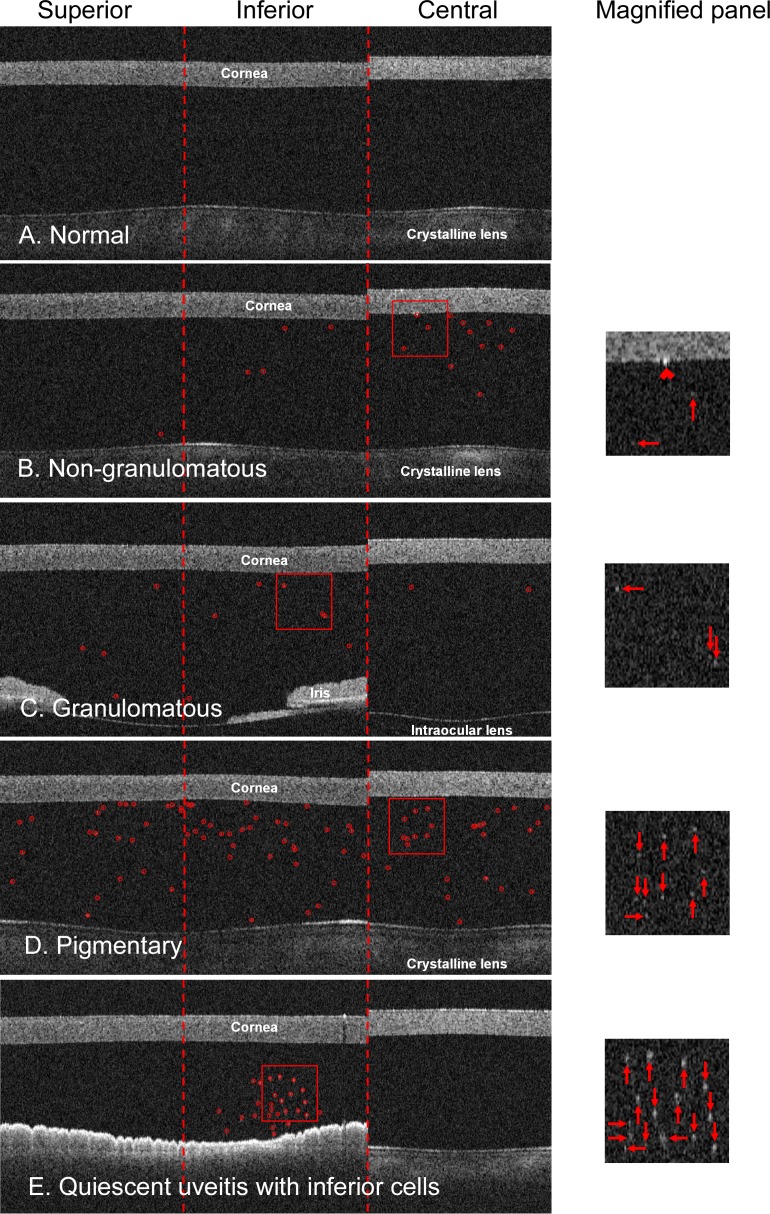
In vivo OCT images acquired with the “AC grading” scan pattern. (A) A normal example with no anterior chamber cells. (B) A nongranulomatous case with slit-lamp cell grade of 0.5+. Anterior chamber cells in the OCT image (circles) and in the magnified panel (arrows). A keratic precipitate (chevron) was present on the corneal endothelium in the central region. (C) A granulomatous case with slit-lamp cell grade of 2+. (D) A pigmentary case with pigment granules in the anterior chamber. (E) An abnormal quiescent uveitis case with cells in the inferior region.
To compare with the slit-lamp microscope field size, the OCT cross-sectional scan area of the central region was estimated as
 |
where Dcentral was the diameter of the inner circular scan (2 mm) and Δx was the transverse resolution of the OCT system (45 μm).
Statistics
In Vitro Measurement.
The concentration of the latex microsphere suspension measured by OCT was plotted against the known microsphere concentration. A linear regression with the intercept set to zero was performed to determine the slope of the line that best fit the data points. The Pearson correlation between the OCT-measured concentration and the known microsphere concentration was calculated.
In Vivo Measurement.
The median cell per grade number of each grade was calculated for the ordinal slit-lamp cell grading system used in this study. Then the average cell per grade number of the ordinal system was estimated by averaging the median cells per grade number for grades 0.5+ to 3+. The regional (central, superior, and inferior) AC cell numbers counted by OCT from three repeated scans were averaged for each eye.
The presence of pigment granules in the AC interfered with cell counting by slit-lamp microscopy and OCT. Therefore, cases with AC pigment granules were excluded from the data analysis. The nongranulomatous and granulomatous cases were analyzed separately. The mean ± SD of the regional OCT cell count was calculated for each slit-lamp grade in nongranulomatous and granulomatous eyes. Cell counts per grade were calculated as the central OCT cell counts divided by corresponding slit-lamp grades. Mean OCT cell counts per grade were estimated by averaging OCT cell counts per grade of the eyes having a slit-lamp grade from 0.5+ to 3+ in each category (nongranulomatous and granulomatous). Two-tailed t-tests were performed to compare the average OCT cell counts per grade in nongranulomatous and granulomatous eyes. Spearman's rho analysis was performed to evaluate the correlation between the OCT cell counts and the slit-lamp cell grades. A linear trend test under the general linear model procedure was performed to determine if the group means of the regional OCT cell counts were associated with the slit-lamp cell grades in nongranulomatous eyes. The linear trend test was not performed in granulomatous cases because of the low number of cases in this study.
Quiescent uveitis eyes appeared inactive, with no AC cells being observed in the slit-lamp examination. However, OCT images illustrated significant numbers of AC cells in some quiescent uveitis eyes. Therefore, we further divided the quiescent uveitis eyes into two groups based on the total cell count of the superior and inferior regions: quiescent low (QU-L, total cell count < threshold) and quiescent high (QU-H, ≥ threshold). The threshold was decided by a histogram shape analysis of the total cell count in quiescent cases using the mode method.6 The mean ± SD of the regional OCT cell count was calculated for QU-L, QU-H, and normal eyes. Two-tailed t-tests were performed to compare the OCT cell count between quiescent uveitis and normal eyes.
The inferior versus total cell distribution was calculated as follows to evaluate the asymmetry of the cell distribution in the AC of the eye:
 |
If no cell was detected in either superior or inferior regions of an eye, the inferior versus inferior plus superior cell distribution value was set to 0.5. Two-tailed t-tests were performed to compare the AC cell distributions between uveitis and normal eyes. Moreover, we used a single mean test to determine if the cells were asymmetrically distributed between the inferior and superior regions of uveitis and normal eyes. For symmetric distribution, the ratio of inferior to total cells would be 0.5. For eyes with a greater number of cells in the inferior region the ratio would be >0.5, and for eyes with a greater number of cells in the superior region, the ratio would be <0.5.
The normality of the data was verified with the Kolmogorov–Smirnov test. The generalized estimating equation was used to account for the intereye correlation in the tests to compare means and the linear trend test.7 If both eyes of a subject were involved in the study, a randomly selected eye was chosen for the Spearman's rho analysis to avoid the correlation between the two eyes from the same patient. The significance level of all tests was set to 0.05. The descriptive statistics, linear regressions, and t-tests were performed using commercial spreadsheet software (Excel, version 14.0; Microsoft Corporation, Redmond, WA). The Spearman's rho analysis and the Kolmogorov–Smirnov tests were performed with commercial statistical software (MedCalc 12.0; MedCalc Software bvba, Mariakerke, Belgium). The linear trend test was performed using commercial analytical software (SAS 9.2; SAS Institute Inc., Cary, NC).
Results
In Vitro Measurement
The latex microspheres were automatically identified in the OCT images (Fig. 2A), and the number of the particles were recorded. The confocal parameter b of the OCT system used in this study was 2.45 mm. The concentration of the microsphere suspension measured by OCT was highly correlated with the actual microsphere concentration (Pearson correlation = 1.000). The linear regression (Fig. 2C) provided an estimate of the OCT-measured particle concentration, which equaled 0.720 × microsphere concentration (R2 = 0.996).
In Vivo Measurement
Sixty-six eyes of 35 patients with anterior uveitis were recruited in this study. Eight eyes with AC pigment granules were excluded from statistical analysis. Thirty eyes had nongranulomatous uveitis, 12 had granulomatous uveitis, and 16 had quiescent uveitis. The control group included 19 eyes of 19 normal subjects.
The slit beam used in the slit-lamp microscope examination had an area of 1 mm2. The ordinal slit-lamp cell grading system used in this study had approximately 8 cells/grade for both nongranulomatous and granulomatous cases.
The OCT cross-sectional scan area of the central region was estimated to be 0.283 mm2. Cells in the AC were automatically identified in normal (Fig. 3A) and anterior uveitis cases (Figs. 3B–E) and counted in OCT images (Tables 1 and 2, Fig. 4). The average OCT cell count of 3.7 cells/grade in nongranulomatous eyes was significantly higher (P = 0.012) than that in granulomatous eyes (2.0 cells/grade). Spearman's coefficient of rank correlation showed that OCT AC cell counts correlated well with slit-lamp cell grades in both nongranulomatous and granulomatous eyes (Tables 1 and 2). The linear trend test on nongranulomatous eyes showed that the group means of the OCT AC cell counts were significantly associated with the slit-lamp cell grades in all three regions (P < 0.001).
Table 1. .
Anterior Chamber Cell Count by OCT in Nongranulomatous Uveitis
|
|
Slit-Lamp Grades |
Spearman's Coefficient |
|||||
|
0.5+ |
1+ |
2+ |
3+ |
4+ |
Rho |
P |
|
| n, eyes | 6 | 10 | 2 | 8 | 4 | ||
| Central | 1.9 ± 1.9 | 3.7 ± 3.2 | 7.2 ± 3.1 | 10.7 ± 7.3 | 33.6 ± 24.5 | 0.73 | 0.0002 |
| Superior | 2.6 ± 1.6 | 4.6 ± 3.1 | 7.6 ± 1.1 | 9.7 ± 4.2 | 24.9 ± 20.5 | 0.75 | 0.0001 |
| Inferior | 4.1 ± 1.9 | 5.1 ± 4.9 | 7.3 ± 4.4 | 12.7 ± 7.5 | 35.2 ± 25.1 | 0.56 | 0.008 |
n indicates number of eyes.
Table 2. .
Anterior Chamber Cell Count by OCT in Granulomatous Uveitis
|
|
Slit-Lamp Grades |
Spearman's Coefficient |
||||
|
0.5+ |
1+ |
2+ |
3+ |
Rho |
P |
|
| n, eyes | 4 | 3 | 2 | 3 | ||
| Central | 1.1 ± 0.4 | 2.2 ± 1.7 | 3.5 ± 1.2 | 5.2 ± 2.6 | 0.74 | 0.022 |
| Superior | 1.3 ± 0.8 | 1.6 ± 0.8 | 1.8 ± 1.6 | 5.6 ± 4.0 | 0.73 | 0.025 |
| Inferior | 1.2 ± 0.2 | 2.4 ± 1.7 | 3.8 ± 1.2 | 15.3 ± 11.7 | 0.062 | 0.049 |
n indicates number of eyes.
Figure 4. .
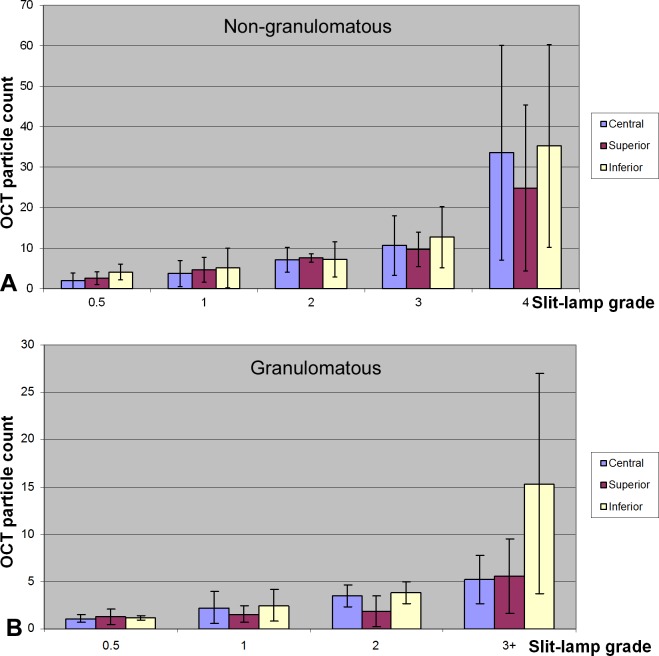
Bar plots of OCT cell counts versus slit-lamp cell grades. (A) Nongranulomatous eyes. (B) Granulomatous eyes.
The cutoff threshold of the total cell number in quiescent cases was decided to be 6. Accordingly, 11 quiescent uveitis cases were QU-L (total cell number < 6) and 5 quiescent cases were QU-H (≥6). The QU-H eyes had significantly higher OCT cell counts in the inferior region than the normal control (19.9 ± 7.4 vs. 1.0 ± 0.9, P < 0.0001, Table 3, Fig. 5). Otherwise, there were no significant differences between the eyes with quiescent uveitis and normal eyes.
Table 3. .
Anterior Chamber Cell Count by OCT in Quiescent Uveitis Eyes
|
|
Quiescent Uveitis |
Normal |
|
|
QU-L |
QU-H |
||
| n, eyes | 11 | 5 | 19 |
| Central | 1.0 ± 0.8 | 2.3 ± 2.1 | 1.1 ± 1.1 |
| Superior | 1.7 ± 0.7 | 2.3 ± 1.5 | 0.9 ± 1.0 |
| Inferior | 0.9 ± 0.7 | 19.9 ± 7.4* | 1.0 ± 0.9 |
n indicates number of eyes.
Two-tailed t-test between the quiescent uveitis and normal eyes, P < 0.0001.
Figure 5. .
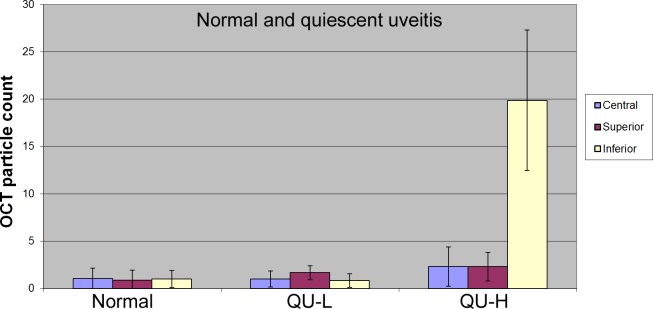
Bar plot of OCT cell counts in normal and quiescent uveitis cases.
A symmetrical distribution of cells throughout the AC would result in an inferior/total cell ratio of 0.5. For QU-L eyes, the ratio was 0.31 (Table 4), indicating there were significantly more cells in the superior AC than in the inferior chamber (P = 0.0026). For QU-H eyes, the ratio was 0.89, indicating significantly more cells in the inferior AC (P = 0.0003). For nongranulomatous, granulomatous, and normal eyes, the distribution of cells was statistically symmetrical (P > 0.05 for each).
Table 4. .
Anterior Chamber Cell Distribution by Disease Classification
|
|
Nongranulomatous |
Granulomatous |
QU-L |
QU-H |
Normal |
| n, eyes | 30 | 12 | 11 | 5 | 19 |
| Inferior/Total | 0.55 ± 0.15 | 0.60 ± 0.17 | 0.31 ± 0.19 | 0.89 ± 0.06 | 0.59 ± 0.35 |
| P value* | 0.80 | 0.82 | 0.0026 | 0.0003 |
n indicates number of eyes.
Inferior/Total = inferior vs. inferior plus superior cell distribution.
Two-tailed t-test between the uveitis and normal eyes.
Keratic precipitates were present in OCT images of seven eyes as discrete hyperreflective spots attached to the endothelium of the cornea (Fig. 3B).
Discussion
Ophthalmologists are trained to evaluate the severity of anterior segment inflammation by examining the aqueous humor by slit-lamp biomicroscopy. Various systems have been reported to quantify the cell number and estimate the amount of protein in the AC.5,8 The slit-lamp cell grading system utilizes ordinal levels to represent a hierarchy of increasing cell numbers. The grading scale is not linear and is only semiquantitative. The ability to quantify inflammation relies heavily on the experience of the examiner. A method to quantify the amount of cells more precisely and objectively is needed to evaluate and manage many conditions characterized by intraocular inflammation. Laser flare-cell photometry is an automated technique to quantify cells and protein levels (“flare”) in the aqueous humor.9 It was first reported by Sawa et al.3 in 1988 and was commercialized later (KOWA Company, Ltd., Tokyo, Japan). It has been used in a variety of research and clinical situations to assess anterior segment inflammation.9 However, laser flare-cell photometry requires a specialized device dedicated for AC cell and flare measurements. It is not routinely used at uveitis centers worldwide.10
In contrast, OCT is a versatile noncontact imaging technique that can provide micrometer-scale cross-sectional and three-dimensional imaging of biological tissue in real time. OCT has already become a standard diagnostic tool in ophthalmology. It enables more sensitive diagnosis of diseases in both the anterior and posterior segments of the eye, monitors disease progression, and evaluates response to treatments. Our group was the first to evaluate AC inflammation by using an anterior segment OCT instrument (Lowder C, et al. IOVS 2004;45:ARVO E-abstract 3372). In 2009, Agarwal et al.1 published the first journal paper on this topic. They used a similar anterior segment OCT system (Visante; Carl Zeiss Meditec) to evaluate the AC inflammation in eyes with either clear or edema-opacified corneas.1 Using both computer algorithm and manual identification of AC cells in OCT images, they quantified inflammation and cells, even in corneas with reduced clarity. Thus, AC cell grading is one of the new clinical applications that benefits from the versatility of OCT.
In this study, we presented an objective method to quantify cells present in aqueous humor in both uveitis and normal subjects. The in vitro calibration experiment demonstrated that the particle concentration measured automatically by OCT was highly correlated to the latex microsphere concentration. The efficiency of OCT particle counting was 0.72. The in vivo clinical study showed that the OCT AC cell counts correlated well with the slit-lamp cell grades in both nongranulomatous and granulomatous eyes.
The average OCT cell count per grade in nongranulomatous eyes was almost doubled that in granulomatous eyes (3.7 cells/grade vs. 2.0 cells/grade). One explanation could be that the visibility of the AC cells under the slit-lamp microscope may depend on both the cell size and the cell type. Different types of cells, such as inflammatory cells, macrophages, and pigment granules, may be presented in aqueous humor with intraocular inflammation. The average size of the lymphocytes, neutrophils, and monocytes ranges from 10 to 20 μm. Macrophages are usually larger and pigment cells are usually smaller than that range. Lymphocytes and plasma cells predominate in nongranulomatous inflammation. Macrophages comprise a major portion of granulomatous inflammatory infiltrates.11 Cells presented in nongranulomatous cases may be less visible under a slit-lamp microscope. In contrast, OCT provides a more objective cell count because it identifies faint cells as well as obvious ones.
Cells are rarely present in the AC of normal individuals (Lowder C, et al. IOVS 2004;45:ARVO E-abstract 3372). Accordingly, the current clinical standard, established by the Standardization of Uveitis Nomenclature (SUN) Working Group grading scheme for AC cells, has a higher cutoff criteria of <1 cell in the field for Grade 0,8 instead of 0 cell used in the Hogan system.5 The inferior AC OCT cell counts were abnormally high in five quiescent uveitis cases (categorized as QU-H), with a slit-lamp cell grade of zero. Moreover, the distribution index of inferior to total AC cells in QU-H eyes was significantly higher than that of normal eyes (0.89 vs. 0.59). However, the central and superior OCT cell counts in QU-H eyes were not significantly different from those of normal eyes. This discrepancy could be due to the fact that OCT examined more inferior regions (2- and 4-mm-diameter circular scans centered at the pupil) than the slit-lamp biomicroscopy (central 1-mm2 fields). The cells distributed inferiorly were likely to have been missed by the slit-lamp examination but captured in OCT scans.
We hypothesize that the uneven distribution of cells in the AC is caused by the thermally driven aqueous humor circulation inside the AC. The aqueous humor is cooler near the cornea and warmer near the iris due to heat conduction. The cooler aqueous will flow downward and the warmer aqueous will flow upward to form a circulation inside the AC (Fig. 6). The aqueous circulation may agitate small and light cells to be evenly distributed in the AC. However, this gentle aqueous current may not be strong enough to circulate the large and relatively heavy cells; therefore, the large and heavier cells can become trapped in the inferior part of the AC. They are likely to be missed by the slit-lamp biomicroscopy, which examines only the central part of the AC.
Figure 6. .
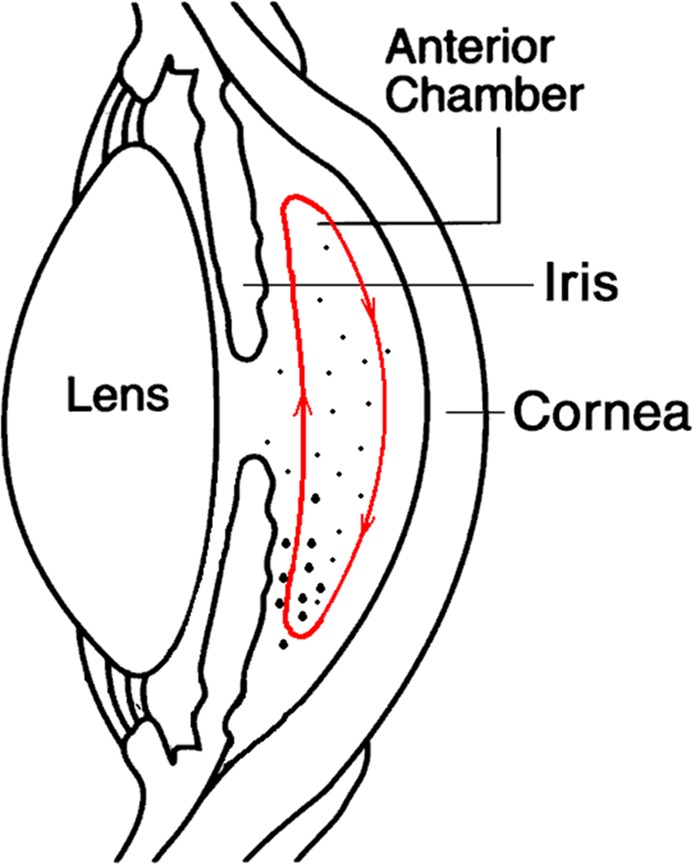
Illustration of the thermally driven aqueous humor circulation in the AC. (Diagram of the anterior chamber eye, courtesy: National Eye Institute, National Institutes of Health, Bethesda, MD.)
One limitation of this study was that we used a time-domain OCT system with a relatively low scan speed (2000 Hz) and relatively low resolutions (17 μm in tissue). The size of the AC cells was not investigated in this study. More recently, Fourier-domain OCT systems scanning 10–100 times faster than time-domain OCT instruments and providing much higher axial resolution (2–5 μm) became available.12 The composition of the AC cells is often unknown without an invasive diagnostic aqueous tap. In future studies, we will use a Fourier-domain OCT system with high axial resolution (3–5 μm) to further investigate the cell sizes. Benefitting from the faster scan speed and higher resolution of the newer generation OCT, a more comprehensive scan pattern can be designed to sample the AC with a better resolution and shorter scan time. It may provide important information to decipher AC inflammatory cell subtypes that can aid in differential diagnosis of the anterior uveitis. Another limitation of the study was that the presence of inferior AC cells in quiescent cases was not confirmed by slit-lamp examinations. Nevertheless, the central OCT cell count of the quiescent cases agreed well with clinical grading (central cell count equivalent in QU-H, QU-L, and normal cases, P > 0.05, Table 3). It suggested that the inferior hyperreflective particles identified by OCT in quiescent cases were likely to be cells. Moreover, the superior OCT cell counts in quiescent cases were equivalent to those of normal eyes (P > 0.05, Table 3). It supported our speculation that the QU-H inferior cells were possibly heavier cells such as macrophages. In future studies, we plan to have the uveitis specialist to examine the superior and inferior regions of the AC in addition to grade the AC cells centrally.
In summary, OCT provided objective and quantitative information on AC inflammatory cells. The OCT cell counts correlated well with the slit-lamp microscope cell grades. OCT, which detected particles in the inferior region of the AC missed by clinical slit-lamp examination, might be a valuable tool in the management of anterior uveitis.
Footnotes
Presented in part at the annual meeting of the Association for Research in Vision and Ophthalmology, Fort Lauderdale, Florida, May 2004.
Supported in part by National Eye Institute/National Institutes of Health Grants R01EY018184 and EY13015, and a Carl Zeiss Meditec, Inc. research grant. YL and DH have a significant financial interest in Optovue, Inc. (Fremont, CA), a company that may have a commercial interest in the results of this research and technology. These potential conflicts of interest have been reviewed and managed by Oregon Health and Science University. The rest of the authors have no proprietary interest in the topic of this manuscript.
A portion of this work has been published previously as an ARVO abstract: Lowder C, et al. IOVS 2004;45:ARVO E-abstract 3372.
Disclosure: Y. Li, Carl Zeiss Meditec, Inc. (F); C. Lowder, None; X. Zhang, None; D. Huang, Carl Zeiss Meditec, Inc. (F, C, R), Optovue, Inc. (I, R), P
References
- 1. Agarwal A, Ashokkumar D, Jacob S, Saravanan Y. High-speed optical coherence tomography for imaging anterior chamber inflammatory reaction in uveitis: clinical correlation and grading. Am J Ophthalmol. 2009; 147: 413–416 [DOI] [PubMed] [Google Scholar]
- 2. Li Y, Shekhar R, Huang D. Corneal pachymetry mapping with high-speed optical coherence tomography. Ophthalmology. 2006; 113: 791–792 [DOI] [PMC free article] [PubMed] [Google Scholar]
- 3. Sawa M, Tsurimaki Y, Tsuru T, Shimizu H. New quantitative method to determine protein concentration and cell number in aqueous in vivo. Jpn J Ophthalmol. 1988; 32: 132–142 [PubMed] [Google Scholar]
- 4. Lin RC, Shure MA, Rollins AM, Izatt JA, Huang D. Group index of the human cornea at 1.3-micron wavelength obtained in vitro by optical coherence domain reflectometry. Opt Lett. 2004; 29: 83–85 [DOI] [PubMed] [Google Scholar]
- 5. Hogan MJ, Kimura SJ, Thygeson P. Signs and symptoms of uveitis. I. Anterior uveitis. Am J Ophthalmol. 1959; 47: 155–170 [DOI] [PubMed] [Google Scholar]
- 6. Sonka M, Hlavac V, Boyle R. Image Processing, Analysis, and Machine Vision. 2nd ed. Pacific Grove, CA: Brooks/Cole; 1999. [Google Scholar]
- 7. Liang K, Zeger S. Longitudinal data analysis using Generalized Linear Models. Biometrika. 1986; 73: 13–22 [Google Scholar]
- 8. Jabs DA, Nussenblatt RB, Rosenbaum JT. Standardization of uveitis nomenclature for reporting clinical data. Results of the First International Workshop. Am J Ophthalmol. 2005; 140: 509–516 [DOI] [PMC free article] [PubMed] [Google Scholar]
- 9. Ladas JG, Wheeler NC, Morhun PJ, Rimmer SO, Holland GN. Laser flare-cell photometry: methodology and clinical applications. Surv Ophthalmol. 2005; 50: 27–47 [DOI] [PubMed] [Google Scholar]
- 10. Tugal-Tutkun I, Herbort CP. Laser flare photometry: a noninvasive, objective, and quantitative method to measure intraocular inflammation. Int Ophthalmol. 2010; 30: 453–464 [DOI] [PubMed] [Google Scholar]
- 11. Rao NA, Forster DJ, Augsburger JJ. The Uvea: Uveitis and Intraocular Neoplasms. Dubuque, IA: WCB Communications; 1992. [Google Scholar]
- 12. Fujimoto JG, Huang D. Introduction to optical coherence tomography. In: Huang D, Duker JS, Lumbroso B, Schuman JS, Weinred R. eds Imaging the Eye from Front to Back with RTVue Fourier-Domain Optical Coherence Tomography. 1st ed. Thorofare, NJ: SLACK Incorporated; 2010: 1–21 [Google Scholar]


