

Abstract
Background
Interest in the determinants of “successful aging” is growing. Nonetheless, successful aging remains ill defined, and its appropriate measurement is hotly contested. Most studies have focused on the absence of disability or deficits in physical performance as outcomes. The present study extends this research by using the Health Utilities Index Mark 3 (HUI3), a multidimensional measure of health status, to examine the maintenance of exceptionally good health among older participants in the Canadian National Population Health Survey (1994–2004).
Methods
The maintenance of exceptionally good health in old age was examined prospectively among 2432 individuals (65–85 years old at baseline) who met the inclusion criteria. The participants were classified into one of four health trajectories: thrivers (who maintained exceptional health with no or only mild disability), nonthrivers (who experienced a moderate or severe disability), the deceased, and the institutionalized.
Results
In 10 years of follow-up, 190 (8%) were thrivers (HUI3 score ≥ 0.89 at all interviews), 1076 (47%) were nonthrivers, 893 (36%) died, and 273 (9%) were institutionalized. The maintenance of exceptionally good health among the elderly participants was related to younger age at baseline, socioeconomic status (higher income), psychosocial factors (including lower psychological distress), and behavioral factors (never smoked and moderate alcohol use).
Conclusions
The maintenance of exceptionally good health in old age is related, at least in part, to modifiable lifestyle factors. However, elevated socioeconomic status also distinguishes those who are able to maintain exceptionally good health.
Keywords: Aging, Epidemiology, Longitudinal, Population health
The rapid rise in life expectancy, coupled with the declining fertility rate during the past century, has accelerated the growth in the elderly fraction of the population (1). The proportion of older adults (60 years old or older) in the world's population is expected to increase from 10% in 2005 to 22% in 2050 (2). In some developed countries, the proportion of older persons is now close to 1 in 5. Some have suggested that, if current trends continue, during the first half of the 21st century, the proportion of older adults will reach 1 in 4 overall and 1 in 2 in certain countries (3).
Now that elderly people are living longer, their quality of life is a growing concern. The review by Depp and Jeste (4) of nearly 900 articles on “successful” and “healthy” aging that were published between 1978 and 2005 revealed that approximately one-third of adults 60 years old or older were classified as successful agers. According to that review, the most frequent significant correlates of successful aging were younger age (i.e., young old), not smoking, physical activity, more social contacts, better self-assessed health, and the absence of arthritis or a cognitive impairment. Sex, socioeconomic factors, and marital status were not related to successful aging.
Problems that hamper this growing line of research are inconsistencies in the ways successful aging has been operationally defined, measured, and predicted. Equally important, most studies of successful (healthy) aging have focused on the development of pathology (e.g., functional impairment), rather than on the maintenance of positive health (4,5). One notable exception [not included in the Depp and Jeste review (4)] is the recent study by Willcox and colleagues (6). This prospective cohort study followed for up to 40 years some 5820 Japanese American middle-aged men who were living in Hawaii free of morbidity and functional impairment at the baseline to assess overall and “exceptional” survival in older adulthood. Of the original participants, 41% survived to age 85, and 11% met the criteria for exceptional survival to age 85.
The National Institute on Aging's Longitudinal Data on Aging Working Group (7) stressed that longitudinal studies on aging are particularly valuable for identifying persons with one or more exceptionally “positive” traits. This information could contribute to the development of better interventions to sustain exceptionally good health in an aging population. The purpose of the present study was to extend the body of research on successful aging conducted in recent years by using a well-established, multidimensional measure of health status with a large, representative sample of the Canadian population (8). We first assessed the maintenance of exceptionally good health over 10 years (defined as “thriving” in old age) and then sought to identify the key health, behavioral, psychosocial, and socio-demographic factors that are associated with thriving in old age. Notice that the outcome measure is the maintenance of exceptional health among older persons during 10 years of follow-up rather than the cross-sectional prevalence of exceptional health among the elderly population at a given point in time. Although some studies have looked at exceptional longevity [e.g., (9)], to our knowledge, no other study has used such a follow-up survey with repeated measures to determine the maintenance of exceptionally good health in a large, population-based sample of older persons.
Methods
Longitudinal data from the Canadian National Population Health Survey (NPHS) were used to study older adults who maintained exceptional health (termed “thrivers”) over a decade and to identify the factors associated with thriving. The NPHS sample was based on a stratified, multistage probability sample of persons 12 years old or older. Starting in 1994–1995, Statistics Canada began to administer the NPHS every 2 years to 17,276 selected household members from all Canadian provinces, including 2740 persons 65 years old or older at baseline (10). Because of the small number of thrivers 85 years old or older, the present analysis was limited to participants 65–85 years old, resulting in the exclusion of 168 participants older than 85 years. The attrition rates across all the cycles ranged from 6.7% to 9.3%. A total of 1640 deaths were confirmed through December 31, 2003 with data from the Canadian Vital Statistics System.
Measures
Health status was assessed with the Health Utilities Index Mark 3 (HUI3) (11). The HUI3 includes a health-status description system that is based on eight attributes: vision, hearing, speech, ambulation, dexterity, emotion, cognition, and pain/discomfort. There are five or six levels per attribute, ranging from no problem through severe disability (see Appendix). Overall HUI3 scores range from 1.00 (“perfect health”) to –0.36 (highest possible level of disability across all attributes). The negative scores for HUI3 indicate health states viewed as worse than dead by respondents from a random sample of the general population. Respondents in the survey who provided the preference scores used to estimate the multiplicative multiattribute utility function for the HUI3 system were asked to think about living the rest of their life expectancy in the state described (12). When evaluating the all-worst HUI3 health state, the state with each attribute at its lowest (most impaired) level (blind, deaf, unable to speak, unable to get around, no use of hands and fingers, so unhappy that life is not worthwhile, unable to think and remember, severe pain that prevents most activities), 90% of respondents said that they would prefer to be dead rather than live in the all-worst state for the specified period of time. As a result, a number of HUI3 health states were viewed as being “worse than dead.”
Following Feeny and colleagues (12), overall HUI3 scores were categorized into four groups: no disability (HUI3 = 1.00), mild disability (HUI3 = 0.89–0.99), moderate disability (HUI3 = 0.70–0.88), and severe disability (HUI3 < 0.70). For example, a person with level 2 vision and level 1 for each of the other seven attributes would have an overall HUI3 score of 0.97. A detailed description of HUI3's validity, reliability, and scoring procedures can be found elsewhere (11–19).
The participants were classified into one of four health trajectories: thrivers (who maintained exceptional health with no or only mild disability), nonthrivers (who experienced a moderate or severe disability), the deceased, or the institutionalized. To be included in the thriving group, a participant needed to have data for at least five of the six cycles, could not have missing data at the last cycle, and must have had an HUI3 score ≥ 0.89 at each cycle. The analyses excluded 140 apparent thrivers who were missing data in at least two survey cycles. Among the excluded apparent thrivers, 90% were missing data on the last cycle. Nonthrivers were participants who did not have an HUI3 score of 0.89 or higher across all the cycles and survived and were not institutionalized at any point during the 10-year follow-up. The deceased or institutionalized groups refer to participants who died or were institutionalized at any time during the 10-year follow-up.
Independent Variables
In addition to estimating the frequencies of the four health status trajectories, we identified the factors that are associated with membership in each trajectory. The independent variables we considered are factors that are thought to be systematically associated with health status (20,21) and quality of life in older adulthood (22). The independent variables were measured at the baseline in 1994–1995.
The independent variables included sex, marital status, education, household income, potentially life-threatening illnesses (high blood pressure, diabetes, heart disease, cancer, and/or stroke) (23), other chronic illness (allergies, asthma, arthritis/rheumatism, back problems, migraine, chronic bronchitis, sinusitis, epilepsy, stomach/intestinal ulcers, urinary incontinence, Alzheimer/dementia, cataracts, glaucoma, and/or other), number of functional limitations (“preparing meals,” “shopping for necessities,” “doing everyday housework,” “doing heavy household chores,” “personal care,” and/or “moving about inside the house”), self-rated health (“poor,” “fair,” “good,” “very good,” or “excellent”), number of prescription and over-the-counter medications, smoking status, alcohol use (moderate = 1–14 drinks per week vs none or heavy), physically active (at least 3 times per week for at least 15 minutes vs inactive) (24,25), and normal weight (body mass index [BMI] of 18.5–24.9 kg/m2 vs other).
Psychosocial factors included the Kessler 6-item nonspecific psychological distress scale (26), Rosenberg's self-esteem scale (27), a sense of mastery scale (28), Antonovsky's sense of coherence scale (29), a measure of social involvement in associations or voluntary organizations and church attendance, and a measure of perceived social support (30). We analyzed the correlations among the psychosocial indicators to avoid redundancy and found that the correlations were small (r < 0.3) (31).
Statistical Analysis
The analysis consisted of three parts. First, the frequencies of thrivers, nonthrivers, deceased, and institutionalized participants were estimated. Second, minimally adjusted multinomial logistic regression models were constructed to examine differences in the independent variables among groups controlling only for potential confounding effects of age and sex. Third, fully adjusted multinomial logistic models were developed to examine differences in the independent variables among the groups controlling simultaneously for all independent variables. The Wald F statistic was used to assess the overall model goodness of fit (32). Analyses were conducted using SUDAAN statistical software (33) that uses balanced repeated replication (bootstrapping method) to adjust for initial nonresponse and the complex sampling design of the NPHS. Bootstrap weights provided by Statistics Canada were used.
Results
Half (50.8%) of all study participants had a baseline HUI3 score ≥ 0.89. Of the 2432 participants, 190 (8%) were classified as thrivers, 1076 (47%) were classified as nonthrivers, 893 (36%) died, and 273 (9%) were institutionalized during the decade-long study. Figure 1 presents the mean HUI3 scores and confidence intervals for the four groups at each cycle.
Figure 1.
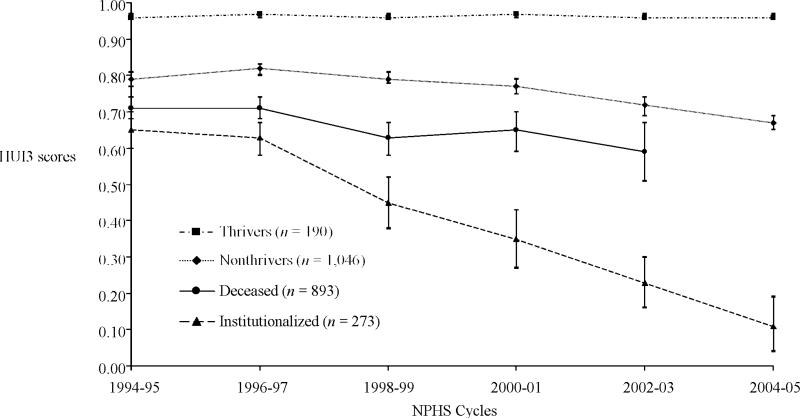
Mean Health Utilities Index Mark 3 (HUI3) scores, by Canadian National Population Health Survey cycles for thrivers, nonthrivers, deceased, and institutionalized participants 65–85 years old at baseline. Confidence intervals are 95%.
Demographic data show (Table 1) that the thrivers were more likely to have completed high school and to have higher household income than the other participants. At the baseline, the thrivers were, on average, 6 years younger than the institutionalized participants, 4 years younger than participants who later died, and a year younger than the nonthrivers (all statistically significant differences). Regarding psychosocial characteristics, the thrivers scored lower on the psychological distress measure and higher on sense of coherence, self-esteem, and mastery than the other three groups. They scored higher than the decedents on social involvement in associations or voluntary organizations. An analysis of behavioral characteristics showed that (after adjusting for age and sex) never having smoked and using alcohol in moderation were significantly more common among the thrivers than among the comparison groups. There were no significant differences among the groups in the prevalence of normal BMI. Not surprisingly, the number of life-threatening and other chronic conditions, level of functional limitations, and use of medications were significantly lower and self-assessed health status was higher among the thrivers than among the comparison groups.
Table 1.
Characteristics of Thrivers, Nonthrivers, Institutionalized, and Deceased NPHS Participants Aged 65–85 Years at Baseline
| Baseline Characteristics*‡ | Thrivers*† (N = 190) | Nonthrivers‡ (N = 1076) | p § | Institutionalized (N = 273) | p ∥ | Deceased (N = 893) | p # |
|---|---|---|---|---|---|---|---|
| Sociodemographic | |||||||
| Age in years, M (SE) | 70 (0.3) | 71 (0.2) | <.01 | 76 (0.4) | <.001 | 74 (0.3) | <.001 |
| Female, % (n) | 55.6 (115) | 62.3 (690) | .27 | 69.7 (202) | .16 | 45.3 (441) | <.01 |
| Married, % (n) | 65.1 (106) | 62.4 (541) | .78 | 53.2 (97) | .54 | 57.8 (415) | .48 |
| ≥ High school, % (n) | 65.0 (120) | 48.6 (486) | <.01 | 40.6 (109) | <.001 | 40.0 (332) | <.001 |
| Household income¶, % (n) | |||||||
| <$15,000 (reference category) | 12.9 (31) | 22.5 (321) | 36.0 (123) | 26.8 (304) | |||
| $15,000–$29,999 | 35.9 (76) | 44.4 (429) | .32 | 40.9 (97) | .08 | 45.2 (368) | .15 |
| >$29,999 | 51.2 (75) | 33.1 (265) | <.01 | 23.1 (42) | <.001 | 28.0 (178) | <.001 |
| Psychosocial factors | |||||||
| Perceived social support, range: 0–4, M (SE) | 3.7 (0.07) | 3.6 (0.03) | .58 | 3.6 (0.1) | .28 | 3.6 (0.04) | .44 |
| Social involvement, range: 0–8, M (SE) | 3.7 (0.3) | 3.7 (0.1) | .84 | 3.6 (0.2) | .46 | 2.9 (0.1) | <.01 |
| Sense of coherence, range: 0–78, M (SE) | 68.7 (0.7) | 63.0 (0.5) | <.001 | 61.7 (1.2) | <.001 | 62.3 (0.5) | <.001 |
| Mastery, range: 0–28, M (SE) | 21.0 (0.4) | 19.0 (0.2) | <.001 | 18.1 (0.4) | <.001 | 18.4 (0.2) | <.001 |
| Self-esteem, range: 0–24, M (SE) | 21.3 (0.2) | 20.0 (0.1) | <.001 | 19.4 (0.2) | <.001 | 19.7 (0.1) | <.001 |
| Psychological distress (K6), range: 0–24, M (SE) | 1.1 (0.1) | 2.6 (0.1) | <.001 | 3.7 (0.4) | <.001 | 3.3 (0.2) | <.001 |
| Behavioral factors | |||||||
| Never smoked, % (n) | 51.3 (99) | 43.6 (453) | <.05 | 47.7 (139) | <.01 | 28.1 (261) | <.001 |
| Moderate alcohol use, % (n) | 47.5 (79) | 28.5 (270) | <.001 | 15.5 (37) | <.001 | 24.3 (201) | <.001 |
| Physically active, % (n) | 64.7 (122) | 55.4 (543) | .13 | 38.4 (97) | <.01 | 44.1 (326) | <.001 |
| Normal weight (BMI = 18.5–24.9 kg/m2), % (n) | 48.7 (86) | 42.2 (425) | .14 | 47.2 (127) | .17 | 50.0 (391) | .53 |
| Health status | |||||||
| Absence of life-threatening illness, % (n) | 70.7 (133) | 54.4 (591) | <.01 | 47.5 (132) | <.01 | 42.9 (385) | <.001 |
| Absence of chronic illness, % (n) | 60.0 (112) | 31.3 (331) | <.001 | 28.1 (74) | <.001 | 33.3 (267) | <.001 |
| Functional limitations, range: 0–6, M (SE) | 0.1 (0.02) | 0.4 (0.03) | <.01 | 1.1 (0.1) | <.001 | 1.0 (0.08) | <.001 |
| Self-rated health, range: 0–4, M (SE) | 3.1 (0.07) | 2.3 (0.04) | <.001 | 1.9 (0.1) | <.001 | 1.9 (0.05) | <.001 |
| Number of medications used, M (SE) | 1.5 (0.1) | 2.1 (0.07) | <.001 | 2.1 (0.1) | <.01 | 2.5 (0.1) | <.001 |
Notes: Percentages and means (M) are weighted, numbers are presented as unweighted figures, and statistical testing is adjusted for age and sex using multinomial regression.
All variables were measured at cycle 1 (1994–1995).
Thriving health is defined as having a Health Utilities Index Mark 3 (HUI3) score between 0.89 and 1.00 at each cycle.
Any other health trends excluding deceased and institutionalized.
Nonthrivers vs thrivers.
Institutionalized vs thrivers.
Based on 1–2 persons living in the household in Canadian dollars.
Deceased vs thrivers.
NPHS = Canadian National Population Health Survey; SE = standard error; K6 = Kessler 6-item nonspecific psychological distress scale; BMI = body mass index.
Table 2 shows the fully adjusted multinomial logistic regression analyses. After adjusting for all other variables in the model, the thrivers were more likely to be younger, female, married, nonsmokers, and moderate alcohol users who had lower psychological distress and higher self-rated health than the three comparison groups. Compared to the institutionalized and nonthrivers, higher income was associated with thriving. Thrivers were less likely to have functional limitations than were participants who later died, and were less likely to have chronic illness than were the institutionalized participants and nonthrivers. To further assess the robustness of the results, a supplementary analysis, restricted to all participants with a baseline HUI3 score ≥ 0.89, was conducted to compare those who maintained a score of at least 0.89 over 10 years to those who did not. The results from a logistic regression revealed that younger age (odd ratio [OR] 0.88; 95% confidence interval [CI], 0.83–0.93), higher income (OR = 2.31; 95% CI, 1.07–5.01), never-smoking status (OR = 2.56; 95% CI, 1.51–4.35), moderate alcohol use (OR = 2.17; 95% CI, 1.23–3.8), and absence of chronic illness (OR = 1.81; 95% CI, 1.05–3.12) were associated with thriving. These findings parallel the earlier results.
Table 2.
Estimated Odd Ratios (OR) and 95% Confidence Intervals (CI) From a Multinomial Logistic Regression of Thriving Versus Nonthriving, Having Been Institutionalized, or Dying, NPHS 1994–1995 to 2004–2005
| Baseline Characteristics* | Thrivers vs Nonthrivers OR (95% CI) | Thrivers vs Institutionalized OR (95% CI) | Thrivers vs Deceased OR (95% CI) |
|---|---|---|---|
| Sociodemographic | |||
| Age in years | 0.92 (0.87–0.97)† | 0.74 (0.69–0.79)‡ | 0.80 (0.75–0.85)‡ |
| Female | 0.95 (0.57–1.61) | 0.82 (0.39–1.75) | 2.04 (1.10–3.79)§ |
| Not married | 0.56 (0.32–0.98)§ | 0.50 (0.25–1.00) | 0.74 (0.40–1.35) |
| ≥ High school | 1.31 (0.76–2.26) | 1.37 (0.71–2.66) | 1.70 (0.95–3.06) |
| Household income | |||
| <$15,000 (reference category) | |||
| $15,000–$29,999 | 1.41 (0.68–2.90) | 1.90 (0.76–4.78) | 1.36 (0.60–3.05) |
| >$29,999 | 2.17 (1.01–4.67)§ | 2.86 (1.08–7.69)§ | 1.58 (0.66–3.75) |
| Psychosocial factors | |||
| Perceived social support | 0.99 (0.71–1.38) | 1.10 (0.76–1.59) | 0.93 (0.64–1.36) |
| Social involvement. | 1.00 (0.91–1.09) | 0.98 (0.88–1.09) | 1.07 (0.97–1.19) |
| Sense of coherence | 1.04 (1.01–1.07)§ | 1.03 (0.99–1.07) | 1.03 (1.00–1.06) |
| Mastery | 0.96 (0.89–1.03) | 0.98 (0.89–1.08) | 0.96 (0.89–1.03) |
| Self-esteem | 1.09 (0.98–1.20) | 1.11 (0.98–1.25) | 1.10 (0.99–1.22) |
| Psychological distress (K6) | 0.87 (0.77–0.97)§ | 0.78 (0.67–0.91)† | 0.81 (0.72–0.91)‡ |
| Behavioral factors | |||
| Never smoked | 1.89 (1.10–3.23)§ | 3.03 (1.49–6.25)† | 4.35 (2.44–7.69)‡ |
| Moderate alcohol use | 1.78 (1.07–2.95)§ | 2.87 (1.30–6.34)† | 2.22 (1.25–3.95)† |
| Physically active | 1.08 (0.62–1.88) | 1.46 (0.77–2.78) | 1.30 (0.72–2.32) |
| Normal weight (BMI = 18.5–24.9 kg/m2) | 1.15 (0.67–1.97) | 1.07 (0.56–2.06) | 0.89 (0.49–1.61) |
| Health status | |||
| Absence of life-threatening illness | 1.59 (0.88–2.88) | 2.46 (1.21–4.99)§ | 1.89 (0.97–3.69) |
| Absence of chronic illness | 2.24 (1.31–3.81)† | 2.09 (1.03–4.22)§ | 1.74 (0.95–3.16) |
| Functional limitations | 0.50 (0.24–1.07) | 0.46 (0.21–1.00) | 0.40 (0.19–0.86)§ |
| Self-rated health | 1.53 (1.12–2.10)† | 1.65 (1.14–2.39)† | 1.76 (1.24–2.50)† |
| Number of medications used | 1.07 (0.87–1.33) | 1.23 (0.95–1.59) | 1.03 (0.82–1.30) |
Notes: All variables were entered simultaneously into the multinomial logistic model. Model fit statistic: Wald F(63) = 4.63, p < .001. ORs > 1 denote benefit for categorical variables and risk for continuous variables.
All variables were measured at cycle 1 (1994–1995).
p < .01.
p < .001.
p < .05.
NPHS = Canadian National Population Health Survey; K6 = Kessler 6-item nonspecific psychological distress scale; BMI = body mass index.
Discussion
The purpose of this study was to describe the prevalence and correlates of 10 years of exceptionally good health (thriving) in an aging population. A major strength of this research was the use of a repeated, continuous, and multidimensional health status and health-related quality-of-life measure that has substantial evidence of cross-sectional and longitudinal construct validity in large, prospective epidemiologic studies. Although most quantitative studies on successful aging were designed to examine the development of pathology in later life (4), this analysis focused on the absence of functional limitations and the maintenance of positive health. For example, to be classified as a thriver, respondents reported a level 1 (“happy and interested in life”) or level 2 (“somewhat happy”) on the HUI3 emotion component.
Eight percent of Canadian older adults were classified as thrivers over the full 10-year period; this rate falls at the lower end of the successful aging prevalence range (0.4%–95%) among the studies reviewed by Depp and Jeste (4). In contrast to other studies that defined healthy or successful aging as the absence of physical disability or limitations on physical performance and (to a lesser extent) the absence of cognitive impairment (4), this study relied on a multidimensional measure of health status. It is also important to appreciate the prospective nature of the study in which thrivers were required not merely to attain old age in exceptional health, but to maintain their health throughout the 10 years of follow-up.
In line with several previous studies [e.g., (34,35)], this analysis found that thriving was related to social and behavioral factors. Unlike other studies [e.g., (36,37)], which suggested that socioeconomic factors were not consistently related to successful aging, the fully adjusted models in this study generally showed an association between income and thriving in older age. There is abundant evidence that education, income, and other socioeconomic characteristics are important determinants of health. Given that our approach was to compare persons who thrive and do not thrive according to a number of important determinants of health variables, it was important to include socioeconomic factors in the comparisons. We recognize that there are other credible studies that have not found income and education to be systematically related to successful aging.
The results regarding health behaviors are highly relevant to public health practice because they reflect modifiable risk factors. For example, participants who never smoked and who used alcohol in moderation were more likely to thrive in older adulthood than were those with other health behaviors. These findings suggest that behavioral interventions (perhaps started early in life) may be key to sustaining exceptionally good health in an aging population (22). It is interesting that physical activity and BMI were not associated with thriving in the fully adjusted models.
Although healthy activities hold promise for promoting population health, interventions that focus exclusively on risk behaviors have limited potential for reducing the socioeconomic differentials noted in this study. To paraphrase Lantz and colleagues (38), the problem of lifestyle and health is not just one of inadequate education or income, and the problem of socioeconomic differentials in health is not just a problem of lifestyle choices.
It was indeed surprising to find that the relationship between perceived social support and maintenance of exceptional health was weak and not statistically significant. Gender-specific analyses yielded the same pattern of nonsignificant findings (data not shown). Many studies have shown that a low initial level of perceived social support is associated with morbidity and a decline in functional status in older adulthood (1). However, certain forms of social support increase when one becomes ill, and our results may reflect social connections among participants who were already in poor health at baseline. Also noteworthy was the relationship between the measures of psychological resources and maintenance of exceptionally good heath. Although not unexpected, these findings suggest that elderly persons with a healthier outlook on life (i.e., less psychological distress and greater sense of coherence) were more likely to be classified as thrivers after adjusting for other confounders. Fostering the development of psychosocial hardiness among elderly persons may yield important population health benefits.
Several limitations should be kept in mind when considering the findings of this study. First, the criterion used to define the HUI3 cut point for classifying a participant as having thrived is demanding and thus may have identified only the healthiest of the healthy. However, the focus of the project was, by definition, on maintenance of “exceptional” health. Second, a proportion (albeit small) of participants in the longitudinal cohort was lost to follow-up. Third, a reliance on self-reported measures may lead to associations that are due, in part, to shared methods variance. However, death and institutionalization were known from sources other than the participants. Fourth, the participants could have been misclassified owing to a lack of information about their health status prior to baseline (left censorship). For example, an 84-year-old participant who was in robust health at baseline who died prior to the first follow-up was classified as deceased. This participant could have been in exceptional health (“thriving”) for decades prior to death or may have been temporarily in remission from a terminal illness at the baseline. The point here is that the project focused not on attaining excellent health at a given time in old age, but on maintaining exceptional health while under observation during 10 years of follow-up. Fifth, we were unable to compare different age groups (75–84, 85+) because of small cell sizes. Thus, we cannot assess the degree to which the factors associated with successful aging remain stable or vary with increasing age.
Conclusion
Several protective factors (including behaviors established much earlier in life) may sustain exceptionally good health through old age. It is now recognized in the field of population health that well-being in late life cannot be adequately understood without the appreciation of health-determining influences across the life span (39). As Berkman and Glymour [(40), p. 108] noted, “The trajectory of health or ill health that elderly [people] undergo does not begin at age 65: experiences accumulated throughout life set the stage for well-being in old age.” Future research should examine the experiences of these cohorts before they entered older adulthood.
Acknowledgments
This study was supported by grant AG027129 from the National Institute on Aging.
Appendix
Appendix.
Multiattribute Health Status Classification System: Health Utilities Index Mark 3
| Attribute | Level Description |
|---|---|
| Vision | 1. Able to see well enough to read ordinary newsprint and recognize a friend on the other side of the street, without glasses or contact lenses |
| 2. Able to see well enough to read ordinary newsprint and recognize a friend on the other side of the street, but with glasses | |
| 3. Able to read ordinary newsprint with or without glasses but unable to recognize a friend on the other side of the street, even with glasses | |
| 4. Able to recognize a friend on the other side of the street with or without glasses but unable to read ordinary newsprint, even with glasses | |
| 5. Unable to read ordinary newsprint and unable to recognize a friend on the other side of the street, even with glasses | |
| 6. Unable to see at all | |
| Hearing | 1. Able to hear what is said in a group conversation with at least three other people, without a hearing aid |
| 2. Able to hear what is said in a conversation with one other person in a quiet room without a hearing aid, but requires a hearing aid to hear what is said in a group conversation with at least three other people | |
| 3. Able to hear what is said in a conversation with one other person in a quiet room with a hearing aid, and able to hear what is said in a group conversation with at least three other people, with a hearing aid | |
| 4. Able to hear what is said in a conversation with one other person in a quiet room, without a hearing aid, but unable to hear what is said in a group conversation with at least three other people, even with a hearing aid | |
| 5. Able to hear what is said in a conversation with one other person in a quiet room with a hearing aid, but unable to hear what is said in a group conversation with at least three other people, even with a hearing aid | |
| 6. Unable to hear at all | |
| Speech | 1. Able to be understood completely when speaking with strangers or friends |
| 2. Able to be understood partially when speaking with strangers but able to be understood completely when speaking with people who know me well | |
| 3. Able to be understood partially when speaking with strangers or people who know me well | |
| 4. Unable to be understood when speaking with strangers but able to be understood partially by people who know me well | |
| 5. Unable to be understood when speaking to other people (or unable to speak at all) | |
| Ambulation | 1. Able to walk around the neighborhood without difficulty, and without walking equipment |
| 2. Able to walk around the neighborhood with difficulty; but does not require walking equipment or the help of another person | |
| 3. Able to walk around the neighborhood with walking equipment, but without the help of another person | |
| 4. Able to walk only short distances with walking equipment, and requires a wheelchair to get around the neighborhood | |
| 5. Unable to walk alone, even with walking equipment. Able to walk short distances with the help of another person, and requires a wheelchair to get around the neighborhood | |
| 6. Cannot walk at all | |
| Dexterity | 1. Full use of two hands and ten fingers |
| 2. Limitations in the use of hands or fingers, but does not require special tools or help of another person | |
| 3. Limitations in the use of hands or fingers, is independent with use of special tools (does not require the help of another person) | |
| 4. Limitations in the use of hands or fingers, requires the help of another person for some tasks (not independent even with use of special tools) | |
| 5. Limitations in use of hands or fingers, requires the help of another person for most tasks (not independent even with use of special tools) | |
| 6. Limitations in use of hands or fingers, requires the help of another person for all tasks (not independent even with use of special tools) | |
| Emotion | 1. Happy and interested in life |
| 2. Somewhat happy | |
| 3. Somewhat unhappy | |
| 4. Very unhappy | |
| 5. So unhappy that life is not worthwhile | |
| Cognition | 1. Able to remember most things, think clearly, and solve day-to-day problems |
| 2. Able to remember most things, but have a little difficulty when trying to think and solve day-to-day problems | |
| 3. Somewhat forgetful, but able to think clearly and solve day-to-day problems | |
| 4. Somewhat forgetful, and have a little difficulty when trying to think or solve day-to-day problems | |
| 5. Very forgetful, and have great difficulty when trying to think or solve day-to-day problems | |
| 6. Unable to remember anything at all, and unable to think or solve day-to-day problems | |
| Pain | 1. Free of pain and discomfort |
| 2. Mild to moderate pain that prevents no activities | |
| 3. Moderate pain that prevents a few activities | |
| 4. Moderate to severe pain that prevents some activities | |
| 5. Severe pain that prevents most activities |
Source: Feeny et al., 2002 (11).
Footnotes
Conflict of Interest
David Feeny has a proprietary interest in Health Utilities Incorporated (HUInc.), Dundas, Ontario, Canada. HUInc. distributes copyrighted Health Utilities Index (HUI) materials and provides methodological advice on the use of HUI. None of the other authors have any interests that might be interpreted as influencing the research.
References
- 1.McMunn A, Breeze E, Goodman A, Nazroo J, Okdfield Z. Social determinants of health in older age. In: Marmot M, Wilkinson RG, editors. Social Determinants of Health. 2nd Ed. Oxford University Press; New York, NY: 2006. pp. 240–296. [Google Scholar]
- 2.United Nations Population Challenges and Developmental Goals. 2005 Available at www.un.org.
- 3.United Nations The Ageing of the World's Population. 2003 Available at www.un.org.
- 4.Depp CA, Jeste DV. Definitions and predictors of successful aging: a comprehensive review of larger quantitative studies. Am J Geriatr Psychiatry. 2006;14:6–20. doi: 10.1097/01.JGP.0000192501.03069.bc. [DOI] [PubMed] [Google Scholar]
- 5.Bowling A, Dieppe P. What is successful ageing and who should define it? BMJ. 2005;331:1548–1552. doi: 10.1136/bmj.331.7531.1548. [DOI] [PMC free article] [PubMed] [Google Scholar]
- 6.Willcox BJ, He Q, Chen R, et al. Midlife risk factors and healthy survival in men. JAMA. 2006;296:2343–2350. doi: 10.1001/jama.296.19.2343. [DOI] [PubMed] [Google Scholar]
- 7.National Institute on Aging (NIA) Determinants of Aging and Health Across the Life Span: Potential New Insights from Longitudinal Studies. Report of the July 2003 meeting of the NIA Longitudinal Data on Aging Working Group. Available at www.nia.nih.gov.
- 8.Tambay JL, Catlin G. Sample design of the National Population Health Survey—its longitudinal nature. Health Rep. 1995;7:29–38. [PubMed] [Google Scholar]
- 9.Yashin AI, Akushevich IV, Arbeev KG, et al. Insights on aging and exceptional longevity from longitudinal data: novel findings from the Framingham Heart Study. Age Dordr. 2006;28:363–374. doi: 10.1007/s11357-006-9023-7. [DOI] [PMC free article] [PubMed] [Google Scholar]
- 10.Statistics Canada National Population Health Survey. Household Component. [July 4, 2008];Cycle 6 Longitudinal Documentation. Available at http://www.statcan.ca/english/sdds/document/3225_D5_T1_V3_E.pdf.
- 11.Feeny D, Furlong W, Torrance GW, et al. Multiattribute and single-attribute utility functions for the health utilities index mark 3 system. Med Care. 2002;40:113–128. doi: 10.1097/00005650-200202000-00006. [DOI] [PubMed] [Google Scholar]
- 12.Feeny D, Furlong W, Saigal S, Sun J. Comparing directly measured standard gamble scores to HUI2 and HUI3 utility scores: group and individual-level comparisons. Soc Sci Med. 2004;58:799–809. doi: 10.1016/s0277-9536(03)00254-5. [DOI] [PubMed] [Google Scholar]
- 13.Grootendorst P, Feeny DH, Furlong W. Health utilities index mark 3: evidence of construct validity for stroke and arthritis in a population health survey. Med Care. 2000;38:290–299. doi: 10.1097/00005650-200003000-00006. [DOI] [PubMed] [Google Scholar]
- 14.Wilkins K. Predictors of death in seniors. Health Rep. 2006;16:57–67. [PubMed] [Google Scholar]
- 15.Fisk JD, Brown MG, Sketris IS. A comparison of health utility measures for the evaluation of multiple sclerosis treatments. J Neurol Neurosurg Psychiatry. 2005;76:58–63. doi: 10.1136/jnnp.2003.017897. [DOI] [PMC free article] [PubMed] [Google Scholar]
- 16.Jones CA, Feeny D, Eng K. Test-retest reliability of health utilities index scores: evidence from hip fracture. Int J Technol Assess Health Care. 2005;21:393–398. doi: 10.1017/s0266462305050518. [DOI] [PubMed] [Google Scholar]
- 17.Marra CA, Rashidi AA, Guh D, et al. Are indirect utility measures reliable and responsive in rheumatoid arthritis patients? Qual Life Res. 2005;14:1333–1344. doi: 10.1007/s11136-004-6012-0. [DOI] [PubMed] [Google Scholar]
- 18.Dolan P. Modeling valuations for EuroQol health states. Med Care. 1997;35:1095–1108. doi: 10.1097/00005650-199711000-00002. [DOI] [PubMed] [Google Scholar]
- 19.Shaw JW, Johnson JA, Coons SJ. US valuation of the EQ-5D health states: development and testing of the D1 valuation model. Med Care. 2005;43:203–220. doi: 10.1097/00005650-200503000-00003. [DOI] [PubMed] [Google Scholar]
- 20.Evans RG, Stoddart GL. Producing health, consuming health care. Soc Sci Med. 1990;31:1347–1363. doi: 10.1016/0277-9536(90)90074-3. [DOI] [PubMed] [Google Scholar]
- 21.Evans RG, Barer ML, Marmor TR, editors. Why Are Some People Healthy and Others Not? The Determinants of Health of Populations. Aldine De Gruyter; New York, NY: 1994. [Google Scholar]
- 22.Shields M, Martel L. Healthy living among seniors. Health Rep. 2006;16(Suppl):7–20. [PubMed] [Google Scholar]
- 23.Ferraro KF, Farmer MM. Utility of health data from social surveys: is there a cold standard for measuring morbidity? Am Sociol Rev. 1999;64:303–315. [Google Scholar]
- 24.O'Brien Cousins S. Exercise, Aging, and Health: Overcoming Barriers to an Active Old Age. Taylor & Francis; Philadelphia, PA: 1998. [Google Scholar]
- 25.Shields M, Chen J. Health among older adults. Health Rep. 1999;11:47–61. [PubMed] [Google Scholar]
- 26.Kessler RC, Andrews G, Colpe LJ, et al. Short screening scales to monitor population prevalences and trends in nonspecific psychological distress. Psychol Med. 2002;32:959–976. doi: 10.1017/s0033291702006074. [DOI] [PubMed] [Google Scholar]
- 27.Rosenberg M. Society and the Adolescent Self-Image. Princeton University Press; Princeton, NJ: 1965. [Google Scholar]
- 28.Pearlin LI, Liebman M, Menaghan E, Mullan J. The stress process. J Health Soc Behav. 1981;22:337–356. [PubMed] [Google Scholar]
- 29.Antonovsky A. The structure and properties of the sense of coherence scale. Soc Sci Med. 1993;36:725–733. doi: 10.1016/0277-9536(93)90033-z. [DOI] [PubMed] [Google Scholar]
- 30.Berkman LF, Glass T. Social integration, social networks, social support, and health. In: Berkman LF, Kawachi I, editors. Social Epidemiology. Oxford University Press; New York, NY: 2000. pp. 137–173. [Google Scholar]
- 31.Cohen J, Cohen P, West SG, Aiken LS. Applied Multiple Regression/Correlation Analysis in the Behavioral Sciences. 3rd Ed. Erlbaum; Mahwah, NJ: 2003. [Google Scholar]
- 32.Fellegi IP. Approximate test of independence and goodness of fit based on stratified multistage samples. J Am Stat Assoc. 1980;75:261–268. [Google Scholar]
- 33.Research Triangle Institute . SUDAAN Language Manual, Release 9.0. Research Triangle Institute; Research Triangle Park, NC: 2004. [Google Scholar]
- 34.Burke GL, Arnold AM, Bild DE, et al. Factors associated with healthy aging: the Cardiovascular Health Study. J Am Geriatr Soc. 2001;49:254–262. doi: 10.1046/j.1532-5415.2001.4930254.x. [DOI] [PubMed] [Google Scholar]
- 35.Avlund K, Holstein BE, Mortensen EL, Schroll M. Active life in old age. Combining measures of functional ability and social participation. Dan Med Bull. 1999;46:345–349. [PubMed] [Google Scholar]
- 36.Strawbridge WJ, Cohen RD, Shema SJ, Kaplan GA. Successful aging: predictors and associated activities. Am J Epidemiol. 1996;144:135–141. doi: 10.1093/oxfordjournals.aje.a008900. [DOI] [PubMed] [Google Scholar]
- 37.Ford AB, Haug MR, Stange KC, Gaines AD, Noelker LS, Jones PK. Sustained personal autonomy: a measure of successful aging. J Aging Health. 2000;12:470–489. doi: 10.1177/089826430001200402. [DOI] [PubMed] [Google Scholar]
- 38.Lantz PM, House JS, Lekowski JM, Williams DR, Mero RP, Chen J. Socioeconomic factors, health behaviors, and mortality. JAMA. 1998;279:1703–1708. doi: 10.1001/jama.279.21.1703. [DOI] [PubMed] [Google Scholar]
- 39.Hertzman C, Power C. A life course approach to health and human development. In: Heyman J, Hertzman C, Barer ML, Evans RG, editors. Healthier Societies: From Analysis to Action. Oxford University Press; New York, NY: 2006. pp. 83–106. [Google Scholar]
- 40.Berkman LF, Glymour MM. How society shapes life spans: the centrality of variability. Daedalus. 2006:105–114. Winter. [Google Scholar]