

Abstract
Semi-transparent porous silicon substrates have been developed for pairing nanostructure-initiator mass spectrometry (NIMS) imaging with traditional optical based microscopy techniques. Substrates were optimized to generate the largest NIMS signal while maintaining sufficient transparency to allow visible light to pass through for optical microscopy. Using these substrates, both phase-contrast and NIMS images of phospholipids from a scratch-wounded cell monolayer were obtained. NIMS images were generated using a spatial resolution of 14 μm. Coupled with further improvements in spatial resolution, this approach may allow for the localization of intact biological molecules within cells without the need for labeling.
Keywords: Mass spectrometry, Nanotechnology, Imaging mass spectrometry, Nanostructure-initiator mass spectrometry (NIMS), optical microscopy
Mass spectrometry requires that analytes be converted to gas-phase ions and the ionization process is integral to the quality of the observed spectrum. Low-energy (soft) ionization processes such as matrix-assisted laser desorption/ionization (MALDI) and electrospray ionization (ESI) are capable of converting large proteins into intact ions.1-4 In traditional MALDI, solid UV-absorbing matrix molecules are applied to the biological sample which is then irradiated by a UV laser, producing predominantly singly-charged ions from both the matrix and the analyte. MALDI is less amenable to automated, on-line analysis than ESI, but is generally simpler to perform and can be done directly on a solid-phase sample with minimal or no solvents.5-7 This ensures that molecules retain their native locations in the biological sample during analysis.
When molecular diffusion within the sample matrix is minimized, molecules can be both characterized by mass and localized in two-dimensional space. In this spatially-resolved approach, known as MS imaging, complete mass spectra are obtained for discrete pixel locations over the entire biological sample.8-10 Two-dimensional images of each m/z value are then generated. Therefore, MS imaging can potentially generate spatially-relevant profiles of thousands of molecules in tissues and cells.
A number of ionization methods may be used to perform MS imaging, including but not limited to secondary ion mass spectrometry (SIMS),11-13 MALDI,14-15 laser ablation – inductively coupled plasma mass spectrometry (LA-ICPMS),16-17 and laser ablation – ESI (LAESI).18-19 Traditionally, SIMS has achieved the best spatial resolution (sub-μm), but its ability to ionize intact biological molecules has been limited. However, recent cluster-based ion beams such as C60+ have improved the usable mass range to approximately 1 kDa using low-μm spatial resolution.20 High-resolution MALDI imaging approaches such as scanning-microprobe MALDI (SMALDI) and ion microscopy make use of unique optics and instrumentation to image with spatial resolutions less than 10 μm.21-24 At this resolution, MALDI matrix application and the resulting co-crystallization with sample plays a significant role in the resulting quality of the images.25 LA-ICPMS is capable of quantitative imaging, but is essentially limited to elemental analysis. The primary advantage of LAESI is that desorption occurs at atmospheric pressure, so little to no sample preparation is needed.26 Nevertheless, LAESI utilizes IR lasers which have cannot be focused as narrowly as UV lasers used in MALDI or LA-ICPMS due to diffraction. While these methods differ in terms of strengths and limitations, a common trend has emerged: as imaging spatial resolution increases, sensitivity often decreases because of the fewer analytes in a given region. A goal of the biological MS imaging community is to circumvent these limitations in order to generate images with sub-cellular spatial resolution, high sensitivity, and soft ionization.
Another ionization method, nanostructure-initiator mass spectrometry (NIMS), has been introduced recently and may lead to sub-cellular spatial resolution, high sensitivity and soft ionization of biomolecules.27-28 NIMS methods utilize energy-absorbing (laser- or ion-beam) nanoporous silicon substrates coated with viscous liquid initiators; these initiators help transfer energy to sample molecules but rarely ionize, generating mass spectra with very low background noise. This reduction in chemical noise leads to impressive sensitivity, especially in the low m/z region.27,29 Several factors likely contribute to this sensitivity, including efficient desorption from porous silicon (pSi) and initiators which can extract and pre-concentrate biological molecules.30 Although it is more common to use hydrophobic initiators, hydrophilic initiators have been shown to extract and ionize polar molecules as well.31 Moreover, pores ~10 nm in diameter limit lateral diffusion of analyte molecules and ensure that MS images obtained using NIMS are spatially accurate.32 Current substrates, however, are formed on non-transparent Si wafers which do not allow for the visualization of cells by microscopy. Here, we introduce semi-transparent NIMS films for both MS imaging and optical microscopy.
Experimental Section
Chemicals
Angiotensin II and ethanol were obtained from Sigma-Aldrich USA. Hydrofluoric acid (48-51% in water) was purchased from Acros Organics. Hydrogen peroxide (30%) and concentrated sulfuric acid were from Fisher Scientific. Bovine insulin (5 pmol/μL stock) was obtained from Waters Corporation and bis(heptadecafluoro-1,1,2,2-tetrahydrodecyl)tetramethyldisiloxane (BisF17) was obtained from Gelest. Transparent indium tin oxide (ITO) glass slides were obtained from Delta Technologies.
Fabrication and preparation of NIMS films
P-type crystalline silicon wafers (Boron-doped, <100> orientation, 0.01 Ω resistivity) were cut into squares using a diamond tip pen, were rinsed with deionized water, and then were soaked in piranha (2:1 concentrated H2SO4 : 30% H2O2) solution for 30 minutes. Chips were rinsed thoroughly with deionized water and dried with nitrogen. Porous silicon was then formed using a 25% hydrofluoric acid solution (1:1 50% HF and ethanol) in a custom Teflon etching chamber with an etching area of 2 cm2.
In order to form semi-transparent films, a two-step etching process was used. First, a constant current density was applied to etch pores perpendicular to the surface. For this step, both etching times and applied current densities were varied in order to produce pSi films with different porosities and thicknesses and to determine how the parameters affect film transparency and NIMS performance (see Table 1). Second, a higher current density was applied in a pulsed manner to break off the pSi films. Because of the high current density, a region of effectively 100% porosity is formed at the pSi – Si wafer interface, resulting in film detachment.33 All films were removed using the following procedure. A current density of 250 mA/cm2 was applied for 1.7 seconds and followed by 1.7 seconds of rest before the next current density pulse was applied. This was performed 2× over a time of 6.8 seconds. Then a current density of 210 mA/cm2 was applied for 1.7 seconds followed by 6.0 seconds of rest. This was repeated 10× over a time of 77.0 seconds. Films were rinsed with ethanol and transferred from the silicon wafer to ITO-coated slides using tweezers. Films were manually attached to ITO-coated glass in a dish of ethanol. After attachment, films were oven dried at 80°C for 5 minutes to remove the trapped solvent.
Table 1. Relating etching conditions with film parameters.
Film thicknesses and pore diameters were measured with SEM. Etching times and current densities correspond to non-pulsed etching which generated the porous silicon layers. All films were removed from the silicon wafer using the same procedure.
| Film # |
Etch Time (s) |
Current Density (mA/cm2) |
Pore Depth (μm) |
Avg. Pore Diameter (nm) |
|---|---|---|---|---|
| 1 | 300 | 24 | 7.8 | 7 ± 3 (n = 101) |
| 2 | 300 | 36 | 9.8 | 12 ± 3 (n = 92) |
| 3 | 300 | 48 | 10.7 | 18 ± 5 (n = 85) |
| 4 | 450 | 24 | 11.9 | 9 ± 5 (n = 100) |
| 5 | 450 | 36 | 14.9 | 13 ± 5 (n = 80) |
| 6 | 450 | 48 | 16.1 | 17 ± 8 (n = 56) |
| 7 | 600 | 24 | 12.8 | 7 ± 4 (n = 72) |
| 8 | 600 | 36 | 16.9 | 11 ± 4 (n = 125) |
| 9 | 600 | 48 | 18.7 | 14 ± 7 (n = 195) |
Before the addition of analytes for MS analysis, bare pSi films were briefly rinsed with 1% HNO3, deionized water and dried. Then, 30 μL of BisF17 initiator was spotted onto each pSi film, which was incubated for 45 minutes and then dried (N2 gas and low heat, repeated 3x). It was important to use a gentle stream of N2 when drying, or else films could crack or separate from the ITO-coated glass slides. NIMS films not used for cell imaging were stored at room temperature.
SEM imaging of porous silicon
Average pore diameters and film thicknesses were measured from SEM images using ImageJ software (NIH, http://rsbweb.nih.gov/ij/). Images were obtained on either a Hitachi S-4200 or a Raith eLiNE microscope, both of which are in the Vanderbilt Institute of Nanoscale Science and Engineering (VINSE) core laboratory. Small pieces of pSi were broken off from larger films and attached to conductive carbon tape for SEM surface imaging. Film thicknesses were determined by etching layers into a silicon wafer (each layer corresponding to the etching conditions of an individual film), cleaving the wafer in half and performing cross-sectional SEM imaging.
NIMS optimization and analysis
Optical density measurements were performed on a Cary UV-vis spectrometer. MS optimization experiments were performed on a Voyager-DE-STR mass spectrometer (Applied Biosystems) in both linear and reflectron TOF modes. The linear mode settings were as follows: 100 ns delayed extraction, 95% grid, and 50 shots per spectrum. Reflectron mode was used with the following settings: 140 ns delay, 70% grid, and 40 shots per spectrum. A nitrogen gas laser (337 nm) was used in all non-imaging experiments. A stock solution composed of 250 fmol/μL angiotensin II and 500 fmol/μL bovine insulin was prepared and used for MS optimization studies. On each film, three 1.0 μL spots were placed, and three spectra were taken for each spot (10-7000 m/z range). Ion signal intensities were determined using the centroid function in Data Explorer 4.3 software (Applied Biosystems) and averaged. Error bars correspond to one standard deviation.
Cell preparation
HT1080 cells were maintained in Dulbeco’s Modified Eagles Medium or DMEM (Invitrogen) with 10% fetal bovine serum (FBS) (HyClone) and 1% penicillin/streptomycin (Invitrogen). Cells were then trypsinized with 0.25% Trypsin-EDTA (Invitrogen) and plated on the NIMS film. Cells were allowed to become confluent, and a scratch wound was made using a 20 μL pipet tip. Three hours post wounding, the growth media was removed and the sample was washed twice with dilute PBS. Excess PBS was aspirated, and the sample was frozen at −80 °C until analysis.
NIMS imaging
Images were acquired using an external Nd:YAG laser (frequency tripled, 355 nm), a digital micromirror array,34-35 a Voyager DE-STR mass spectrometer (in linear mode) and MALDI MS Imaging Tool software (Novartis, maldi-msi.org). Images were obtained using 14 μm raster steps in MALDI MS Imaging Tool and processed using BioMap software (Novartis, maldi-msi.org) without normalization. Single-pixel mass spectra were baseline corrected and processed using Data Explorer. Post-source decay (PSD) experiments were performed using the Voyager DE-STR mass spectrometer using high laser energy and the timed ion selector (TIS). Lipids from the cell monolayer were extracted using 4:1 MeOH:H2O and placed on a clean NIMS film for PSD analysis.
Optical microscopy
Phase-contrast microscopy was performed on a Leica DMIL microscope with a NPLAN 5× phase 0 (NA 0.12) objective lens.
Safety
Piranha solution (2:1 concentrated H2SO4: 30% H2O2) is a strong oxidant. All work with piranha solutions should be performed in a fume hood using the proper protective equipment, glass beakers and stainless steel tweezers. Let piranha waste cool for at least 24 hours before storage or neutralization.
Hydrofluoric acid (HF) is extremely toxic. In addition to reading the MSDS report for HF, please consult reference 36. All HF chemistry should be performed in a fume hood with proper protective equipment, using Teflon or plastic containers and plastic tools.
Results and Discussion
NIMS film optimization
The purpose of our optimization experiments was to determine the best film parameters (pore size and film thickness) for both NIMS and optical microscopy. We first measured the pore diameters and film thicknesses (i.e. pore depths) via SEM (Figure 1A-C) because multiple substrates were prepared under different anodic etching conditions (Table 1). For all substrates, average pore diameters (< 20 nm) were three orders of magnitude less than pore depths (< 20 μm). For constant etching times, increasing the applied current density increased the etching rate and, thus, the resulting film thickness (Table 1). When current density was held constant, longer etching times also produced thicker films (Table 1). The etching time did not have a significant effect on pore diameter (Table 1). In summary, we observed that both current density and etching time affected the film thickness, but current density affected the pore size more than etching time. These trends are consistent with prior studies on porous silicon.37
Figure 1.
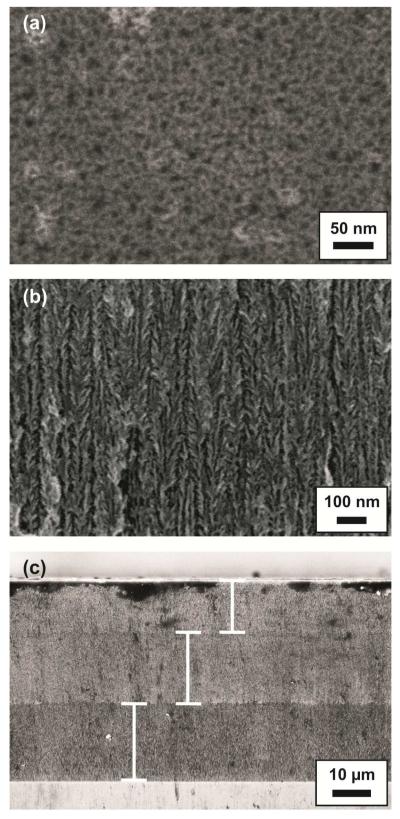
Characterization of semi-transparent substrates by SEM. (a) Top view. Pores are approximately 10 nm in diameter. (b) Cross sectional view. (c) Three pSi layers were etched on top of one another, and film thicknesses were measured. All film thickness values are presented in Table 1.
The film thickness plays a significant role in the transparency of the film. The pore size does not affect film transparency; the pores are small compared to visible wavelengths and hence are not expected to cause scattering losses that would reduce transparency. Silicon absorbs light of energy below the bandgap (1.1 eV), which includes UV and visible wavelengths. Optical density measurements were used to quantify the relationship between film thicknesses and light absorption (Figure 2A). UV and visible light absorption increased with increasing film thickness. Higher-energy visible wavelengths and UV light were absorbed strongly, while lower-energy visible wavelengths were absorbed to a lesser degree. In order to determine a threshold for evaluating transparency, percent transmission values at 700 nm were compared. Films less than 15 μm in thickness transmitted >15% of 700 nm light and were considered sufficiently transparent. Films more than 15 μm in thickness allowed <15% of 700 nm through and were considered insufficiently transparent. A qualitative evaluation of transparency was also performed, and correlated well with our spectrophotometry studies (Figure S-1).
Figure 2.
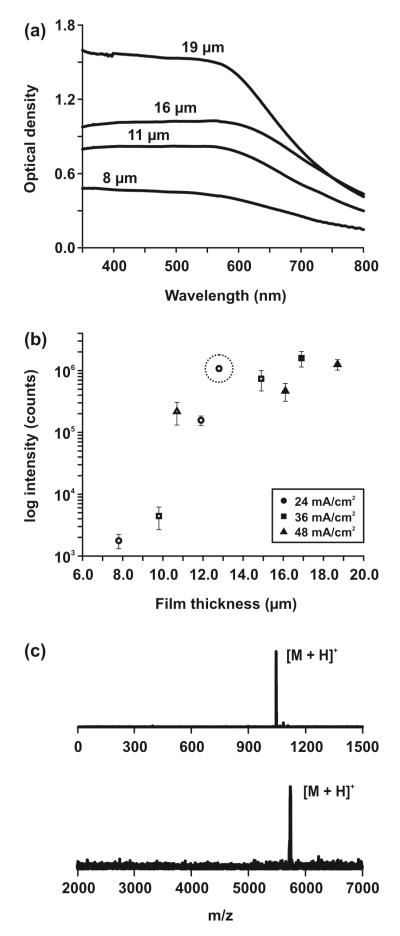
Optimization of semi-transparent substrates. (a) Optical density measurements of substrates with thicknesses of 8, 11, 16, and 19 μm. (b) Relating film thickness to NIMS performance. Intensities are the logarithm of peak areas generated from 250 femtomoles angiotensin II peptide. Different shapes correspond to different etching current densities from Table 1. Open shapes correspond to substrates which were sufficiently transparent (>15% transmission at 700 nm), while dark shapes correspond to substrates which were not sufficiently transparent for microscopy. The optimized film thickness (13 μm) for NIMS and optical microscopy is circled. (c) Characteristic mass spectra from optimized NIMS substrate. (top) 250 femtomoles angiotensin II peptide (DRVYIPHF, [M+H]+ = 1046.5 Da); (bottom) 500 femtomoles bovine insulin ([M+H]+ = 5734 Da).
NIMS performance was plotted against film thickness (Figure 2B). Films less than 15 μm are shown as open shapes in Figure 2B, and films above 15 μm are shown as dark shapes. Angiotensin II peptide ([M+H]+ = 1046.5 Da, 250 femtomoles in a ~100 μm spot) was the biomolecular standard which was desorbed from the surface and ionized. Between 8-13 μm, signal from our substrates increased with film thickness. Similarly, Woo et. al. reported signal to noise increases using longer etching times (hence, thicker pSi) for standard NIMS.29 However, signal intensities began to level off above 13 μm due to detector saturation. Therefore, for optimum NIMS performance and transparency, we determined that semi-transparent films should have thicknesses of 13 μm.
Like standard NIMS wafers, our optimized films generated very low chemical noise in the low m/z region (Figure 2C, top). Several low-mass background peaks were observed rarely, however, and more pronounced when a spot without analyte was laser-irradiated (Figure S-2). These molecules have been suggested to be alkylammonium salts used in the silicon fabrication process,38 and were minimized by a quick 1% HNO3 rinse before the addition of initiator. Although NIMS films produced very clean mass spectra, sensitivity decreased when analyzing larger molecules, resulting in a sensitive (femtomole) mass dynamic range of approximately 6 kDa (Figure 2C, bottom). Substrates were stable at room temperature for several months without a significant loss in performance (Figure S-3).
Cell imaging
Cell signaling and collective cell migration play vital roles in many biological processes, including cancer.39 Therefore, we look to apply this imaging platform to visualize molecular distributions at the leading edge of migrating cells. As a proof-of-concept experiment, we imaged a scratch wounded HT1080 fibrosarcoma cell monolayer. A phase-contrast microscope image was obtained from the wounded cell monolayer on the semi-transparent NIMS surface prior to mass spectrometry imaging (Figure 3A), verifying that enough visible light passes through the film for optical microscopy. Because material is laser-ablated for NIMS, optical microscopy was performed off-line, before MS imaging. Improvements in our MS instrumentation are required in order to perform microscopy and NIMS imaging in direct succession.
Figure 3.
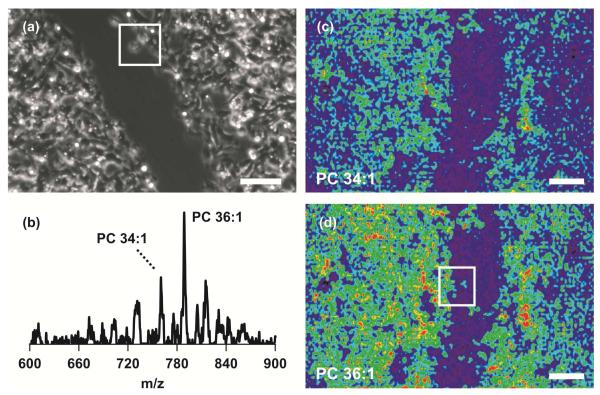
NIMS imaging and optical microscopy of cells. (a) Phase-contrast microscope image of scratch-wounded HT1080 cell monolayer on semi-transparent NIMS film. Scale bar is 250 μm. A single cell at the wound edge is contained in a 250 × 250 μm white box. (b) Single-pixel NIMS mass spectrum from wounded cell monolayer. Imaged masses are labeled. Mass spectrometry images of (c) PC 34:1 ([M+H]+ = 760.5 Da) and (d) PC 36:1 ([M+H]+ = 788.5 Da) allow cell membranes to be located. NIMS images were obtained with a spatial resolution of 14 μm. Signal intensities are expressed using a false coloring scale (low/blue → high/red). MS image scale bars correspond to 250 μm. Individual cells at the wound edge are contained in the 250 × 250 μm white box in part (d).
For the imaging experiment outlined in this manuscript, a simplified version of an external laser-focusing system and a commercial TOF mass spectrometer was used to confirm the practicality of NIMS imaging (Figure S-4). A single pixel NIMS mass spectrum using 3 laser shots is shown in Figure 3B. Each image pixel was 14 μm in height and width (Figure S-5). Two dimensional images of phosphatidylcholine or PC 34:1 (760.5 Da) and PC 36:1 (788.5 Da) are presented in Figures 3C and 3D, respectively. These lipids were specific to cell membranes, allowing for the applied wound to be differentiated from the cell monolayer and visualized in blue. Single cells at the wound edge are shown in the white 250 × 250 μm box in Figure 3D. We have demonstrated the ability to resolve PC lipids by their intact m/z values while maintaining a relatively high spatial resolution. Lipid identifications were supported by post-source decay (PSD) experiments (Figure 4). However, a more robust tandem MS approach (e.g. collision-induced dissociation) is needed to determine the exact composition of fatty acid tails.
Figure 4.
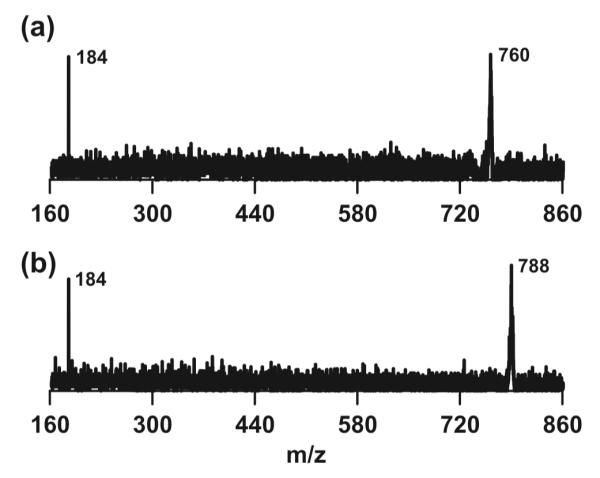
NIMS post-source decay (PSD) mass spectra of imaged phospholipids (760.5 Da, PC 34:1; 788.5 Da, PC 36:1). Fragments of 184 Da support PC assignments. Lipids were extracted from cells using 4:1 methanol to water and placed on a fresh substrate before analysis.
Because NIMS is a surface-based technique, the efficiency of the laser desorption/ionization process is repressed when thick layers of material are present. Consequently, Siuzdak and colleagues have used very thin serial sections (3-5 μm) when performing NIMS tissue imaging experiments.40 Before our cell imaging experiments, monolayers attached to the NIMS film were placed in vacuum for at least 3 hours to degas the cells, decreasing their thickness and improving MS performance slightly. The BisF17 initiator has an extremely low vapor pressure, so the NIMS substrate was stable under high vacuum (≤ 10−7 Torr). Nevertheless, detecting biomolecules directly from cells was less efficient than from solutions spotted on the surface. As with standard NIMS, a primary limitation of semi-transparent NIMS is that sensitivity decreases with thick samples. Theoretically, NIMS imaging resolution is limited only by the diffraction limit of the laser used, and not by crystal size of a co-crystalizing MALDI matrix. Practically, however, we expect that optimal NIMS spatial resolution will be determined not only by laser spot size but also fluence and sensitivity.
Conclusions
In conclusion, we have developed porous silicon films which allow for the pairing of optical microscopy and the molecular mapping capabilities of NIMS. Unlike MALDI, NIMS generates little chemical noise and is thus a powerful method for analyzing small molecules, metabolites, peptides and even small proteins with sensitivity and 14 μm spatial resolution. As our instrumentation and spatial resolution improves, the strength of coupling NIMS with optical microscopy is the potential to target specific biological molecules in precisely defined sub-cellular regions.
Supplementary Material
ACKNOWLEDGMENT
We thank the Vanderbilt Institute for Nanoscale Science and Engineering (VINSE) for use of core facilities and SEM training as well as Judson Ryckman for providing high resolution SEM images. We also thank Dr. Kellen Harkness and Dr. Jody May for helpful suggestions with the text. This work was supported by the National Science Foundation (ECCS0746296 to Y.J.), the Army Research Office (W911NF-08-1-0200 to J.L.L. and W911NF-09-1-0101 to Y.J.), the National Institutes of Health (GM092914 to D.J.W., T32CA078136 to J.A.B. and RC2DA028981 and RO1GM092218 to J.A.M.), the Vanderbilt Insitute of Chemical Biology, the Vanderbilt Institute for Integrative Biosystems Research and Education, and the Vanderbilt University College of Arts and Sciences.
REFERENCES
- 1.Karas M, Hillenkamp F. Anal. Chem. 1988;60:2299–2301. doi: 10.1021/ac00171a028. [DOI] [PubMed] [Google Scholar]
- 2.Tanaka K, Waki H, Ido Y, Akita S, Yoshida Y, Yoshida T. Rapid Comm. Mass Spectrom. 1988;2:151–153. [Google Scholar]
- 3.Fenn JB, Mann M, Meng CK, Wong SF, Whitehouse CM. Science. 1989;246:64–71. doi: 10.1126/science.2675315. [DOI] [PubMed] [Google Scholar]
- 4.Aebersold R, Mann M. Nature. 2003;422:198–207. doi: 10.1038/nature01511. [DOI] [PubMed] [Google Scholar]
- 5.Trimpin S, Deinzer M. Anal. Chem. 2007;79:71–78. doi: 10.1021/ac0607919. [DOI] [PubMed] [Google Scholar]
- 6.Trimpin S, Keune S, Rader HJ, Mullen K. J. Am. Soc. Mass. Spectrom. 2006;17:661–671. doi: 10.1016/j.jasms.2006.01.007. [DOI] [PubMed] [Google Scholar]
- 7.Hankin JA, Barkley RM, Murphy RC. J. Am. Soc. Mass Spectrom. 2007;18:1646–1652. doi: 10.1016/j.jasms.2007.06.010. [DOI] [PMC free article] [PubMed] [Google Scholar]
- 8.Caprioli RM, Farmer TB, Gile J. Anal. Chem. 1997;69:4751–4760. doi: 10.1021/ac970888i. [DOI] [PubMed] [Google Scholar]
- 9.McDonnell LA, Heeren RMA. Mass Spectrom. Rev. 2007;26:606–643. doi: 10.1002/mas.20124. [DOI] [PubMed] [Google Scholar]
- 10.Schwartz SA, Caprioli RM. In: Mass Spectrometry Imaging. Rubakhin SS, Sweedler JV, editors. Humana Press; New York: 2010. [Google Scholar]
- 11.Boxer SG, Kraft ML, Weber PK. Annu. Rev. Biophys. 2009;38:53–74. doi: 10.1146/annurev.biophys.050708.133634. [DOI] [PubMed] [Google Scholar]
- 12.Ostrowski SG, Van Bell CT, Winograd N, Ewing AG. Science. 2004;305:71–73. doi: 10.1126/science.1099791. [DOI] [PMC free article] [PubMed] [Google Scholar]
- 13.Tucker KR, Li Z, Rubakhin SS, Sweedler JV. J. Am. Soc. Mass. Spectrom. 2012 doi: 10.1007/s13361-012-0472-1. doi:10.1007/s13361-012-0472-1. [DOI] [PMC free article] [PubMed] [Google Scholar]
- 14.Seeley EH, Caprioli RM. Proc. Natl. Acad. Sci. U.S.A. 2008;105:18126–18131. doi: 10.1073/pnas.0801374105. [DOI] [PMC free article] [PubMed] [Google Scholar]
- 15.Zimmerman TA, Rubakhin SS, Sweedler JV. J. Am. Soc. Mass Spectrom. 2011;22:828–836. doi: 10.1007/s13361-011-0111-2. [DOI] [PMC free article] [PubMed] [Google Scholar]
- 16.Becker JS, Zoriy M, Becker JS, Dobrowolska J, Matusch A. J. Anal. At. Spectrom. 2007;22:736–744. [Google Scholar]
- 17.Wu B, Becker JS. Int. J. Mass Spectrom. 2011;307:112–122. [Google Scholar]
- 18.Nemes P, Woods AS, Vertes A. Anal. Chem. 2010;82:982–988. doi: 10.1021/ac902245p. [DOI] [PMC free article] [PubMed] [Google Scholar]
- 19.Shrestha B, Patt JM, Vertes A. Anal. Chem. 2011;83:2947–2955. doi: 10.1021/ac102958x. [DOI] [PubMed] [Google Scholar]
- 20.Fletcher JS, Lockyer NP, Vaidyanathan S, Vickerman JC. Anal. Chem. 2007;79:2199–2206. doi: 10.1021/ac061370u. [DOI] [PubMed] [Google Scholar]
- 21.Spengler B, Hubert M. J. Am. Soc. Mass Spectrom. 2002;13:735–748. doi: 10.1016/S1044-0305(02)00376-8. [DOI] [PubMed] [Google Scholar]
- 22.Rompp A, Guenther S, Schober Y, Schulz O, Takats Z, Kummer W, Spengler B. Angew. Chem. Int. Ed. 2010;49:3834–3838. doi: 10.1002/anie.200905559. [DOI] [PubMed] [Google Scholar]
- 23.Luxembourg SL, Mize TH, McDonnell LA, Heeren RMA. Anal. Chem. 2004;76:5339–5344. doi: 10.1021/ac049692q. [DOI] [PubMed] [Google Scholar]
- 24.Jungmann JH, MacAleese L, Visser J, Vrakking MJJ, Heeren RMA. Anal. Chem. 2011;83:7888–7894. doi: 10.1021/ac2017629. [DOI] [PubMed] [Google Scholar]
- 25.Bouschen W, Schulz O, Eikel D, Spengler B. Rapid Comm. Mass Spectrom. 2010;24:355–364. doi: 10.1002/rcm.4401. [DOI] [PubMed] [Google Scholar]
- 26.Harris GA, Galhena AS, Fernandez FM. Anal. Chem. 2011;83:4508–4538. doi: 10.1021/ac200918u. [DOI] [PubMed] [Google Scholar]
- 27.Northen TR, Yanes O, Northen MT, Marrinucci D, Uritboonthai W, Apon J, Golledge SL, Nordström A, Siuzdak G. Nature. 2007;449:1033–1036. doi: 10.1038/nature06195. [DOI] [PubMed] [Google Scholar]
- 28.Northen TR, Lee JC, Hoang L, Raymond J, Hwang DR, Yannone SM, Wong CH, Siuzdak G. Proc. Natl. Acad. Sci. U.S.A. 2008;105:3678–3683. doi: 10.1073/pnas.0712332105. [DOI] [PMC free article] [PubMed] [Google Scholar]
- 29.Woo HK, Northen TR, Yanes O, Siuzdak G. Nat. Protoc. 2008;3:1341–1349. doi: 10.1038/nprot.2008.110. [DOI] [PubMed] [Google Scholar]
- 30.Northen TR, Woo HK, Northen MT, Nordström A, Uritboonthai W, Turner KL, Siuzdak G. J. Am. Soc. Mass Spectrom. 2007;18:1945–1949. doi: 10.1016/j.jasms.2007.08.009. [DOI] [PMC free article] [PubMed] [Google Scholar]
- 31.Amantonico A, Flamigni L, Glaus R, Zenobi R. Metabolomics. 2009;5:346–353. [Google Scholar]
- 32.Yanes O, Woo HK, Northen TR, Oppenheimer SR, Shriver L, Apon J, Estrada MN, Potchoiba MJ, Steenwyk R, Manchester M, Siuzdak G. Anal. Chem. 2009;81:2969–2975. doi: 10.1021/ac802576q. [DOI] [PMC free article] [PubMed] [Google Scholar]
- 33.Solanki CS, Bilyalov RR, Poortmans J, Celis JP, Nijs J, Mertens R. J. Electrochem. Soc. 2004;151:C307–C314. [Google Scholar]
- 34.McLean JA, Russell DH. 7,282,706 US Patent. 2007 Oct 16;
- 35.Sherrod SD, Castellana ET, McLean JA, Russell DH. Int. J. Mass Spectrom. 2007;262:256–262. [Google Scholar]
- 36.Segal EB. Chem. Health Saf. 2000;7:18–23. [Google Scholar]
- 37.Canham LT, editor. Properties of Porous Silicon. IEE INSPEC; London: 1997. [Google Scholar]
- 38.Wen XJ, Dagan S, Wysocki VH. Anal. Chem. 2007;79:434–444. doi: 10.1021/ac061154l. [DOI] [PubMed] [Google Scholar]
- 39.Friedl P, Gilmour D. Nat. Rev. Mol. Cell Biol. 2009;10:445–457. doi: 10.1038/nrm2720. [DOI] [PubMed] [Google Scholar]
- 40.Patti GJ, Woo HK, Yanes O, Shriver L, Thomas D, Uritboonthai W, Apon JV, Steenwyk R, Manchester M, Siuzdak G. Anal. Chem. 2010;82:121–128. doi: 10.1021/ac9014353. [DOI] [PMC free article] [PubMed] [Google Scholar]
Associated Data
This section collects any data citations, data availability statements, or supplementary materials included in this article.