Abstract
The nucleus of the solitary tract (NTS) receives input from taste buds on the rostral tongue from the chorda tympani (CT) nerve. How this input is processed by the NTS was the subject of the present investigation. Here we used tetrodes to record from pairs or small groups of NTS cells as they responded to taste stimuli or electrical stimulation of the CT nerve in urethane-anesthetized rats. Once a pair (or small group) of NTS cells were isolated and identified as showing an evoked response to CT nerve stimulation, taste stimuli were presented in separate trials. Tastants consisted of 0.1 M NaCl, 0.01 M HCl, 0.01 M quinine HCl, and 0.5 M sucrose. Responses to various patterns of CT stimulation were then recorded. Functional connections among simultaneously recorded NTS cells were implied from analysis of cross-correlation functions of spike trains. We identified four groups of cells, not all of which responded to taste, with staggered latencies of response to CT nerve stimulation, ranging from ∼3 to 35 ms in ∼8- to 12-ms increments. Analyses of putative functional connectivity along with latencies of CT-evoked responses suggested that CT input arrives at the NTS in pulses or waves, each of which activates recurrent excitatory connections among NTS cells. These actions may amplify the incoming signal and refine its temporal pattern.
Keywords: taste, gustatory, neural coding, nucleus of solitary tract, nucleus tractus solitarii, neurophysiology, rat
the temporal distribution of neural network activity is a commonly observed phenomenon in which the burden of information processing is divided across time and shared among neural elements. A common theme in the organization of sensory systems in the brain is the segregation of the neural representation into modules, reflected in both anatomy and function. This type of arrangement is characteristic of the visual (Lindstrom 1982; Hamos et al. 1985), auditory (Huang et al. 1999), and olfactory (Friedrich and Laurent 2001; Kay and Stopfer 2006) systems, even at their first central relay nuclei. In the gustatory system, however, this type of organization has not been described. Here we studied the functional connections between cells in the nucleus of the solitary tract (NTS), the first central relay in the central gustatory pathway, to explore the hypothesis that taste cells are arranged as stimulus-specific modules.
In a series of recent experiments, we adopted the strategy of searching for commonalities among taste-responsive NTS cells based on their response to electrical stimulation of the chorda tympani (CT) nerve, a branch of the facial nerve that innervates taste buds on the rostral two-thirds of the tongue. Previous studies had shown that CT electrical stimulation produced a recurrent inhibitory influence on NTS cells (Di Lorenzo et al. 2003; Lemon and Di Lorenzo 2002). (Here, “inhibition” is defined as an attenuation of a response to CT nerve stimulation; cellular mechanisms underlying this effect were not studied.) More recent work has shown that there are two different time courses of inhibition in NTS cells produced by CT stimulation: one that peaks at ∼10 ms and decays rapidly (by ∼100 ms) and a second that peaks at ∼50 ms and decays more slowly (by ∼500 ms) (Rosen and Di Lorenzo 2009; Rosen et al. 2010). Cells that showed a short time course of inhibition were narrowly tuned across taste qualities and had a short latency of CT-evoked response, while cells that showed a long time course of inhibition were generally more broadly tuned and showed longer-latency CT-evoked responses. A third group of cells was later identified as broadly tuned, with a short time course of inhibition and a short latency of CT-evoked response (Rosen et al. 2010). To understand how the NTS might organize these functionally defined cell types, we constructed a computational model based on the idea that there might be taste stimulus-specific assemblies containing exemplars of each cell type (Rosen et al. 2010). This model was able to simulate the effects of CT stimulation as well as the tuning and taste-evoked temporal patterns of response in each of the three cell types.
In the present study, we tested whether the predictions of connectivity among NTS cell types that were suggested by our previous model (Rosen et al. 2010) were actually present and whether they supported a stimulus-specific assembly model of the NTS. To accomplish this, we recorded from pairs or small groups of NTS cells simultaneously. Functional connections among NTS cells were detected through cross-correlational analyses of spike trains. NTS responses to taste stimuli and to paired-pulse electrical stimulation of the CT nerve were used in conjunction with functional connection data. In general, data were consistent with the presence of taste stimulus-specific modules, although results pointed to a different type of cellular organization. That is, the present data showed that taste stimuli evoke a complex spatiotemporal pattern of activity in the NTS, with CT input arriving as pulses or waves of excitation that in turn generate recurrent excitatory inputs among NTS cells. Within this structure, excitatory activity generated by taste stimuli may be amplified and filtered to refine the temporal arrangement of the evoked response.
MATERIALS AND METHODS
Animals.
Fifty-eight adult male Sprague-Dawley rats weighing 350–450 g were used as subjects. Prior to surgery rats had access to standard rat chow and water ad libitum. They were pair-housed and kept on a 12:12-h light-dark cycle with lights on at 0700. A plastic tube was placed in each cage to provide environmental stimulation. All procedures were approved by the Binghamton University Institutional Animal Care and Use Committee.
Surgery.
Prior to surgery rats were deeply anesthetized with urethane (1.5 g/kg ip). Body temperature was held constant at 37°C by a heating pad connected to an anal thermistor probe. Rats were tracheotomized to facilitate breathing during taste stimulus delivery, and their heads were mounted in a stereotaxic instrument (David Kopf Instruments, Tujunga, CA). The animal's head was fixed with the incisor bar at 5 mm below the interaural line. The skull was exposed, and stainless steel screws were implanted just anterior to bregma. A nontraumatic head holder was secured with dental cement to the stainless steel screws implanted in the skull. The pinna of the left ear was removed to expose the tympanic membrane. Stimulating electrodes (platinum, 0.003-in. diameter) were inserted in the tympanic membrane to allow for the passage of electrical current across the CT nerve. The occipital bone and meninges were removed and the posterior cerebellum gently aspirated to allow access to the caudal medulla.
Electrophysiological recording.
The NTS was located ∼2.7 mm rostral and 1.8 mm lateral to the obex and 1.0 mm below the dorsal surface of the brain stem. Electrophysiological recordings were performed with both etched tungsten microelectrodes (FHC, Bowdoinham, ME), insulated except for the tip (18–20 MΩ, 1 V at 1 kHz), and tetrodes with recording sites spaced 17–38 μm apart (1–2 MΩ) (Thomas Recording, Giessen, Germany). Recordings of two or more cells were derived exclusively from tetrodes. Signals were amplified with a Grass AC amplifier (model P511, Astro-Med, West Warwick, RI). All recorded activity was digitized with an analog-to-digital interface (model 1401, CED, Cambridge, UK) and analyzed off-line with Spike2 software (CED) and NeuroExplorer (Nex Technologies, Littleton, MA). Principal component analyses and template matching based on waveform parameters were used off-line to assess cell isolation. A signal-to-noise ratio of 3:1 was required for isolation. The precise timing of cell spiking with 1-ms precision was analyzed with respect to the timing of both tastant delivery and each pulse of electrical stimulation of the CT nerve.
Experimental protocol.
As the recording electrode was lowered, the taste-responsive portion of the NTS was identified by the presence of a response in the background to presentation of NaCl (0.1 M), as described below, and/or an evoked response to electrical stimulation of the CT nerve (0.1 ms, 0.5 mA, 1 Hz). When an NTS cell was isolated, 2 min of spontaneous activity was recorded. Taste stimuli were then presented in individual trials. Next, the CT nerve was stimulated at 1 Hz while the current was gradually increased to a level that reliably evoked a spike. This current level was used for the remainder of the experiment. To determine the latency of response, 100 pulses were presented at 1 Hz. Paired-pulse stimulation of the CT nerve followed in blocks of 100 presentations. Pulses were delivered at interpulse intervals (IPIs) of 10, 20, 30, 50, 100, 500, 1,000, and 2,000 ms. Each pair of pulses was separated by 1 s when the IPI was <500 ms and by 2 s when the IPI was ≥500 ms. The interblock interval was 1 min. Pulses were delivered through a digital stimulator (model DS8000, WPI, Sarasota, FL) using a constant-current stimulus isolation unit (A365, WPI).
Taste stimuli and delivery.
Taste stimuli consisted of 0.1 M NaCl, 0.01 M HCl, 0.01 M quinine, and 0.5 M sucrose. All taste stimuli were made from reagent-grade chemicals dissolved in distilled water and delivered at room temperature. Stimulus presentation was accomplished through a custom-built taste delivery system that consisted of stimulus reservoirs pressurized with compressed air and connected via polyethylene tubing to a bundle of six stainless steel tubes placed in the mouth. Delivery of a tastant was controlled by computer activation of a solenoid valve interposed between the reservoir and the tongue. Stimuli were delivered at a flow rate of 5 ml/s. The taste solution bathed the whole mouth, including the rostral two-thirds of the tongue, the field innervated by the CT nerve. Each stimulus trial consisted of 10-s baseline, 10 s of distilled water, 5 s of tastant, 5-s pause, and 20-s distilled water rinse. The intertrial interval was 2 min.
Analysis of taste responsivity.
Electrophysiological responses to taste stimuli were obtained from extracellular recordings. The magnitude of response to a given tastant was calculated as the mean firing rate (spikes per second, sps) during the 5 s of tastant delivery minus the average firing rate (sps) during the 5 s of water rinse that preceded tastant delivery. A taste response was considered to be significant if the firing rate was 2.5 standard deviations greater than the firing rate during the last 5 s of the preceding water rinse. Taste responses were analyzed for breadth of tuning with an uncertainty measure (Smith and Travers 1979). The formula for uncertainty is H = −k∑Pi(log Pi), where k (scaling factor) = 1.66 and Pi is the proportion of response to stimulus i relative to the summed responses to all four stimuli. Values range from 0 to 1.0, with 0 corresponding to a cell responsive to only one stimulus and 1.0 corresponding to a cell equally responsive to all four stimuli. In addition to the uncertainty measure, we used a metric called selectivity that is designed to reflect both the magnitude of response and the breadth of tuning (Rosen and Di Lorenzo 2009). Selectivity is defined as the difference in response magnitude in spikes per second between the sum of the two strongest responses and the sum of the two weakest responses. The formula for selectivity is S = (t1 + t2) − (t3 + t4), where t1 through t4 indicate the response magnitudes to the first through the fourth best tastants. Where applicable, mean values are reported as means ± SE.
Analysis of latency of response to electrical stimulation of CT nerve.
Groups of cells with similar latencies of CT-evoked responses were identified by hierarchical cluster analysis. In this analysis, cells were joined into clusters according to how similar they were in both the CT-evoked response latency and jitter with an iterative process. Initially, the two most similar cells are joined to form a cluster. Next, the two most similar cells form another cluster or another cell, similar to those in the initial cluster, is added to that cluster. The process continues until all cells are grouped into clusters based on the similarity of their response properties. Distances between clusters are indicative of dissimilarity. In the present study, the squared Euclidean distance was used as a measure of similarity, and the Ward method for linkage was used. Analysis was conducted in SYSTAT.
Analysis of paired-pulse stimulation of CT nerve.
Paired-pulse stimulation data were assessed for the nature, duration, and peak time of the paired-pulse effect. The occurrence of spikes following the conditioning (first) and test (second) pulses were used to construct a peristimulus time histogram (PSTH) of the evoked responses for 100 trials at each IPI. The times at which the peak, earliest, and latest evoked responses occurred in each PSTH, as well as the total number of evoked spikes, were noted. The latency of evoked response to CT stimulation was defined as the time between the onset of stimulation (beginning of artifact) and the start of the action potential. The standard deviation of the times of occurrence of the evoked spikes was defined as “latency variability” or “jitter” (Doyle and Andresen 2001). For each IPI the percent change in the number of spikes following the conditioning and test pulses was calculated. A percent change was used for comparisons across cells because of the variability in the total number of evoked spikes. Paired-pulse attenuation was defined as a ≥20% decrease in the number of spikes following the test pulse compared with the number of spikes following the conditioning pulse. Paired-pulse enhancement was defined as a ≥20% increase in the number of spikes following the test pulse compared with the conditioning pulse. The decay time constant was defined as the period between the onset of the conditioning pulse and the time at which the percent change reached 37% of maximum attenuation.
Analysis of functional connectivity.
Functional connectivity between pairs of simultaneously recorded neurons was assessed by calculating pairwise cross-correlation functions (CCFs) with a time bin of 1 ms (Adachi et al. 1989). We included the entire experimental session in this analysis. Coincident spiking was represented in cross-correlation histograms as described by Melssen and Epping (1987). The CCF estimated the probability that an action potential in a reference spike train preceded or followed spikes produced by a second target neuron across known intervals of time. Excitatory or inhibitory relationships between cells were evidenced as a peak or trough in the CCF, respectively. The time of the peak or trough was noted as the delay or lag time of the connection between the two cells. Significant peaks and troughs were defined as those that exceeded a confidence level of α = 0.05. Confidence limits were calculated according to the methods detailed by Abeles (1982). In addition, the width of the peak and trough was defined as the time during which the peak (trough) extended beyond the confidence limits.
The shift predictor method was used to correct for correlated firing attributed to common synaptic input (Katz et al. 2002; Perkel et al. 1967). The spike train of the reference neuron was correlated with the spikes of the second neuron that were shifted in time. Correlated activity between the two spike trains observed in the “shifted” CCF was attributed to coincident synaptic input and was subtracted from the raw data to produce the corrected CCF. The corrected CCF showed significant correlations that were attributed to functional connectivity between neurons. We use the term “functional connectivity” to indicate a temporal relationship between the firing patterns of a given pair of neurons, rather than an indication of synaptic connectivity. It is important to note that cross-correlation analysis provides only an indirect measure of the synaptic connectivity.
Autocorrelation functions (ACFs) were calculated for all pairs of functionally connected cells. The ACF is calculated identically to the CCF except that both the reference and target spike trains are identical. For each cell, the ACF is represented in a histogram that shows the frequency with which one spike follows another at increasing intervals in time. Autocorrelation analysis is necessary to detect correlated activity between cells that may be related to rhythmic input to one or both of cells. Rhythmicity in a spike train would present as periodic peaks in the ACF; we did not find such evidence in our data.
Histology.
After responses to taste and CT stimulation from a cell were recorded, an electrolytic lesion was produced at the site of recording by passing DC current (1 mA cathodal for 5 s) through the recording electrode. The animals were then killed and their brains removed and placed in formalin. After 2 wk the brains were frozen and the brain stem was sliced into 40 μm sections, stained with cresyl violet, mounted on gelatinized slides, and examined to verify the location of the lesion in the rostral NTS.
RESULTS
General response characteristics.
Evoked responses to electrical stimulation of the CT nerve were recorded from 51 cells with CT-evoked responses, 9 of which were not taste-responsive. There were four instances where a taste-responsive cell was recorded simultaneously with a non-taste-responsive cell. Data from these cells were pooled with data from a previous investigation of CT-evoked responses in the NTS (Rosen and Di Lorenzo 2009; n = 51 cells) to increase the power of some of the analyses. New and previous data did not show significant differences in the latency or jitter of CT-evoked response or prevalence of taste-responsive and non-taste-responsive cells (see Table 1). Of the 102 CT-responsive cells, 78 cells (76%) responded to taste stimuli. The mean spontaneous firing rate across cells was 2.1 ± 0.2 sps. Taste-responsive cells showed significantly higher spontaneous firing rates (mean = 2.4 ± 0.3 sps) than non-taste-responsive cells [mean = 1.2 ± 0.3 sps; t(100) = 2.9, P < 0.01]. Generally, NTS cells were broadly sensitive across taste stimuli: the average uncertainty measure was 0.73 ± 0.02 (range 0.01–1.0; median = 0.79), and the average selectivity value was 9.4 ± 1.1 sps (range 0.9–40.0 sps; median = 5.8 sps). The majority of cells responded to more than one of the taste stimuli presented. Twenty-six of 78 taste-responsive cells (33%) responded to all four taste stimuli, 26 (33%) responded to three stimuli, 14 (18%) responded to two stimuli, and 12 (16%) responded to one taste stimulus. When cells were classified according to their “best” stimulus, defined as the tastant that evoked the highest magnitude of response, 41 (54%) were NaCl best, 18 (23%) were HCl best, 15 (19%) were sucrose best, and 4 (5%) were quinine best.
Table 1.
Essential features of new and previously recorded data
| New | Rosen and Di Lorenzo (2009) | |
|---|---|---|
| Number of cells | 51 | 51 |
| Taste-responsive | 42 | 36 |
| Non-taste-responsive | 9 | 15 |
| Mean spontaneous rate, sps | 2.5 ± 0.2 | 1.7 ± 0.4 |
| Mean uncertainty | 0.76 ± 0.03 | 0.69 ± 0.04 |
| Mean selectivity, sps | 8.5 ± 1.4 | 10.3 ± 1.4 |
| Sucrose best | 8 | 7 |
| NaCl best | 21 | 20 |
| HCl best | 11 | 7 |
| Quinine best | 2 | 2 |
| Mean CT response latency, ms | 12.9 ± 1.3 | 10.9 ± 1.2 |
| Mean CT response jitter, ms | 4.8 ± 0.4 | 4.0 ± 0.3 |
Values are means ± SE. CT, chorda tympani; sps, spikes per second.
Electrical stimulation of the CT resulted in a time-locked evoked response in all cells. The frequency distribution of the latency of CT-evoked response showed three modes, plus a fourth group of cells with very long latencies >30 ms (see Fig. 1A). These suggested four latency groups, as defined below and labeled in Fig. 1. The statistical justification of the grouping was verified with hierarchical cluster analysis of the latency of evoked response to CT stimulation and the jitter of the evoked response (SD of the latency). Results are shown in Fig. 1B. These four clusters or groups of cells corresponded to the “short,” “medium,” “medium-long,” and “long” latency groups identified in Fig. 1A.
Fig. 1.
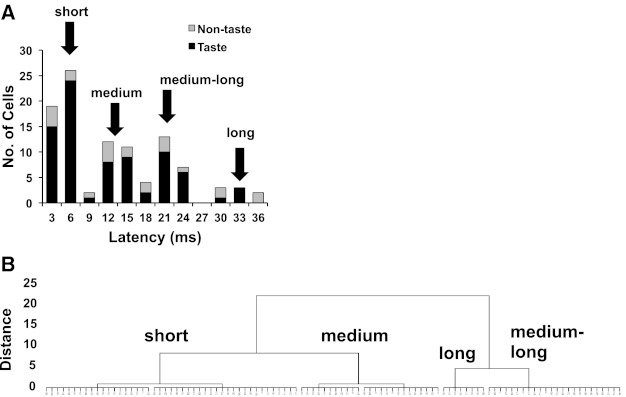
A: frequency distribution of the latency of evoked response to electrical stimulation of the chorda tympani (CT) nerve across 102 nucleus of the solitary tract (NTS) cells. Black bars indicate taste-responsive cells; gray bars indicate non-taste-responsive cells. Values along the x-axis indicate the upper limit of each bin. Arrows above the graph indicate latency groups. B: dendrogram showing results of a hierarchical cluster analysis conducted on latency and jitter for each cell. See text for details.
The mean latency of evoked response across all 102 cells was 11.9 ± 0.9 ms (median = 10.0 ms; range = 2–35 ms). Latencies of CT-evoked responses in taste-responsive cells (mean = 11.0 ± 1.0 ms) were not significantly different than those in non-taste-responsive cells (mean = 14.9 ± 2.1 ms) (Wilcoxon-Mann-Whitney rank sum test, P = 0.25). The majority of cells responded to CT stimulation with a single time-locked spike; however, 15 cells (15%) showed more than one evoked spike. In cells that responded to CT stimulation with more than one spike, the second spike occurred on average 4.9 ± 0.5 ms after the first.
The mean jitter of the evoked responses across all cells was 1.26 ± 0.12 ms. There was a significant positive correlation between the latency of evoked response and jitter such that cells with long latencies showed significantly more variability in the latency of evoked response (r = 0.82, P < 0.001).
Latency groups varied significantly from each other in both latency and jitter (see Fig. 2). A one-way ANOVA was conducted on latencies with latency group as a factor. Results showed a significant main effect [F(3, 91) = 834.0, P < 0.0001]. Pairwise comparisons using the Newman-Keuls test confirmed that all latency groups differed significantly from all others (all P < 0.0001). Similarly, for jitter, a significant main effect of latency group was found [F(3,91) = 53.2, P < 0.0001] and pairwise comparisons showed that jitter was significantly different among all latency groups (all P < 0.001). Figure 2A shows examples of raw records of CT-evoked responses in cells from each latency group. Figure 2B shows the mean ± SE latency in each latency group. Figure 2C shows PSTHs of CT-evoked responses, illustrating the point that longer-latency responses were more variable than shorter-latency responses. Figure 2D shows the mean ± SE jitter (SD) values for each latency group.
Fig. 2.
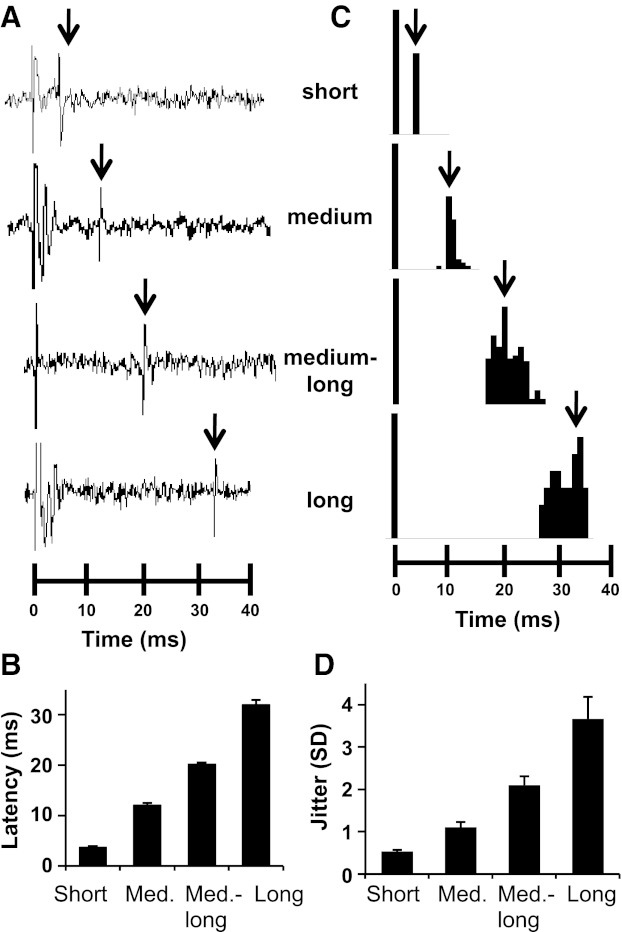
Latency and jitter among NTS cells in response to CT nerve stimulation. A: neural firing of cells in each latency group in response to electrical pulses delivered to the CT nerve. B: mean + SE latencies of CT-evoked responses in each latency group. C: peristimulus time histograms of variability of the latency of response to CT nerve stimulation in each latency group. D: mean + SE jitter (SD) (ms) in each latency group.
Taste response properties of NTS cells in different latency groups.
NTS cells were grouped according to their latency and jitter to CT stimulation as described above. There were 45 cells in the short-latency group (39 taste-responsive; 87%), 25 cells in the medium-latency group (17 taste-responsive; 68%), 24 cells in the medium-long-latency group (18 taste-responsive; 75%), and 8 cells in the long-latency group (4 taste-responsive; 50%). Table 2 shows the response properties of cells across these groups. Analyses of the response properties across latency groups showed that there were no significant differences across groups in either the selectivity measure or the H values. Figure 3 shows the response magnitudes (in sps) from all cells in each latency group.
Table 2.
Taste response properties in latency groups
| Stage | Sucrose, sps | NaCl, sps | HCl, sps | Quinine, sps | Spont., sps | Selectivity, sps | H Value |
|---|---|---|---|---|---|---|---|
| Short | 2.0 ± 0.5 | 9.8 ± 1.5 | 5.4 ± 0.8 | 3.9 ± 0.6 | 1.9 ± 0.3 | 12.6 ± 1.7 | 0.76 ± 0.03 |
| Medium | 2.7 ± 0.9 | 4.5 ± 1.6 | 4.1 ± 1.1 | 2.5 ± 1.0 | 4.0 ± 0.8 | 6.6 ± 1.8 | 0.76 ± 0.1 |
| Medium-long | 1.8 ± 0.9 | 3.9 ± 1.6 | 2.0 ± 0.7 | 2.0 ± 0.7 | 2.2 ± 0.4 | 7.1 ± 1.7 | 0.69 ± 0.04 |
| Long | 2.0 ± 1.2 | 5.3 ± 3.8 | 1.0 ± 0.5 | 2.3 ± 2.0 | 2.3 ± 0.9 | 8.8 ± 4.8 | 0.69 ± 0.1 |
Values are means ± SE. Spont., spontaneous firing rate; sps, spikes per second.
Fig. 3.
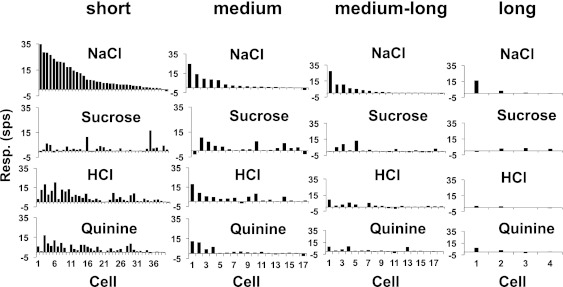
Responses to the 4 prototypical taste stimuli across cells in each latency group. Cells are aligned vertically in descending order of magnitude of their response to NaCl.
Functional connectivity and latency groups.
Both excitatory and inhibitory relationships were evident among latency groups of NTS cells. We characterized 55 functional connections among 42 pairs of simultaneously recorded NTS neurons (see Fig. 4). Simultaneous recordings included 12 records with two cells, 4 records with three cells, and 3 records with four cells. Forty-four functional connections (80%) were excitatory, and 11 connections (20%) were inhibitory. The probability of detecting a connection between a pair of simultaneously recorded neurons was 76.4%.
Fig. 4.
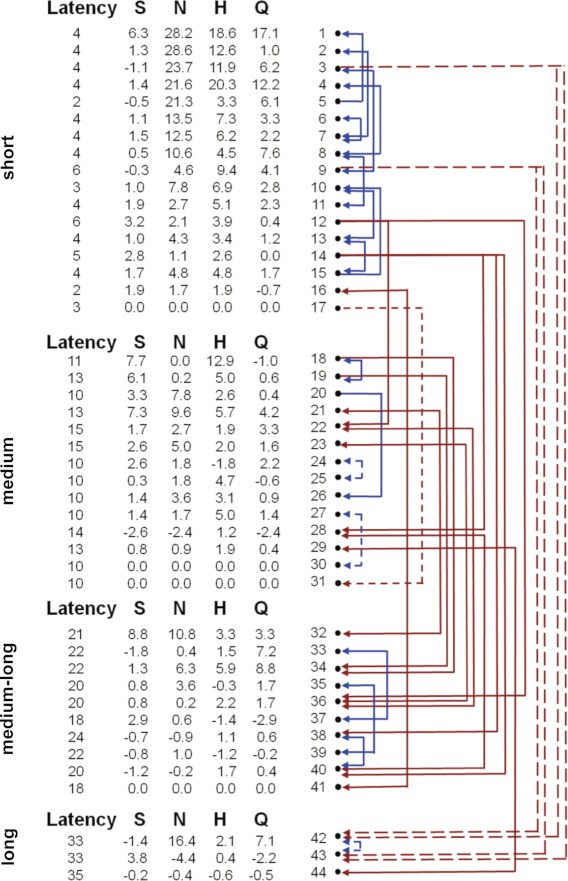
Functional connectivity among NTS cells. Latency (ms) refers to the evoked response to electrical stimulation of the CT nerve. Taste response magnitudes to the basic taste qualities are also shown. S, sucrose; N, NaCl; H, HCl; Q, quinine. Within-latency group connections are blue; between-latency group connections are red. Excitatory connections are solid lines; inhibitory connections are dashed lines.
Functional connectivity included between-group and within-group connections (“groups” refer to latency groups; see Table 3). A large proportion of functional connectivity between NTS cells was reciprocal, defined as two cells that influenced one another (see Table 4). Thirty-four of 44 excitatory connections (77%) and 6 of 11 inhibitory connections (55%) were reciprocal. Reciprocal excitatory connections were observed both within latency groups (n = 22) and between latency groups (n = 12). Reciprocal inhibitory connections were only observed within latency groups. The mean peak or trough (time of maximum excitation or inhibition) and width (time during which there was a significant peak or trough) for each type of functional connectivity are shown in Tables 3 and 4. The mean peak or trough was similar across connectivity types with the exception of within-group inhibition, which showed a trough later (n = 6; mean = 14.7 ± 3.5 ms). In addition, the mean width of inhibitory troughs (n = 11; mean = 21.9 ± 3.8 ms) was significantly longer than the mean width of excitatory peaks [n = 44; mean = 6.6 ± 0.8 ms; t(53) = −6.3, P < 0.001].
Table 3.
Properties of excitatory and inhibitory functional connectivity across and within latency groups
| Short to Long | Within Group | Long to Short | |
|---|---|---|---|
| Excitatory connections (n = 44) | |||
| Prevalence | n = 13; 31% | n = 25; 55% | n = 6; 14% |
| Peak, ms | 7.8 ± 1.4 | 8.1 ± 1.6 | 5.7 ± 2.6 |
| Width, ms | 7.0 ± 0.4 | 6.0 ± 1.3 | 8.5 ± 1.9 |
| Inhibitory connections (n = 11) | |||
| Prevalence | n = 5; 38% | n = 6; 62% | n = 0 |
| Peak, ms | 5.6 ± 0.7 | 14.7 ± 3.5 | |
| Width, ms | 22.0 ± 4.6 | 21.8 ± 6.2 |
Values are means ± SE.
Table 4.
Properties of reciprocal functional connectivity
| Within Group | Between Group | |
|---|---|---|
| Reciprocal excitatory connections (n = 34) | ||
| Prevalence | n = 22; 65% | n = 12; 35% |
| Peak, ms | 8.1 ± 1.7 | 5.5 ± 1.6 |
| Width, ms | 6.1 ± 1.4 | 7.7 ± 1.0 |
| Reciprocal inhibitory connections (n = 6) | ||
| Prevalence | n = 6 | n = 0 |
| Peak, ms | 14.7 ± 3.5 | |
| Width, ms | 21.8 ± 6.2 |
Values are means ± SE.
Types of functional connectivity.
Functional connectivity varied systematically within and across latency groups. The most common form of functional connectivity observed was excitation among cells in the same latency group. This occurred most often among cells in the short-latency group, where most excitatory interactions were reciprocal. Some within-group excitatory connections were also observed among cells with medium and medium-long latencies but not among cells with long latencies. The second most common form of functional connectivity was excitation from shorter- to longer-latency groups. For example, cells with short CT-evoked latencies had excitatory connections aimed at cells with medium CT-evoked latencies. Some cells with medium-long and long latencies to CT stimulation also excited cells with shorter CT-evoked latencies. Most of the inhibitory connections originated in cells in the short-latency group and were targeted at cells in the long-latency group. Cells with medium and long latencies to CT stimulation also showed evidence of reciprocal within-group inhibition.
Functional connectivity and taste responsivity.
Similarity in taste responsivity was related to the form of functional connectivity between cells. Figure 5 shows examples of analyses of four pairs of cells that were functionally connected. Figure 5A shows the corrected CCFs (minus the shift predictor CCF) for each pair of cell, with the shaded area indicating the 99% confidence limit. Figure 5B shows the taste responses for each cell, with the target cell indicated by dashed lines. Figure 5C shows a trace of raw data for each cell, and Fig. 5D shows the results of principal component analyses used for cell isolation of each cell pair. Analysis of correlations between taste response profiles showed that cells with excitatory functional connectivity (n = 32) had positively correlated taste response profiles (r = 0.61, P < 0.001). Cells that showed inhibitory functional connectivity (n = 6) had negatively correlated taste response profiles (r = −0.63, P < 0.001). There were no significant differences in the breadth of tuning between taste-responsive cells with excitatory connectivity (mean selectivity = 10.6 ± 1.6 sps; mean uncertainty = 0.76 ± 0.04) and inhibitory connectivity (mean selectivity = 11.9 ± 3.9 sps; mean uncertainty = 0.77 ± 0.07).
Fig. 5.
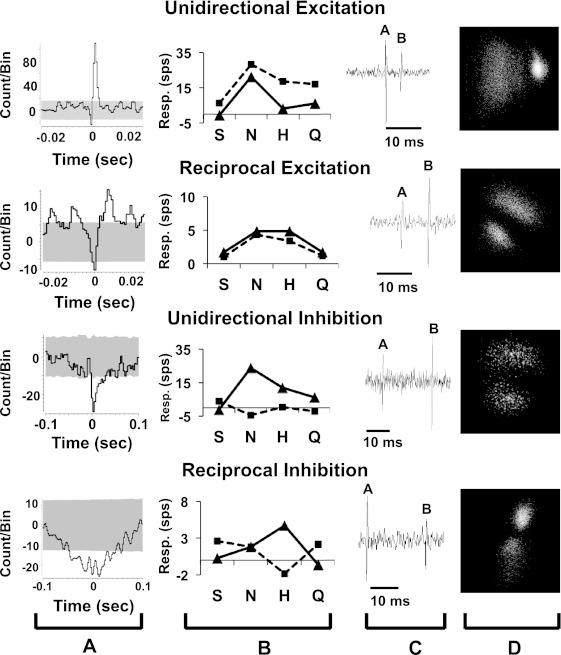
Cross-correlograms and taste response profiles of cells with different types of functional connectivity. A: cross-correlation functions (CCFs) for each cell; shaded area indicates 99% confidence limit. B: taste response magnitudes for the source cell (solid line) and target cell (dashed line). C: raw electrophysiological records of each cell; A is the source and B is the target cell. D: results of principal component analyses of waveforms of cells shown in C.
Effects of paired-pulse electrical stimulation of CT nerve.
A variety of paired-pulse effects were observed in NTS cells; however, consistent with the findings of Rosen and Di Lorenzo (2009), paired-pulse attenuation was more prominent than paired-pulse enhancement. Paired-pulse stimulation of the CT nerve was analyzed in 81 cells, including 58 taste-responsive and 23 non-taste-responsive cells from the present study plus 45 cells from a previous study of CT responses in the NTS (Rosen and Di Lorenzo 2009). Paired-pulse attenuation was observed in 53 cells (66%) including taste-responsive (n = 37) and non-taste-responsive (n = 16) cells. Ten cells (12%) showed paired-pulse enhancement without attenuation at any IPI. Of these cells, 7 were taste-responsive and 3 were non-taste-responsive. In addition, 9 cells (11%; 8 taste-responsive, 1 non-taste-responsive) showed both enhancement and attenuation at different IPIs. Nine cells (11%; 6 taste-responsive, 3 non-taste-responsive) showed neither attenuation nor enhancement to paired-pulse stimulation. As in previous work (Rosen and Di Lorenzo 2009), we found that the time course of paired-pulse attenuation in taste-responsive cells in the NTS generally showed either an early peak (10 ms) and a rapid decay or a late peak (50 ms) and a prolonged decay (Fig. 6). Cells with short latencies of CT-evoked responses that showed paired-pulse attenuation had a significantly shorter decay time constant [F(3, 47) = 5.74, P < 0.01] and peak time of attenuation [F(3, 52) = 19.89, P < 0.01] compared with cells with longer CT-evoked latencies (see Fig. 7). Cells with short latencies of CT-evoked responses therefore followed CT input with the highest fidelity compared with cells with longer latencies of CT-evoked responses. All cells with long latencies of CT-evoked responses showed paired-pulse attenuation.
Fig. 6.
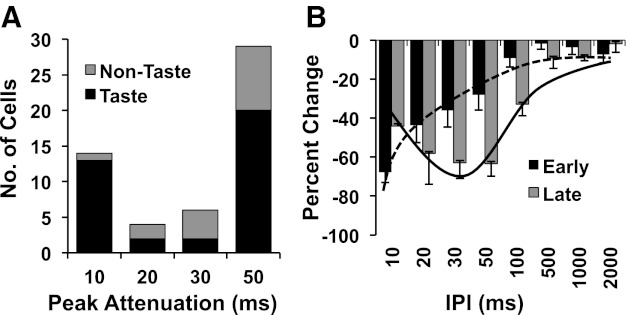
Time course of paired-pulse attenuation in cells that showed early and late peak attenuation (n = 102). A: bimodal distribution of peak attenuation with modes at interpulse interval (IPI) of 10 ms and 50 ms. B: time course of attenuation in cells with early peak attenuation (≤20 ms) and late attenuation (≥30 ms).
Fig. 7.
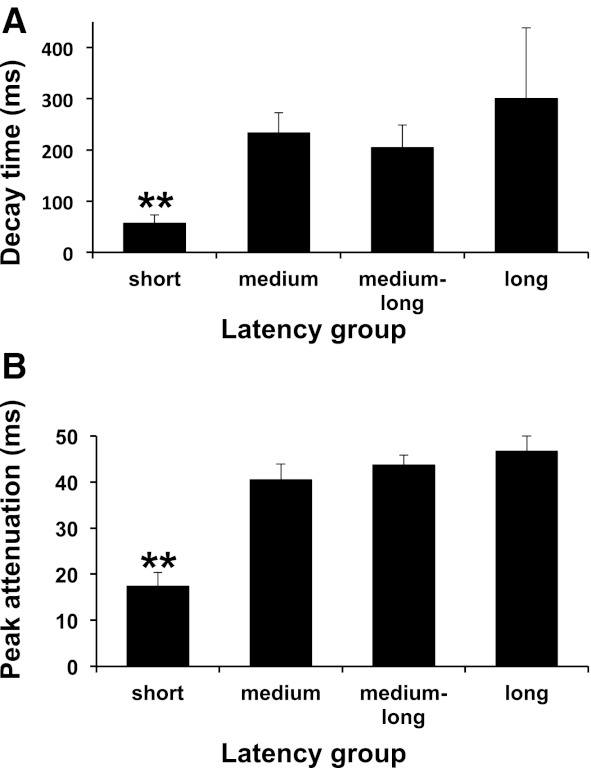
A: mean + SE decay time in each latency group for cells that showed paired-pulse attenuation. B: mean + SE peak attenuation time in each latency group for cells that showed paired-pulse attenuation. Cells in the short-latency group that showed paired-pulse attenuation had significantly shorter decay time constants and peak attenuation times compared with cells in the medium-, medium-long-, and long-latency groups. **Short-latency groups are significantly different from all other groups with P < 0.01.
Location of NTS cells.
The locations of 36 NTS cells (28 taste-responsive; 8 non-taste-responsive) were reconstructed after histological analysis (see Fig. 8). The majority of cells were located in the rostral central and rostral lateral subdivisions. There were no differences in the locations of taste-responsive and non-taste-responsive cells that showed evoked responses to CT stimulation.
Fig. 8.
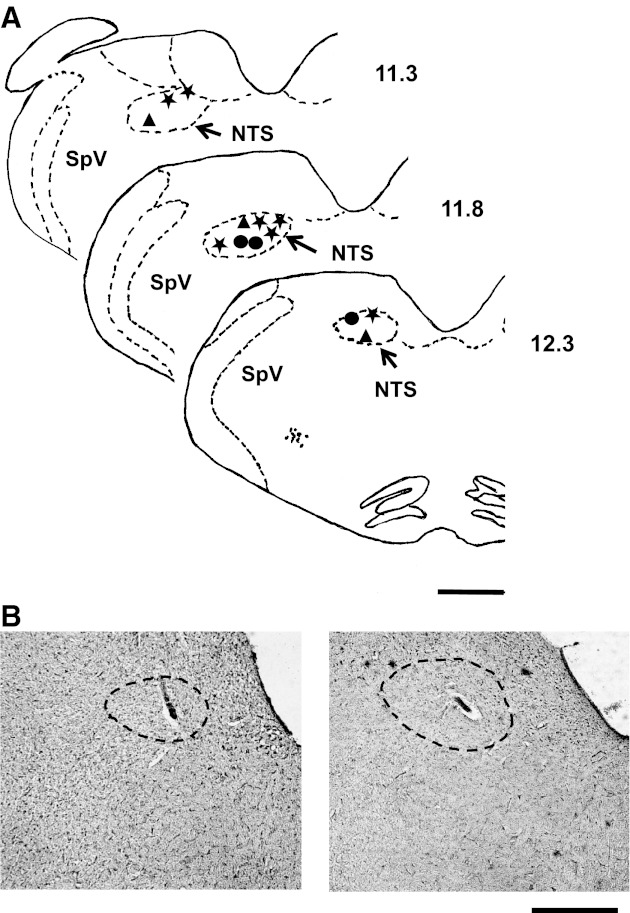
Location of cells recorded from the rostral NTS. A: illustration of coronal sections of the medulla showing the location of electrolytic lesions. ★, Taste-responsive cells; ▲, taste-responsive and non-taste-responsive cells; ●, non-taste-responsive cells. Numbers to right of each section indicate distance caudal to bregma. SpV, spinal nucleus of the trigeminal nerve. B: photomicrographs of representative lesions in the NTS. Dashed line indicates the border of the NTS. Bars at bottom right indicate 1.0 mm.
DISCUSSION
Electrophysiological responses to CT nerve and taste stimulation were simultaneously recorded from pairs or small groups of cells in the NTS of anesthetized rats. Four groups of cells with similar latencies of CT-evoked responses, each showing successively longer latencies of response to CT stimulation, were identified. These groups were labeled as short, medium, medium-long, and long latency. The separation of the average latency of CT-evoked responses by ∼8–12 ms across these latency groups suggests that CT input may activate the NTS as rhythmic waves or pulses of excitation. Consistent with earlier work (Rosen and Di Lorenzo 2009; Rosen et al. 2010), cells with longer latencies to CT stimulation were broadly tuned while cells with short latencies to CT stimulation were either broadly or narrowly tuned across taste qualities. Evidence of functional connectivity among NTS cells, provided by analyses of CCFs, suggested that CT nerve input is processed by the NTS in a well-organized spatiotemporal network. One of the most prominent features of this network was an abundance of reciprocal excitation, especially but not exclusively among cells with short-latency CT-evoked responses. There was also evidence that cells with excitatory interconnections showed positively correlated taste response profiles, while, conversely, cells with inhibitory interconnections showed negatively correlated taste response profiles.
Input from CT nerve activates different groups of NTS cells at different times.
The present results suggested the existence of separate groups of cells with successively longer latencies of response to CT nerve stimulation ranging from 2 ms to 35 ms. For cells in the short-latency group, the mean latency of CT-evoked response (mean = 3.8 ± 0.2 ms) was nearly identical to the mean latency of CT-evoked response for NTS cells with monosynaptic connectivity with the CT nerve (4.3 ± 1.4 ms) recorded in vitro by Wang and Bradley (2010). This finding suggests that short-latency cells received monosynaptic CT input. However, this does not preclude the possibility that these cells also receive centrifugal input. In fact, it has been shown that about a third of NTS-parabrachial nucleus (PbN) relay neurons in fact do receive centrifugal input (Di Lorenzo and Monroe 1995). Cells in medium-, medium-long-, and long-latency groups may receive their input either from locally projecting interneurons (Davis and Kream 1993; Gill et al. 1999; Lasiter and Kachele 1988; Whitehead et al. 1993) or from structures outside of the NTS. Any one structure or combination of structures providing descending projections to the NTS could conceivably receive information from the NTS that is then processed and projected back to cells in longer-latency groups (see Lundy and Norgren 2004 for a review). This sort of top-down arrangement would add functional distinctions to cells in various latency groups. For example, it could be that cells in one latency group send input upstream to the PbN while cells in another group project downstream to the reticular formation. Consistent with this idea is the observation that these two projections are known to arise from separate populations of cells (Halsell et al. 1996).
Several additional potential explanations for the wide variation in the latencies of CT-evoked responses and for the regularity in the latency “jump” between groups should be considered. For example, it is possible that differences in conduction velocity of CT nerve fibers may account for some of the differences in the CT-evoked response latency. It is also possible, though unlikely, that the large variations in CT-evoked response latencies reflect the anatomical and/or physiological characteristics of incoming CT fibers, which vary in diameter (Whitehead 1986) and conduction velocity (Matsuo et al. 1995). However, the mean conduction velocity of CT fibers is too fast to account for substantial latency differences between NTS cells. Moreover, neither of these variables can account for the relatively large differences in latency to CT stimulation and the near quantum jump in latencies across latency groups that were observed. It is also unlikely that differences in the effectiveness of the CT stimulation across rats could account for CT-evoked response latencies, since cells with widely different latencies were sometimes recorded simultaneously from the same tetrode.
Analyses of functional connections among NTS cells.
In the present study, the presence of significant peaks or troughs in the CCFs calculated for pairs of cells was taken as evidence of functional connectivity. The distinction between “functional connectivity” and “synaptic connectivity” should be clearly kept in mind when evaluating the present results. That is, synaptic connectivity may or may not produce significant peaks or troughs in the CCFs (Perkel et al. 1967), so the CCF cannot be used as the sole piece of evidence for actual connections between cells. On the other hand, by subtracting the CCF produced by the shift predictor (Averbeck and Lee 2004; Katz et al. 2002; Perkel et al. 1967), many investigators have confidently asserted the existence of “functional” connections between cells. At the very least, significant peaks or troughs in the CCFs can reveal temporal relationships between the firing patterns of two cells, regardless of the origin of these relationships. In the study of the taste system, for example, analyses of CCFs calculated from activity in simultaneously recorded pairs of cells in the NTS (Adachi et al. 1989), PbN (Yamada et al. 1990), and cortex (Nakamura and Ogawa 1997) have shown that taste-responsive cells that share similar response profiles across taste qualities tend to have significant peaks in their CCFs. These findings agree with the present data, in which it was shown that cells with evidence for reciprocal excitation had significantly positive correlations of their taste responses and cells with evidence for reciprocal inhibitory interactions had significantly negative correlations of their taste responses. This result is consistent with the idea that taste cells in the NTS are organized into taste-specific cell ensembles, proposed previously (Rosen et al. 2010).
Mutual inhibition between parallel, taste stimulus-specific neural assemblies was predicted by our previously described network model of the NTS (Rosen et al. 2010). That model successfully reproduced the latencies to CT nerve stimulation among cell types and their temporal patterns of responses to simulated “taste” input. Figure 9 shows a diagram of the functional connections that we found and their correspondence to various stimulus-specific cell assemblies. Here it is clear that the present data only partially support the cell assembly model proposed previously (Rosen et al. 2010). Most importantly, we did not find inhibition among short-latency cells (the most narrowly tuned), either within or across stimulus-specific assemblies, as had been predicted (Rosen et al. 2010). Instead, mutual excitation dominated the connections found among cells in this group regardless of best stimulus type. Some evidence of interassembly inhibition was observed across stimulus-specific assemblies only in cells with longer latencies of CT-evoked responses. It is possible that our recording methods precluded the detection of interassembly connections, since we could only identify cells that were physically near one another. Given the evidence of a potential chemotopic separation of stimulus-specific cell types in the NTS (Harrer and Travers 1996), it is likely that connections between stimulus-specific assemblies span a longer distance than our tetrodes could cover. Furthermore, the chemotopic separation of sucrose- and quinine-related c-fos activation of NTS cells reported by Harrer and Travers (1996) was not sensitive to the generally broad tuning of NTS cells that was found here and in a recent study of NTS taste responses recorded from the awake rat (Roussin et al. 2012). Thus the evidence for stimulus-specific modules appears inconclusive.
Fig. 9.
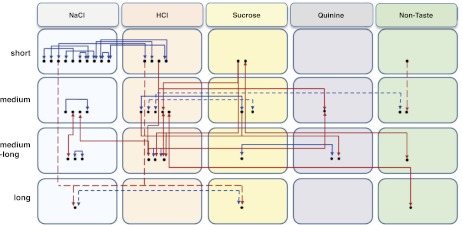
Model circuit diagram representing NTS functional connectivity superimposed on a stimulus-specific cell assembly model. Cells are organized into assemblies identified by their best stimulus. Black dots indicate cells. Solid lines connecting cells indicate excitatory connections; dashed lines indicate inhibitory connections. Arrows at the end of each line indicate the direction of the connection. Blue lines show connections within a latency group; red lines show connections across latency groups.
Interaction of latency differences and functional connectivity.
Analyses of functional interconnections among latency groups suggest a complex sequence of processing as the effects of CT stimulation are expressed and propagated by NTS cells at different times. To illustrate this point, the inputs and outputs of NTS cells in the various latency groups were plotted along a timeline that reflected both the latency of the evoked response to CT stimulation and the lag in the peak or trough of the CCF between cells in each latency group. The results are shown in Fig. 10. In this figure, each column of filled circles represents the activity of a given latency group. The average time at which CT stimulation at t = 0 evokes a response in the cells for each latency group is signified by a red filled circle. Excitatory interconnections within or among groups are shown as red arrows; inhibitory interactions are shown as dashed blue arrows. In effect, this analysis shows the sequence of neuronal interactions as the effects of CT stimulation are registered and disseminated across cells in the NTS. For example, in the case of the short-latency group, CT stimulation evokes a response within 2–3 ms, indicated by a red circle in the short-latency group column. At ∼5 ms after CT stimulation many cells in this group show reciprocal excitation. At ∼10 ms after CT stimulation, some cells in the short-latency group inhibit firing in some cells in the medium- and long-latency groups. At ∼12 ms after CT nerve stimulation, cells in the medium-latency group show a CT-evoked response as well as evidence of a reciprocal excitatory connection with some cells in the short-latency group. At approximately the same time, cells in the short-latency group show more evidence of reciprocal excitation. At ∼14 ms, some cells in the short-latency group excite cells in the medium-long-latency group.
Fig. 10.
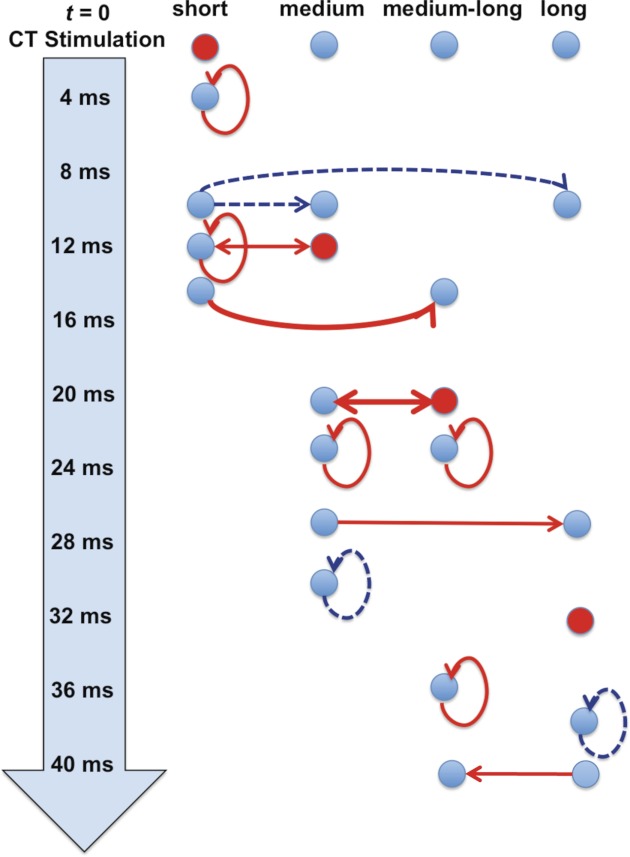
Timeline of proposed interactions among cells in different latency groups. Time is indicated by the arrow at left. At t = 0 the CT nerve is stimulated. Each column represents cells in a particular latency group. Placement along the timeline is approximate and meant to capture the average times of responses and/or interactions for all or some of the cells in each latency group. Blue circles are placed along the timeline at points where some cells in that latency group either contribute or receive activation. Red circles are placed at the mean time where cells in that latency group show evoked responses to CT nerve stimulation. Functional connections among cells within or across latency groups are indicated by lines connecting circles. The placement of those connections was determined by the average lag time of the peaks in the CCFs for each latency group. Solid red lines indicate excitatory connections; dashed blue lines indicate inhibitory connections. Each CT-evoked response initiates recurrent excitation among 1 or more groups of cells. See text for details.
Obviously, the results shown in Fig. 10 reveal a set of complex interactions among NTS cells that show evoked responses to CT nerve stimulation; however, some overarching patterns are apparent. For example, these data suggest that there is an abundance of reciprocal excitatory connections that are activated by CT input each time a group of cells respond to CT stimulation. For example, cells with the shortest latencies of CT-evoked responses, and the most vigorous taste responses, show reciprocal excitatory interconnections with other short-latency cells very early on. So too do the later incoming CT-evoked responses in the medium- and medium-long-latency groups initiate reciprocal excitation. This type of neuronal interaction likely produces a reverberation and may amplify the incoming signal. In addition to reciprocal excitatory connections with other short-latency cells, short-latency cells also show inhibitory connections directed at long-latency cells. This latter group also shows evidence of reciprocal inhibitory interactions. Not surprisingly, these cells show the smallest response magnitudes to taste stimuli compared with neurons in other latency groups. In all, the functional implication of the fact that a single pulse of stimulation of the CT nerve activates NTS cells at different times over ∼40 ms is that information arrives in the NTS in rhythmic pulses or waves directed at separate groups of cells.
Functional differences among cells in different latency groups.
The abundance of reciprocal excitatory connectivity among cells in the short-latency group may account for the higher selectivity and response magnitudes in these cells. This result is consistent with previous studies that have reported amplified taste responses in the NTS compared with those recorded from the CT nerve (Doetsch and Erickson 1970; Ganchrow and Erickson 1970; Verhagen et al. 2003). The present data suggest that this amplification may occur at the earliest stages of processing by cells that respond with the shortest latency to CT stimulation. Given data in the literature suggesting that NTS cells with the largest taste responses relay information directly to the PbN (Monroe and Di Lorenzo 1995), it is tempting to suggest that cells in the short-latency group are indeed NTS-PbN relay cells. Obviously, further experiments are necessary to verify this conjecture.
Intranuclear excitation has also been observed in the caudal NTS (Kawai and Senba 1996; Negishi and Kawai 2011) and is thought to underlie reverberation of the incoming signal. Negishi and Kawai (2011) reported that the caudal NTS is organized into geometric and functional lamina where the dorsal subnucleus is excitatory and the ventral subnucleus is a balance between excitation and inhibition. In the rostral NTS, anatomical studies have shown that cells that receive direct CT input are located in the dorsomedial NTS (Whitehead 1988) while cells that project downstream are located more ventral (Halsell et al. 1996), suggesting an analogous segregation of function. However, we did not discern any anatomical distinctions between cells in the various latency groups in the present study, so our data do not speak to a spatial segregation of excitatory and excitatory-inhibitory networks. Moreover, most of our recordings were from tetrodes, where two or more cells, sometimes from different latency groups, were recorded from the same location.
NTS cells that react to CT stimulation with long latencies may refine and stabilize the temporal pattern of CT input. Specifically, the relatively high prevalence of paired-pulse attenuation and longer inhibitory time courses among cells in medium-, medium-long-, and long-latency groups suggests that these cells filter high-frequency, potentially noisy, CT input. In effect, the temporal pattern of activity from the CT nerve is sculpted by the sluggish reaction to an incoming spike train and the long-lasting recurrent attenuation. This attenuation may be the result of recurrent inhibition or, alternatively, frequency-dependent synaptic depression, as has been documented in the NTS (Wang and Bradley 2010). Furthermore, because cells with successively longer latencies of CT-evoked responses are less selective across taste qualities, i.e., are more broadly tuned, than cells with the shortest latencies, they may be especially competent at transmitting information using a temporal code. Related to this point, previous work has shown that more broadly tuned cells are especially likely to use spike timing to signal taste quality (Di Lorenzo and Victor 2003; Di Lorenzo et al. 2009).
Caveats, conclusions, and implications.
Results of the present study must be considered in the context of the limitations of the techniques used for both data collection and analysis. In particular, since tetrodes were used to record NTS cells, the pairs or small groups of cells were necessarily in close physical proximity to each other. Long-range interactions were therefore predictably not included in the conceptualization of the circuitry that was advanced by the present data. This might be particularly worrisome in the case of inhibitory connections. That is, it is well known that GABAergic inhibitory synapses are abundant in the NTS and yet relatively few of the functional interconnections that were identified here were inhibitory. This might imply that inhibitory interconnections arise from distant sources, or, alternatively, this might reflect a weakness in the ability of cross-correlation analyses to detect inhibitory connectivity. In fact, although CCFs have been used widely to imply functional connectivity in many experimental contexts, it is not a perfect method for doing so (see Stevenson et al. 2008 for a critique of CCFs as an analytical tool).
Another interesting observation that was common to the present and previous studies (Rosen et al. 2010) is that a subset of NTS cells that showed CT-evoked responses did not respond to taste stimuli. A likely possibility is that these cells may be silenced by anesthesia such that they may serve other functions in the awake animal. In that context, it is interesting to note that recent recordings from NTS cells in the awake, freely licking rat have shown that there are a variety of cell types, in addition to taste-responsive cells, in the NTS (Roussin et al. 2012).
In conclusion, the present data paint a picture of the functional circuitry of the NTS as it reacts to input from the CT nerve and provide some clues about how this circuitry intersects with taste processing. Specifically, evidence suggests that CT input initiates intranuclear excitatory interconnections that support signal amplification, beginning with cells that produce the most robust and stimulus-specific taste responses.
GRANTS
This work was funded by National Institute on Deafness and Other Communication Disorders Grant RO1-DC-006914 to P. M. Di Lorenzo.
DISCLOSURES
No conflicts of interest, financial or otherwise, are declared by the author(s).
AUTHOR CONTRIBUTIONS
Author contributions: A.M.R. and P.M.D. conception and design of research; A.M.R. performed experiments; A.M.R. and P.M.D. analyzed data; A.M.R. and P.M.D. interpreted results of experiments; A.M.R. and P.M.D. prepared figures; A.M.R. drafted manuscript; A.M.R. and P.M.D. edited and revised manuscript; A.M.R. and P.M.D. approved final version of manuscript.
ACKNOWLEDGMENTS
This work was done in partial fulfillment of the PhD degree for A. M. Rosen.
Present address of A. M. Rosen: Columbia University Medical Center, 1051 Riverside Dr., Kolb Annex, Unit 87, Room 155, New York, NY 10032.
REFERENCES
- Abeles M. Quantification, smoothing, and confidence limits for single-units' histograms. J Neurosci Methods 5: 317–325, 1982 [DOI] [PubMed] [Google Scholar]
- Adachi M, Oshima T, Yamada S, Satoh T. Cross-correlation analysis of taste neuron pairs in rat solitary tract nucleus. J Neurophysiol 62: 501–509, 1989 [DOI] [PubMed] [Google Scholar]
- Averbeck BB, Lee D. Coding and transmission of information by neural ensembles. Trends Neurosci 27: 225–230, 2004 [DOI] [PubMed] [Google Scholar]
- Chen JY, Victor JD, Di Lorenzo PM. Temporal coding of intensity of NaCl and HCl in the nucleus of the solitary tract of the rat. J Neurophysiol 105: 697–711, 2011 [DOI] [PMC free article] [PubMed] [Google Scholar]
- Davis BJ, Kream RM. Distribution of tachykinin- and opioid-expressing neurons in the hamster solitary nucleus: an immuno- and in situ hybridization histochemical study. Brain Res 616: 6–16, 1993 [DOI] [PubMed] [Google Scholar]
- Di Lorenzo PM, Chen JY, Victor JD. Quality time: representation of a multidimensional sensory domain through temporal coding. J Neurosci 29: 9227–9238, 2009 [DOI] [PMC free article] [PubMed] [Google Scholar]
- Di Lorenzo PM, Lemon CH, Reich CG. Dynamic coding of taste stimuli in the brainstem: effects of brief pulses of taste stimuli on subsequent taste responses. J Neurosci 23: 8893–8902, 2003 [DOI] [PMC free article] [PubMed] [Google Scholar]
- Di Lorenzo PM, Monroe S. Corticofugal influence on taste responses in the nucleus of the solitary tract in the rat. J Neurophysiol 74: 258–272, 1995 [DOI] [PubMed] [Google Scholar]
- Di Lorenzo PM, Victor JD. Taste response variability and temporal coding in the nucleus of the solitary tract of the rat. J Neurophysiol 90: 1418–1431, 2003 [DOI] [PubMed] [Google Scholar]
- Di Lorenzo PM, Victor JD. Neural coding mechanisms for flow rate in taste-responsive cells in the nucleus of the solitary tract of the rat. J Neurophysiol 97: 1857–1861, 2007 [DOI] [PMC free article] [PubMed] [Google Scholar]
- Doetsch GS, Erickson RP. Synaptic processing of taste-quality information in the nucleus tractus solitarius of the rat. J Neurophysiol 33: 490–507, 1970 [DOI] [PubMed] [Google Scholar]
- Doyle MW, Andresen MC. Reliability of monosynaptic sensory transmission in brain stem neurons in vitro. J Neurophysiol 85: 2213–2223, 2001 [DOI] [PubMed] [Google Scholar]
- Friedrich R, Laurent G. Dynamical optimization of odor representations in the olfactory bulb by slow temporal patterning of mitral cell activity. Science 291: 889–894, 2001 [DOI] [PubMed] [Google Scholar]
- Ganchrow JR, Erickson RP. Neural correlates of gustatory intensity and quality. J Neurophysiol 33: 768–783, 1970 [DOI] [PubMed] [Google Scholar]
- Gill CF, Madden JM, Roberts BP, Evans LD, King MS. A subpopulation of neurons in the rat rostral nucleus of the solitary tract that project to the parabrachial nucleus express glutamate-like immunoreactivity. Brain Res 821: 251–263, 1999 [DOI] [PubMed] [Google Scholar]
- Halsell CB, Travers SP, Travers JB. Ascending and descending projections from the rostral nucleus of the solitary tract originate from separate neuronal populations. Neuroscience 72: 185–197, 1996 [DOI] [PubMed] [Google Scholar]
- Hamos JE, Van Horn SC, Raczkowski D, Uhlrich DJ, Sherman SM. Synaptic connectivity of a local circuit neurone in lateral geniculate nucleus of the cat. Nature 317: 618–621, 1985 [DOI] [PubMed] [Google Scholar]
- Harrer MI, Travers SP. Topographic organization of Fos-like immunoreactivity in the rostral nucleus of the solitary tract evoked by gustatory stimulation with sucrose and quinine. Brain Res 711: 125–137, 1996 [DOI] [PubMed] [Google Scholar]
- Huang CL, Larue DT, Winer JA. GABAergic organization of the cat medial geniculate body. J Comp Neurol 415: 368–392, 1999 [PubMed] [Google Scholar]
- Katz DB, Nicolelis MA, Simon SA. Gustatory processing is dynamic and distributed. Curr Opin Neurobiol 12: 448–454, 2002 [DOI] [PubMed] [Google Scholar]
- Kawai Y, Senba E. Organization of excitatory and inhibitory local networks in the caudal nucleus of tractus solitarius of rats revealed in in vitro slice preparation. J Comp Neurol 373: 309–321, 1996 [DOI] [PubMed] [Google Scholar]
- Kay LM, Stopfer M. Information processing in the olfactory systems of insects and vertebrates. Semin Cell Dev Biol 17: 433–442, 2006 [DOI] [PubMed] [Google Scholar]
- Lasiter PS, Kachele DL. Organization of GABA and GABA-transaminase containing neurons in the gustatory zone of the nucleus of the solitary tract. Brain Res Bull 21: 623–636, 1988 [DOI] [PubMed] [Google Scholar]
- Lemon CH, Di Lorenzo PM. Effects of electrical stimulation of the chorda tympani nerve on taste responses in the nucleus of the solitary tract. J Neurophysiol 88: 2477–2489, 2002 [DOI] [PubMed] [Google Scholar]
- Lindstrom S. Synaptic organization of inhibitory pathways to principal cells in the lateral geniculate nucleus of the cat. Brain Res 234: 447–453, 1982 [DOI] [PubMed] [Google Scholar]
- Lundy RF, Jr, Norgren R. Gustatory system. In: The Rat Nervous System (3rd ed.), edited by Paxinos G. San Diego, CA: Elsevier Academic, 2004 [Google Scholar]
- Matsuo R, Inoue T, Masuda Y, Nakamura O, Yamauchi Y, Morimoto T. Neural activity of chorda tympani mechanosensitive fibers during licking behavior in rats. Brain Res 689: 289–298, 1995 [DOI] [PubMed] [Google Scholar]
- Melssen WJ, Epping WJ. Detection and estimation of neural connectivity based on crosscorrelation analysis. Biol Cybern 57: 403–414, 1987 [DOI] [PubMed] [Google Scholar]
- Monroe S, Di Lorenzo PM. Taste responses in neurons in the nucleus of the solitary tract that do and do not project to the parabrachial pons. J Neurophysiol 74: 249–257, 1995 [DOI] [PubMed] [Google Scholar]
- Nakamura T, Ogawa H. Neural interaction between cortical taste neurons in rats: a cross-correlation analysis. Chem Senses 22: 517–528, 1997 [DOI] [PubMed] [Google Scholar]
- Negishi Y, Kawai Y. Geometric and functional architecture of visceral sensory microcircuitry. Brain Struct Funct 216: 17–30, 2011 [DOI] [PMC free article] [PubMed] [Google Scholar]
- Ogawa H, Sato M, Yamashita S. Multiple sensitivity of chorda tympani fibres of the rat and hamster to gustatory and thermal stimuli. J Physiol 199: 223–240, 1968 [DOI] [PMC free article] [PubMed] [Google Scholar]
- Perkel DH, Gerstein GL, Moore GP. Neuronal spike trains and stochastic point processes. II. Simultaneous spike trains. Biophys J 7: 419–440, 1967 [DOI] [PMC free article] [PubMed] [Google Scholar]
- Rosen AM, Di Lorenzo PM. Two types of inhibitory influences target different groups of taste-responsive cells in the nucleus of the solitary tract of the rat. Brain Res 1275: 24–32, 2009 [DOI] [PMC free article] [PubMed] [Google Scholar]
- Rosen AM, Sichtig H, Schaffer JD, Di Lorenzo PM. Taste-specific cell assemblies in a biologically informed model of the nucleus of the solitary tract. J Neurophysiol 104: 4–17, 2010 [DOI] [PMC free article] [PubMed] [Google Scholar]
- Roussin AT, Victor JD, Chen JY, Di Lorenzo PM. Variability in responses and temporal coding of tastants of similar quality in the nucleus of the solitary tract of the rat. J Neurophysiol 99: 644–655, 2008 [DOI] [PMC free article] [PubMed] [Google Scholar]
- Roussin AT, D'Agostino AE, Fooden AM, Victor JD, Di Lorenzo PM. Taste coding in the nucleus of the solitary tract of the awake, freely licking rat. J Neurosci 32: 10494–10506, 2012 [DOI] [PMC free article] [PubMed] [Google Scholar]
- Spector AC, Travers SP. The representation of taste quality in the mammalian nervous system. Behav Cogn Neurosci Rev 4: 143–191, 2005 [DOI] [PubMed] [Google Scholar]
- Stevenson IH, Rebesco JM, Miller LE, Körding KP. Inferring functional connections between neurons. Curr Opin Neurobiol 18: 582–588, 2008 [DOI] [PMC free article] [PubMed] [Google Scholar]
- Verhagen JV, Giza BK, Scott TR. Responses to taste stimulation in the ventroposteromedial nucleus of the thalamus in rats. J Neurophysiol 28: 265–275, 2003 [DOI] [PubMed] [Google Scholar]
- Wang M, Bradley RM. Synaptic characteristics of rostral nucleus of the solitary tract neurons with input from the chorda tympani and glossopharyngeal nerves. Brain Res 1328: 71–78, 2010 [DOI] [PMC free article] [PubMed] [Google Scholar]
- Whitehead MC. Anatomy of the gustatory system in the hamster: synaptology of facial afferent terminals in the solitary nucleus. J Comp Neurol 244: 72–85, 1986 [DOI] [PubMed] [Google Scholar]
- Whitehead MC. Neuronal architecture of the nucleus of the solitary tract in the hamster. J Comp Neurol 276: 547–572, 1988 [DOI] [PubMed] [Google Scholar]
- Whitehead MC, McPheeters M, Savoy LD, Frank ME. Morphological types of neurons located at taste-responsive sites in the solitary nucleus of the hamster. Microsc Res Tech 26: 245–259, 1993 [DOI] [PubMed] [Google Scholar]
- Yamada S, Oshima T, Oda H, Adachi M, Satoh T. Synchronized discharge of taste neurons recorded simultaneously in rat parabrachial nucleus. J Neurophysiol 63: 294–302, 1990 [DOI] [PubMed] [Google Scholar]


