

Abstract
We sequenced reduced representation libraries by means of Illumina technology to generate over 1.5 Mb of orthologous sequence from a representative of each of the four extant gibbon genera (Nomascus, Hylobates, Symphalangus, and Hoolock). We used these data to assess the evolutionary relationships between the genera by evaluating the likelihoods of all possible bifurcating trees involving the four taxa. Our analyses provide weak support for a tree with Nomascus and Hylobates as sister taxa and with Hoolock and Symphalangus as sister taxa, though bootstrap resampling suggests that other phylogenetic scenarios are also possible. This uncertainty is due to short internal branch lengths and extensive incomplete lineage sorting across taxa. The true phylogenetic relationships among gibbon genera will likely require a more extensive whole-genome sequence analysis.
Introduction
Gibbons (family Hylobatidae) are small, arboreal apes found in South, Southeast, and East Asia. They are the sister group to humans and the great apes, and share a common ancestor with other hominoids roughly 16–20 Mya [1]–[2]. Gibbons are divided into four well-recognized genera (Hylobates, Nomascus, Symphalangus and Hoolock) that have very different karyotypes and diploid chromosome counts which vary from 38 to 52.
Despite a plethora of studies utilizing a range of different traits (e.g., vocalization, morphology, karyotype, mitochondrial DNA (mtDNA) variation, nuclear sequence variation), the phylogenetic relationships between gibbon species and genera remain unresolved (see Figure 1). Studies based on morphological and vocal traits have tended to support either Nomascus and Hylobates [3]–[4] or Hoolock and Hylobates [4]–[5] as sister taxa, while a study based on chromosomal rearrangements placed Nomascus and Symphalangus as sister taxa [6]. Most mtDNA studies have supported Hylobates and Hoolock as sister groups [2], [7], [8] but Takacs and colleagues [9] found support for a Symphalangus and Hylobates pairing. Studies of nuclear sequence variation (with or without mtDNA variation) have also been inconsistent, with Symphalangus and Hylobates [10] and Symphalangus and Nomascus [11]–[12] identified as possible sister taxa. Together, these studies have also differed in their identification of the most basal clade, with Symphalangus, Hoolock and Nomascus all proposed as outgroups to the other genera [3], [6], [7].
Figure 1. Schematic of different phylogenetic trees for the four gibbon genera.
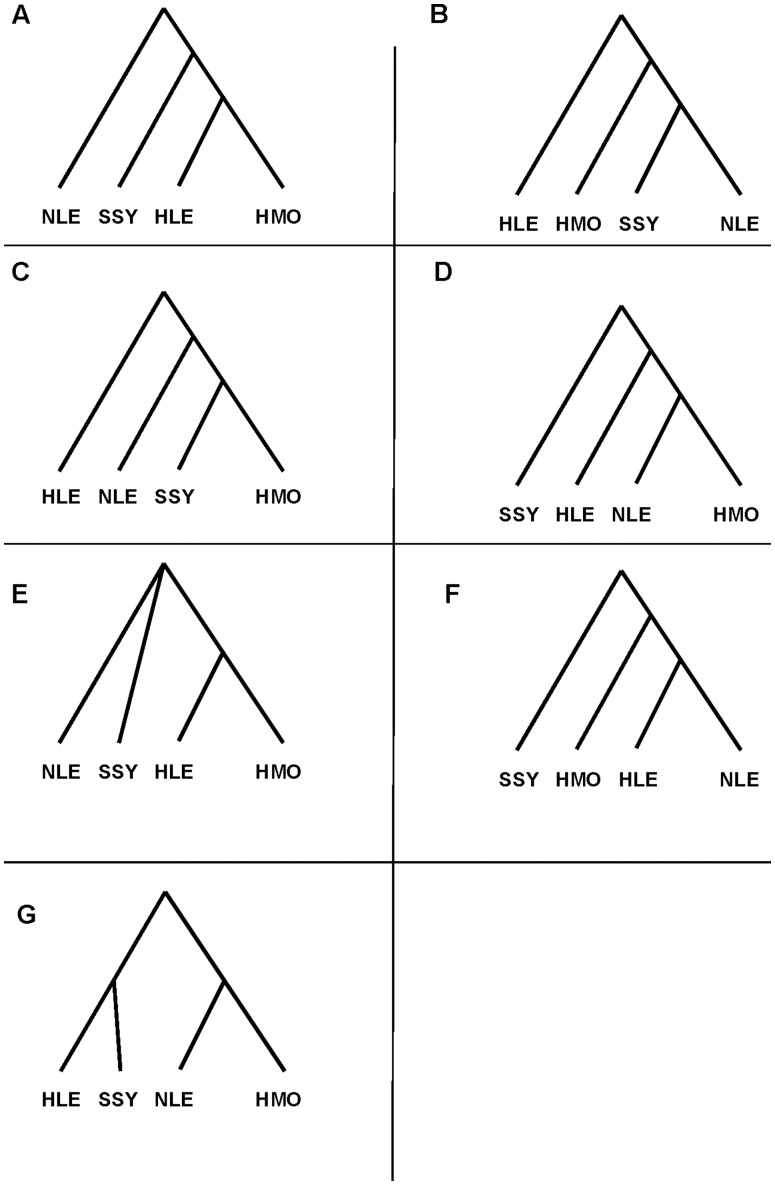
The trees represented in box A to F have been proposed as the results of previous studies and can be compared with the maximum-likelihood tree found in this study (G). (A) cf. [2], [7], [8], (B) cf. [6], [11], [12], (C) cf. [9], [10], (D) cf. [3], (E) cf. [4], [5], (F) cf. [28].
Part of the difficulty in assessing the true phylogenetic relationships between the four gibbon genera is that the initial time of divergence between the groups happened over a very short period of time. Due to incomplete lineage sorting, different genealogical trees will be ‘correct’ over different parts of the genome (i.e., gene trees are not necessarily concordant with species trees). So, for example, while it is now well established that our closest living relatives are chimpanzees and bonobos [13]–[15], there is still a small fraction of the genome where gorillas [14]–[15] or even orangutans [16] are our closest living relatives. In general, the true species tree and estimates of demographic parameters can only be recovered by jointly analyzing genetic data across many evolutionarily independent regions of the genome. While next-generation sequencing has greatly reduced the cost of gathering DNA sequence data in recent years, it is not so easy to harness this technology to generate orthologous data from taxa without a published reference genome sequence. (The draft gibbon genome sequence, while publicly available, is embargoed under the Ft. Lauderdale meeting agreement.) So, while sequencing whole genomes is now commonplace in humans [17] and in species with well-developed genomic resources [18]–[20], the largest extant study of sequence variation in the four gibbon genera looked at only 60 Kb of orthologous sequence data [12].
In this paper, we address the question of gibbon phylogeny by sequencing reduced representation libraries [21] to generate over 1.6 Mb of aligned sequence data from a single representative of each gibbon genus (Table 1). In brief, we digest genomic DNA using a restriction enzyme, size select the fragments, then sequence these fragments using next-generation sequencing (Illumina GAII). We then clustered sequences from different individuals to identify orthologs for downstream analyses. The same general approach can be used to analyze sequence data from non-model organism species without published genome sequences.
Table 1. Description of the individuals used in this study.
| Scientific name | Individual | ISIS # | Gender | Abbreviation |
| Nomascus leucogenys | Asia | NL605 | Female | NLE |
| Symphalangus syndactylus | Monty | SS910 | Male | SSY |
| Hylobates moloch | Lionel | HMO894 | Male | HMO |
| Hoolock leuconedys | Drew | HL307 | Female | HLE |
Results and Discussion
The Divergence between Gibbon Genera is Comparable with Levels of Divergence between Humans and Chimpanzees
Our clustering analyses produced a total of 30,484 reads that mapped uniquely to the single-copy portion of the human genome, with at least 20X coverage from each sample. We focus the remainder of our analyses to the 28,969 reads (1.59 Mb total length) that map to the human autosomes, since diploidy allows us to calculate both measures of genetic variation and genetic differentiation from our data.
Table 2 displays the average frequency of pairwise differences (π, cf. [22]) both within (πw) and between (πb) individuals. Both πw and πb were generally smaller than those reported in an earlier study using the same samples [12]. Since the current study is several times larger than the largest previous one, it is possible that the π values presented here are more accurate estimates of the true values. Alternatively, differences in the local sequence context of this study compared with our previous one [12] might explain the differences in observed levels of genetic diversity and genetic differentiation. However, there are two additional reasons why our methods might lead to systematic underestimates of πw and πb: Orthologous regions with the highest levels of diversity/divergence may not be placed in the same cluster, and polymorphisms in the RsaI restriction site can cause allelic dropout, leading to loss of heterozygosity. Estimates from comparable human data suggest that allelic dropout leads to a ∼3% reduction in estimates of π [21].
Table 2. Average frequency of pairwise differences (%) within (πw) and between (πb) gibbon samples.
| HLE | NLE | SSY | HMO | |
| HLE | 0.106 | 1.198 | 1.176 | 1.197 |
| NLE | 0.204 | 1.228 | 1.236 | |
| SSY | 0.151 | 1.225 | ||
| HMO | 0.174 |
If we take the π values at face value, then divergence between gibbon genera is on par with the levels of divergence between humans and chimpanzees [23], with sequence divergence times of 6–7 Mya, comparable to what was estimated from mtDNA [2]. Within-species diversity levels are similar to what has been reported for great apes [24], and slightly higher than what has been found in humans [17].
A New Phylogenetic Tree for the Four Gibbon Genera
Next, we used our data to examine the phylogenetic relationships between the four gibbon genera. Assuming evolutionary independence across regions, we used PAML [25] to calculate the most likely bifurcating topology. The maximum-likelihood tree had Hoolock and Symphalangus as sister taxa, and Hylobates and Nomascus as sister taxa (see Figure 1G). We obtained the same maximum-likelihood tree when we concatenated all of the regions together (i.e., no recombination between regions). This tree is different from all the previous trees proposed in the literature. To assess how much confidence we should place in our and other phylogenetic estimates, we bootstrap resampled from 30 to 30,000 regions from our data and tabulated the maximum-likelihood tree (using PAML) for each replicate (Figure 2). Our results suggest that sampling small amounts of data leads to substantial uncertainty in the final estimate. For example, when 300 regions are re-sampled (e.g., approximately 16 Kb of autosomal sequence data), 6 out of the 15 possible tree topologies are the maximum-likelihood tree in over 6% of the replicates. When we re-sample 3,000 or 30,000 regions, we recover the tree in Figure 1G in 42% and 74% of our replicates respectively (Figure 2). Most of the remaining replicates support the second most likely topology, with Hoolock and Nomascus as sister taxa, and Symphalangus and Hylobates as sister taxa. The tree shown in Figure 1G is also supported by a qualitative analysis of parsimony-informative sites (i.e., sites where exactly 2 out of 4 sampled sequences share a derived allele compared with the human reference genome hg19). There are significantly more sites that support Hoolock and Symphalangus as sister taxa (958 sites) than sites that support the other two unrooted trees (882 and 872 sites; p<0.05).
Figure 2. Distribution of the most likely bifurcating tree.
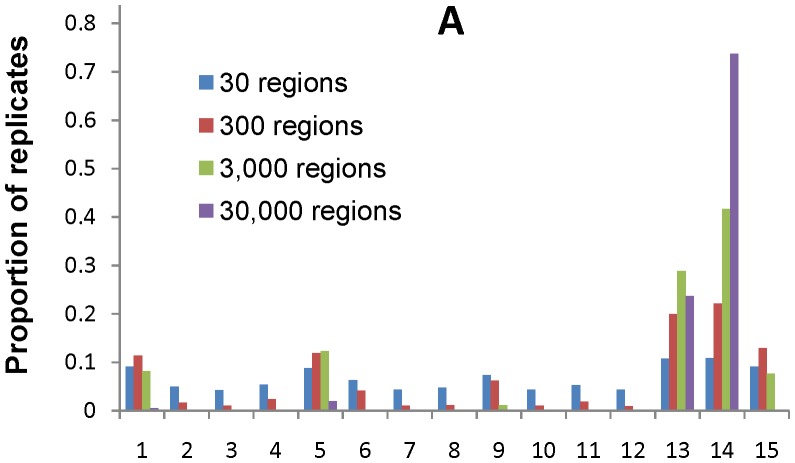
(A) Distributions based on 105 bootstrap replicates for 30, 300, 3,000 and 30,000 autosomal regions. (B) Key describing the bifurcating tree for the x-axis of Figure 2A.
Discordance between gene trees at different genomic locations can arise due to two main causes: incomplete lineage sorting or recurrent mutations at the same nucleotide site (i.e., identity by state mistaken for identity by descent). We performed two additional analyses to assess the relative importance of these two potential explanations. First, we removed all CpG sites (known to have mutation rates ∼10 times higher than the genome-wide average) and repeated our analyses. Again, we found the tree shown in Figure 1G to be the most likely phylogeny. Also, we assessed how often parsimony-informative sites which supported the same phylogeny were found within the same fragment. If these sites were primarily due to recurrent mutation, then we would not expect any enrichment of multiple parsimony informative sites supporting the same phylogeny relative to a null model of random distribution of parsimony-informative sites. We observe a 4-fold enrichment of such ‘clustered’ informative sites, which is highly significant (p<<10−6).
We conclude that incomplete lineage sorting is the primary explanation for the observed patterns of genetic variation. So, while the maximum-likelihood tree obtained in this study must be considered provisional, we should have even less confidence in the phylogenetic trees estimated from previous studies based on smaller genetic data sets. This is particularly true for mtDNA, which due to a lack of intragenic recombination acts as a single genetic locus, and is a particularly poor region for phylogenetic studies in cases where short internal branches cause widespread incomplete lineage sorting.
Conclusions
This study highlights the ability of next-generation sequencing technologies to be used to study patterns of within and between species genetic variation in non-model organisms without a published genome sequence. The protocol used is simple and inexpensive. It belongs to a set of methods using restriction enzyme digestion of target genomes to reduce the complexity of the target [26]. Given the recent decrease in sequencing costs over the past few years, it is now feasible for independent labs to conduct large-scale population genetic and molecular evolutionary studies in taxa without a reference genome sequence [27].
As proof-of-principle, we gathered over 1.5 Mb of orthologous sequence from representatives of all four gibbon genera. We used the data to explore the evolutionary relationships between our samples, and discovered that widespread incomplete lineage sorting makes it difficult to assess the true species tree from the amount of data that we gathered. While precise phylogenetic relationships will eventually be determined from even larger studies (e.g., the ongoing gibbon genome project), we caution that previous studies of gibbon taxonomy based on far less data than this study are likely to be inaccurate.
Materials and Methods
Genomic DNA was isolated from blood from a single representative of each gibbon genus (Table 1). All samples were collected during routine health monitoring by Alan Mootnick, former director of the Gibbon Conservation Center (GCC), and the blood sampling was in keeping with the protocols approved by the GCC’s Animal Care and Use Committee. The GCC’s gibbons are kept in custom outdoor enclosures in Santa Clarita, CA. Each family group is kept in a separate enclosure, and each enclosure has branches and ropes to allow brachiation through the entire space. The gibbons are normally fed 10 times a day with up to 20 different types of food (primarily fruits and vegetables). Specific diets vary by individual need, preference and seasonal availability. The foods are alternated and presented in diverse ways to stimulate natural foraging behaviors and enrich the gibbons’ mental state.
We then constructed reduced representation libraries for each sample following the protocol of Luca and colleagues [21]. The DNA samples were digested by the restriction enzyme RsaI overnight, followed by size selection of fragments in the 70–80 bp range. The targeted DNA fragments were then isolated and purified from gel, and Illumina sequencing libraries were prepared using standard protocols. See [21] for further details. 72 base pair single-end reads were generated on an Illumina GAII, using 4, 3, 2 and 2 flow cell lanes for HLE, NLE, SSY and HMO respectively (see Table 1 for abbreviations). We obtained from 12–52 million sequence clusters from the four samples, with the smallest number coming from HLE.
Given the absence of a published gibbon reference sequence, we implemented a clustering method to categorize all sequence reads across the four samples into independent and discrete bins. We started by excluding reads that did not have at least 35 consecutive bases with PHRED quality scores >20. Then, we took the sample with the least amount of data, HLE, and aligned all HLE reads to each other. A read was put into a cluster if at least one pairwise alignment with a cluster member contained at most three mismatches. Using this criterion, we obtained 476,135 clusters for the HLE sequences. We then queried NLE, SSY and HMO reads against each of the HLE sequence bins and clustered them into the first identified bin with at most five mismatches. Possible overlap with multiple clusters is dealt with later (see below).
Using a mirrored version of the UCSC genome browser, we used BLAT to identify all BHO sequence bins that uniquely aligned to the human reference genome (build 19, commands stepSize = 5, repMatch = 2253). We then removed clusters that fit the following criteria:
Clusters with <20X coverage
Clusters that did not map to the human reference sequence
Multiple clusters that mapped to the same location in the human reference sequence (if the clusters could not be combined)
Clusters with <60 bp of alignment to the human reference sequence
Clusters that aligned to >90 bp of the human reference sequence
Clusters with a second-best alignment that had at least half the sequence match of the best alignment
A total of 30,484 clusters were left, comprising 2,175,349 total bases. For each gibbon, heterozygous alleles were called when a second allele was found in at least 20% of the sequence reads. Positions where third (plus fourth) alleles were found in 20% of the reads were converted to missing data.
To explore potential platform-specific sequencing biases, we plotted the frequency of SNPs as a function of the base position on each read. We find an excess of (apparent) polymorphisms that are located near the beginning and towards the ends of the sequence reads, as well as an increase in uncalled bases towards the ends of the reads (Results not shown). These results are consistent with the known biases associated with restriction enzyme digested reads, as well as the decrease in sequence quality near the end of next-generation sequencing reads. To reduce the effect of these biases on our data analyses, we trim the first 2 and the last 15 bases from each read, leaving 30,484 reads covering a total of 1,668,456 bases.
For each read cluster, we mapped the reads onto the human reference genome (hg19). We then used PAML version 4 [25] to estimate the likelihood of each of the 15 different bifurcating trees using default parameters (and with the hg19 allele as the outgroup). To calculate the likelihoods for each tree using the whole autosomal data set, we multiply the likelihoods for each autosomal read together (i.e., we assume evolutionary independence across regions). Finally, for the bootstrap resampling, we resampled 30–30,000 regions (with replacement) 105 times, multiplying the likelihoods across sampled regions.
Funding Statement
This work was supported by National Institutes of Health (NIH) grants R01 HG005226 to JDW and R01 GM079558 to ADR. LC was supported in part by NIH grant OD011092. The funders had no role in study design, data collection and analysis, decision to publish, or preparation of the manuscript.
References
- 1. Matsudaira K, Ishida T (2010) Phylogenetic relationships and divergence dates of the whole mitochondrial genome sequences among three gibbon genera. Mol Phylogenet Evol 55: 454–459. [DOI] [PubMed] [Google Scholar]
- 2. Van Ngoc T, Mootnick AR, Geissmann T, Li M, Ziegler T, et al. (2010) Mitochondrial evidence for multiple radiations in the evolutionary history of small apes. BMC Evol Biol 10: 74. [DOI] [PMC free article] [PubMed] [Google Scholar]
- 3.Groves CP (1972) Systematics and phylogeny of gibbons. In Gibbon and Siamang, vol. 1. Edited by Rumbaugh DM. Basel, Karger; 1–89.
- 4.Geissmann T (2002) Taxonomy and evolution of gibbons. In Anthropology and primatology into the third millennium: The Centenary Congress of the Zürich Anthropological Institute. Edited by Soligo C, Anzenberger G, Martin RD. New York, Wiley-Liss; 28–31.
- 5. Haimoff EH, Chivers DJ, Gittins SP, Whitten T (1982) A phylogeny of gibbons (Hylobates spp.) based on morphological and behavioural characters. Folia Primatol 39: 213–237. [DOI] [PubMed] [Google Scholar]
- 6. Müller S, Hollatz M, Wienberg J (2003) Chromosomal phylogeny and evolution of gibbons (Hylobatidae). Hum Genet 113: 493–501. [DOI] [PubMed] [Google Scholar]
- 7. Roos C, Geissmann T (2001) Molecular phylogeny of the major hylobatid divisions. Mol Phylogen Evol 19: 486–494. [DOI] [PubMed] [Google Scholar]
- 8. Chatterjee HJ (2006) Phylogeny and biogeography of gibbons: a dispersal-vicariance analysis. Int J Primatol 27: 699–712. [Google Scholar]
- 9. Takacs Z, Morales JC, Geissmann T, Melnick DJ (2005) A complete species-level phylogeny of the Hylobatidae based on mitochondrial ND3-ND4 gene sequences. Mol Phylogenet Evol 36: 456–467. [DOI] [PubMed] [Google Scholar]
- 10. Israfil H, Zehr SM, Mootnick AR, Ruvolo M, Steiper ME (2011) Unresolved molecular phylogenies of gibbons and siamangs (Family: Hylobatidae) based on mitochondrial, Y-linked, and X-linked loci indicate a rapid Miocene radiation or sudden vicariance event. Mol Phylogenet Evol 58: 447–455. [DOI] [PMC free article] [PubMed] [Google Scholar]
- 11.Zehr SM (1999) A nuclear and mitochondrial phylogeny of the lesser apes (Primates, genus Hylobates). PhD thesis. Harvard University, Biological Anthropology.
- 12. Kim SK, Carbone L, Becquet C, Mootnick AR, Li DJ (2011) Patterns of genetic variation within and between gibbon species. Mol Biol Evol 2011 28: 2211–2218. [DOI] [PMC free article] [PubMed] [Google Scholar]
- 13. Ruvolo M (1997) Molecular phylogeny of the hominoids: inferences from multiple independent DNA sequence data sets. Mol Biol Evol 14: 248–265. [DOI] [PubMed] [Google Scholar]
- 14. Satta Y, Klein J, Takahata N (2000) DNA archives and our nearest relative: the trichotomy problem revisited. Mol Phylogenet Evol 14: 259–275. [DOI] [PubMed] [Google Scholar]
- 15. Chen FC, Li WH (2001) Genomic divergences between humans and other hominoids and the effective population size of the common ancestor of humans and chimpanzees. Am J Hum Genet 68: 444–456. [DOI] [PMC free article] [PubMed] [Google Scholar]
- 16. Hobolth A, Dutheil JY, Hawks J, Schierup MH, Mailund T (2011) Incomplete lineage sorting patterns among human, chimpanzee, and orangutan suggest recent orangutan speciation and widespread selection. Genome Res 21: 349–356. [DOI] [PMC free article] [PubMed] [Google Scholar]
- 17. The 1000 Genomes Project Consortium (2010) A map of human genome variation from population-scale sequencing. Nature 467: 1061–1073. [DOI] [PMC free article] [PubMed] [Google Scholar]
- 18. Begun DJ, Holloway AK, Stevens K, Hillier LW, Poh YP, et al. (2007) Population genomics: whole-genome analysis of polymorphism and divergence in Drosophila simulans. PLoS Biol 5: e310. [DOI] [PMC free article] [PubMed] [Google Scholar]
- 19. Clark RM, Schweikert G, Toomajian C, Ossowski S, Zeller G, et al. (2007) Common sequence polymorphisms shaping genetic diversity in Arabidopsis thaliana. Science 317: 338–342. [DOI] [PubMed] [Google Scholar]
- 20. Locke DP, Hillier LW, Warren WC, Worley KC, Nazareth LV, et al. (2011) Comparative and demographic analysis of orang-utan genomes. Nature 469: 529–533. [DOI] [PMC free article] [PubMed] [Google Scholar]
- 21. Luca F, Hudson RR, Witonsky DB, Di Rienzo A (2011) A reduced representation approach to population genetic analyses and applications to human evolution. Genome Res 21: 1087–1098. [DOI] [PMC free article] [PubMed] [Google Scholar]
- 22. Nei M, Li WH (1979) Mathematical model for studying genetic variation in terms of restriction endonucleases. Proc Natl Acad Sci USA 76: 5269–5273. [DOI] [PMC free article] [PubMed] [Google Scholar]
- 23. The Chimpanzee Sequencing, Analysis Consortium (2005) Initial sequence of the chimpanzee genome and comparison with the human genome. Nature 437: 69–87. [DOI] [PubMed] [Google Scholar]
- 24. Fischer A, Pollack J, Thalmann O, Nickel B, Pääbo S (2006) Demographic history and genetic differentiation in apes. Curr Biol 16: 1133–1138. [DOI] [PubMed] [Google Scholar]
- 25. Yang Z (2007) PAML 4: phylogenetic analysis by maximum likelihood. Mol Biol Evol 24: 1586–1591. [DOI] [PubMed] [Google Scholar]
- 26. Davey JW, Hohenlohe PA, Etter PD, Boone JQ, Catchen JM, et al. (2011) Genome-wide genetic marker discovery and genotyping using next-generation sequencing. Nat Rev Genet 12: 499–510. [DOI] [PubMed] [Google Scholar]
- 27. Emerson KJ, Merz CR, Catchen JM, Hohenlohe PA, Cresko WA, et al. (2010) Resolving postglacial phylogeography using high-throughput sequencing. Proc Natl Acad Sci USA 107: 16196–16200. [DOI] [PMC free article] [PubMed] [Google Scholar]
- 28. Meyer TJ, McLain AT, Oldenburg JM, Faulk C, Bourgeois MG, et al. (2012) An Alu-based phylogeny of gibbons (Hylobatidae). Mol Biol Evol 29: 3441–3450. [DOI] [PMC free article] [PubMed] [Google Scholar]