

Abstract
Hyperintense white matter signal abnormalities, also called diffuse excessive high signal intensity (DEHSI), are observed in up to 80% of very preterm infants on T2-weighted MRI scans at term-equivalent age. DEHSI may represent a developmental stage or diffuse microstructural white matter abnormalities. Automated quantitative assessment of DEHSI severity may help resolve this debate and improve neonatal brain tissue segmentation. For T2-weighted sequence without fluid attenuation, the signal intensity distribution of DEHSI greatly overlaps with that of cerebrospinal fluid (CSF) making its detection difficult. Furthermore, signal intensities of T2-weighted images are susceptible to magnetic field inhomogeneity. Increased signal intensities caused by field inhomogeneity may be confused with DEHSI. To overcome these challenges, we propose an algorithm to detect DEHSI using T2 relaxometry, whose reflection of the rapid changes in free water content provides improved distinction between CSF and DEHSI over that of conventional T2-weighted imaging. Moreover, the parametric transverse relaxation time T2 is invulnerable to magnetic field inhomogeneity. We conducted computer simulations to select an optimal detection parameter and to validate the proposed method. We also demonstrated that brain tissue segmentation is further enhanced by incorporating DEHSI detection for both simulated preterm infant brain images and in vivo in very preterm infants imaged at term-equivalent age.
Keywords: White matter signal abnormalities (WMSA), diffuse excessive high signal intensity (DEHSI), T2 relaxometry, brain segmentation, extremely low birth weight infants, magnetic resonance imaging
Introduction
Hyperintense white matter signal abnormalities (WMSA), also called diffuse excessive high signal intensity (DEHSI) in preterm infants, are defined as higher signal intensity in periventricular and subcortical white mater (WM) than in normal unmyelinated WM on T2-weighted images. It was first reported in preterm neonates by Maalouf et al. (1999), and has been observed by other investigators (Counsell et al., 2003a, 2006; Inder, et al., 2003; Woodward et al., 2006; Dyet et al., 2006; Krishnan et al., 2007; Rose et al., 2007; Cheong et. al., 2009; Hagmann et al., 2009; Kidokoro et al., 2011; Skiold et al. 2010; Hart et al., 2010, 2011; de Bruine et al., 2011; Iwata et al., 2012; Jeon et al., 2012). One plausible hypothesis is that DEHSI represents a prematurity-related developmental phenomenon rather than tissue injury, given its high incidence in preterm infants at term-equivalent age (term) – up to 80% in Dyet et al. (2006) and Jeon et al. (2012) and absence after a postmenstrual age of 50 weeks (de Bruine et al., 2011). Further, anterior and posterior periventricular white matter regions, also known as crossroads, exhibit multiple crossing fibers and high content of hydrophilic extracellular matrix that may contribute to the high signal intensity observed on T2-weighted MRI and lower anisotropy on diffusion MRI (Kostovic et al., 2002; Judas et al., 2005). Consistent with this hypothesis, a few investigators have not observed an association between DEHSI and neurodevelopmental impairments (Hart et al., 2011; de Bruine et al., 2011; Jeon et al., 2012). Conversely, it may represent an early stage of white matter injury that has been closely linked with abnormal white matter microstructure at term (Counsell et al., 2006; Cheong et al., 2009) and cognitive impairments up to 9 years of age (Dyet et al., 2006; Iwata et al., 2012). Therefore, accurately revealing the pattern and quantifying the severity of such abnormalities is critical for resolving this debate and potentially identifying high-risk preterm infants that may benefit from neuroprotective and early intervention therapies (Hagmann et al., 2009, Mathur et al., 2010, Keunen et al., 2012).
Qualitative MRI studies have played an important role in evaluating brain development and predicting neurodevelopmental abnormalities. However, qualitative/categorical scales produce poor reliability with longitudinal studies. For example, a study by Mantyla et al. (1997) compared 13 different visual rating scales rating WMSA severity and found inconsistencies among previously published studies. In addition, the restricted range of categorical scales may limit the power of association. For example, Woodward et al. (2006) found a substantial proportion of infants with moderate/severe white matter did not develop severe neurodevelopmental impairments. There is a growing interest in objective quantitative studies (Counsell et al., 2002; Hagmann et al., 2009; Brickman et al., 2011), which are more likely to produce reliable and reproducible indexes and greater study power for abnormality severity.
The most commonly used quantitative approaches are semi-automated, requiring some manual tracing or application of intensity thresholds that are operator-determined based on intensity ranges (Gurol et al., 2006). This approach facilitates manual exclusion of non-WMSA regions such as non-injured white matter, cerebrospinal fluid (CSF), and/or extra-cranial tissues. The use of manual input however introduces subjectivity, resulting in lower reliability. This also increases processing time, further limiting its application in large multi-center studies (Yoshita et al., 2005).
Several investigators have successfully semi-automated/automated WMSA detection in adults. Semi-automated approaches generally involve a manual modification of false WMSA regions (Ramirez et al., 2011). Classification and atlas-based techniques (Swartz et al., 2002; Anbeek, et al., 2004a, 2004b; Hulsey et al., 2012) typically rely on a training set: the classification relies on a manually segmented training set. They may encounter difficulties in some studies due to imaging variations produced by the variability across subjects/centers. Other approaches employed include, intensity thresholding and region growing (Brickman et al., 2011), clustering (Gibson et al., 2010), multispectral segmentation (Maillard et al., 2008; Wang et al., 2012), fuzzy connected segmentation (Wu et al., 2006) and artificial intelligence methods (Admiraal-Behloul et al., 2005). T1-weighted and FLAIR images are the most commonly used sequences for WMSA detection in adults, where CSF is hypointense and distinct from WMSA.
At term-equivalent age, T2-weighted images provide greatest tissue contrast (Counsell et al., 2003c). For T2-weighted sequence without fluid attenuation, DEHSI may appear in the same intensity distribution as CSF (e.g. the signal intensity of DEHSI is fairly close to that of CSF), making the distinction between them difficult (Yu et al., 2010). Furthermore, signal intensities of T2-weighted images are susceptible to magnetic field inhomogeneity. Increased signal intensities in a certain region caused by field inhomogeneity may be confused with DEHSI, introducing errors (Hart et al., 2010).
T2 relaxometry has shown promise in preterm infants in providing additional quantitative information that is not readily discernible on conventional MR imaging (Ferrie et. al., 1999, Counsell et. al., 2003b). It was shown as an objective quantitative measure to assess WM tissue regional variation in preterm infants at term (Hagmann et al., 2009). T2 relaxation time is a physical property of brain water and varies by tissue environment, resulting in tissue contrast. Its reflection of the rapid changes in free water content provides improved distinction between CSF and DEHSI over that of conventional T2-weighted imaging. Moreover, the parametric transverse relaxation time T2 is invulnerable to magnetic field inhomogeneity.
The aim of this study was to develop a fully automated algorithm to detect DEHSI using quantitative T2 relaxometry. We utilized computer simulations to select an optimal detection parameter and to validate our proposed method. We also demonstrated that brain tissue segmentation could be further enhanced by incorporating this DEHSI detection method for both simulated preterm infant brain images and for extremely low birth weight (ELBW; BW ≤ 1000g) infants imaged at term.
Materials and Methods
Subjects
Parental informed consent was obtained for brain MRI scans and the study was institutional review board approved. The study population was derived from a consecutively imaged cohort of 50 ELBW infants without any major congenital anomalies cared for in the NICU of Children’s Memorial Hermann Hospital from May 2007 to July 2009. Their mean (standard deviation (SD)) gestational age was 25.2 (1.7) weeks and mean (SD) postmenstrual age at MRI scan was 38.4 (2.3) weeks.
MRI Acquisition
The scans were performed on a 3 Tesla Philips scanner with use of an eight-channel SENSE-compatible phased array receive head coil. MRI structural data were acquired with a dual echo fast spin-echo sequence to reduce total scan time for both proton density (PD)- and T2-weighted images. Parameters for PD- and T2-weighted images were: TE1 8.75 ms; TE2 175 ms; TR 10000 ms; the imaging matrix 256 × 256 with a field-of-view (FOV) of 180 × 180 mm; slice thickness 2 mm; no gap between slices; flip angle 90°. All infants were transported to the MRI scanner by an experienced neonatal transport nurse after feeding, swaddling and placement of silicone ear plugs (E.A.R. Inc, Boulder, CO) and Natus MiniMuffs (Natus Medical Inc, San Carlos, CA). All scans were completed without sedation and were supervised by a neonatal research nurse and a neonatologist experienced in neonatal MRI.
Quantitative T2 Relaxometry Measurements
The T2 relaxation values are estimated from the early and late echoes (TE1, TE2) according to standard spin-echo procedures assuming a single exponential model (Duncan et. al. 1996):
| (1) |
where S(TE1) and S(TE2) are signal intensities of the early and late echoes, respectively.
Spatial Fuzzy Segmentation (SFS)
Traditional fuzzy segmentation algorithm seeks to assign each image voxel to a certain class based on its membership function, which indicates the probability of this voxel belongs to the certain class. This is a voxel-by-voxel approach, that is, each voxel is considered individually, and no spatial influence is incorporated. Since image noise and artifacts often impair the performance of the traditional algorithm, in this work, we encode spatial regularization through the mutual influences of neighboring voxels by means of Markov Random Field (MRF) into a fuzzy segmentation framework to eliminate the intermediate morphological operations and to improve the segmentation accuracy. We previously proposed this algorithm to detect activations in functional MRI (He and Greenshields, 2008).
Let S be a set of voxels/locations in a brain image and xi (i∈S) be the corresponding intensities. The aim of the proposed algorithm is to segment images, using both local intensity and spatial information, into different tissue regions (background, WM, gray matter (GM), and CSF), say ωj, j = 1, …m (m = 4) the representative parameter of the ωj as θj, the dissimilarity between θj and xi as d(xi, θj). We denote P as a non-spatial membership matrix. The corresponding (i,j) element of each matrix is p(ωj|xi). Normally, P can be derived through minimizing a cost function J(θ, P) = Σi Σj p(ωj|xi) d(xi, θj) with respect to θj and P, subject to Σj p(ωj|xi) = 1.
| (2) |
Local spatial interactions between neighboring voxels described via MRF, then spatial membership is defined Pspat
| (3) |
where Z is a normalization parameter, β is a positive value to weight the influence of the spatial context, and fuzzy energy function is defined in the neighborhood of xi, ζ{xi} as U(ωj|xi) = Σxk∈ζ{xi} [1 − p(ωj|xi)]. To simplify,
| (4) |
The final segmentation is determined by a joint fuzzy membership
| (5) |
which contains two components to balance the statistical and spatial information: P(ωj|xi) helps to preserve isolated voxels having high statistical values and Pspat(ωj|xi) tends to eliminate them by considering local neighborhood interactions. By imposing such constraints, we expect that the probability of a given voxel belonging to a certain class is influenced by the probabilities of all voxels in its neighborhood.
Partial Volume Artifact Correction
The partial volume (PV) artifact is caused by an imaging voxel representing two kinds of tissue types and therefore possessing a signal average of both tissues. It blurs the intensity distinction between tissue classes at the border of the two tissues. For example, the intensities of the mixed voxels between CSF and GM approximate the intensities of unmyelinated WM in neonatal brains, and thus are commonly mislabeled as WM (Wang et al., 2011). Similarly, mixed voxels between extra-axial CSF and skull are often mislabeled as WM or GM. Similar to Xue et al. (2007), MRF is incorporated in our SFS scheme to reduce PV effects. In order to obtain an optimum correction, the parameter β in equation (3), controlling the spatial influence, needs to be optimized. Intuitively, PV artifact correction needs strong spatial influence, while the preservation of isolated small regions of extra-axial CSF needs moderate spatial influence. In this work, a moderate (which may not be optimal in terms of PV correction) spatial influence parameter was considered (more specifically, the effects from non-spatial and spatial components are equal), leaving residual PV artifact present in the resultant segmentation. To correct the residual PV artifact, simple but effective knowledge-based morphological corrections are further conducted. The correction criteria are that the outer surface of extra-axial CSF contains no brain matters and the region in between extra-axial CSF and GM contains no WM.
DEHSI Detection
The T2 relaxation time reflects the rapid changes in free water content, such that CSF is readily distinguished from DEHSI, WM and GM via aforementioned SFS method. In addition, our observation is that, as stated in (Oros-Peusquens et al., 2008), T2 relaxation time for each tissue type (CSF, WM, and GM) can be modeled with Gaussian distribution. After excluding CSF, T2 relaxometry distribution of the combination of WM and GM can also be approximated by a Gaussian distribution, of which DEHSI contributes to the upper bound. Voxels with values greater than or equal to α SD above the mean for cerebral tissues are considered DEHSI. Mathematical morphological operations (e.g. filling holes in detected DEHSI regions or removing erroneously randomly isolated extremely small regions) are finally applied to enhance the detection.
Parameter Optimization
Computer simulations were conducted to determine an optimal α. Simulated preterm infant brain PD- and T2-weighted images were constructed based on a normal anatomical model from the Montreal Neurological Institute, McGill University (http://www.bic.mni.mcgill.ca/brainweb/). Heuristically, we set the mean values of CSF, WM and GM in PD-weighted images to be 500, 460 and 390; and those values for T2-weighted as 400, 260 and 190, respectively. Three representative T2-weighted slices were selected, on which synthetic DEHSI regions were manually drawn by a neonatologist with more than 8 years of brain MRI research, as shown in Fig. 1. The binary masks of these DEHSI regions (considered as ground-truth) were recorded and overlaid to the corresponding PD-weighted images. The mean values of voxels in DEHSI regions were set to 480 and 330 in PD- and T2-weighted images, respectively. A multiplicative slowly-varying field of intensity non-uniformity (INU) with a complex shape and range of 0.9 to 1.1 (20% level) was imposed to both PD- and T2- weighted images as shown in Fig 2. Different levels of Rician noise were then imposed to the noise-free PD- and T2-weighted images. DEHSI detections using various α ranging from 0.5 to 2 were conducted and the one that facilitated maximum accuracy rates was considered to be optimal. Without loss of generality, the same selection strategy is conducted at different noise levels. As shown in Fig 3, irrespective of the level of noise, the optimal α was 1.2.
Figure 1.
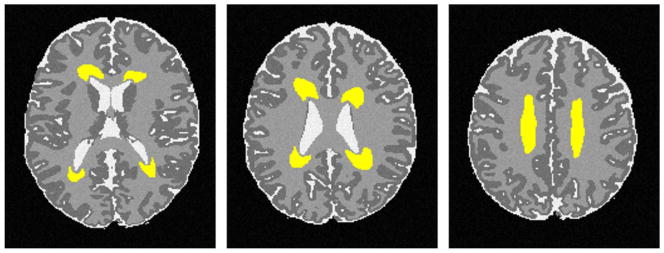
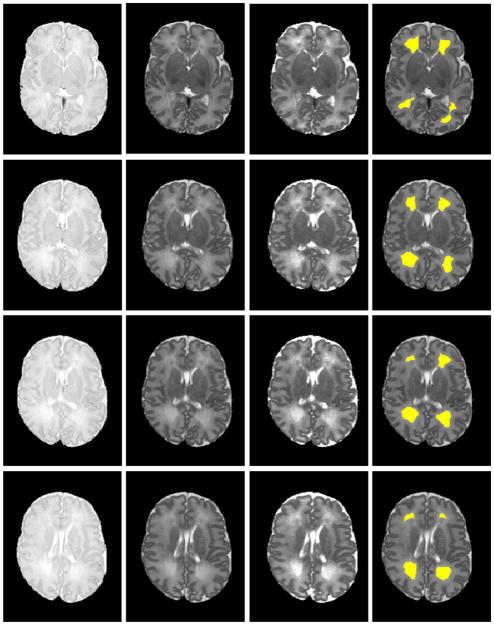
Manually drawn DEHSI regions in yellow on a simulated neonatal T2-weighted image serve as ground truths for detection validations.
Figure 2.
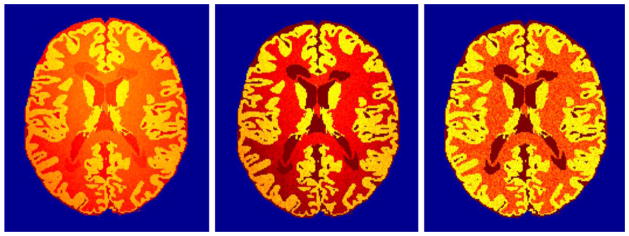
Non-uniformity magnetic fields are applied to, from left to right, T2-weighted and PD-weighted images. Right-most quantitative parametric transverse relaxation time T2 map derived from these images is invulnerable to the magnetic field non-uniformity.
Figure 3.
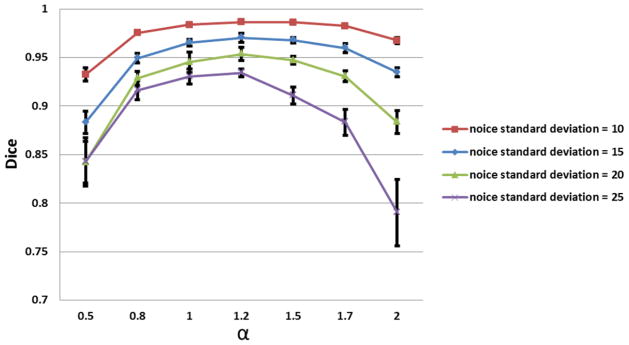
Parameter optimization. DEHSI detections using various α (intensity standard deviation) ranging from 0.5 to 2 were conducted and the one that facilitated maximum accuracy rates was considered to be optimal. Without loss of generality, the same selection strategy is conducted at different noise levels. Irrespective of the level of noise, the optimal α was 1.2.
Quantitative Validations
By superimposing ground-truth and automated detections, four different pixel categories are generated: a is the number of correct detections that a voxel is negative; b is the number of incorrect detections that a voxel is positive, c is the number of incorrect detections that a voxel is negative, and d is the number of correct detections that a voxel is positive. Eight metrics are then defined to evaluate and compare the results. The recall or true positive rate, TP = d/(c + d); true negative rate, TN = a/(a + b); false positive rate, FP = b/(a + b); false negative rate, FP = c/(c + d); precision is the proportion of the detected positives that are correct, precision, P = d/(b + d) and accuracy is the proportion of the total number of true detections, accuracy = (a + d)/(a + b + c + d). However, the accuracy sometimes may not be an adequate performance measure when the number of negatives is much greater than positives. Similarity index account for this by including TP is also defined: Dice (same as F1 score) = (2 × P × TP)/(P + TP) (Dice, 1945).
Application to Brain MRI Segmentation in Very Preterm Infants
Incorporated with DEHSI detection, SFS on term MRI in very preterm infants can be further improved. The proposed strategy (named as SFS_DEHSI) comprises three major steps: 1. An initial SFS is done on original T2-weighted images. Mean intensity value of segmented WM is considered as a representative value of normal WM and recorded as mWM; 2. A binary mask containing DEHSI information is overlaid on the corresponding T2-weighted images. The intensities of these covered voxels are replaced with mWM to generate new T2-weighted images, that is, the DEHSI regions in new T2-weighted images are corrected by being filled with approximate normal intensity values of WM; 3. SFS is again applied to the new T2-weighted images for the segmentation of WM, GM and CSF.
Results
Simulations
Automated DEHSI detection method was validated on simulated preterm infant brains generated using the strategy proposed in the section of Parameter Optimization. Qualitatively, Fig. 4 shows the DEHSI detection results have strong overlap with the ground truth. In addition, quantitative comparisons displayed in Fig. 5 show very high similarity index values and low false detection rates at each noise level. Noise levels for clinical preterm infant MRI scans are different system-wise/parameter-wise. A general acceptable noise standard deviation is about less than 25. When it is less than 15, the true negative and positive rates, as well as Dice similarity index were consistently greater than 95%. The error bars in Fig.5 were calculated from 25 random Monte Carlo realizations.
Figure 4.
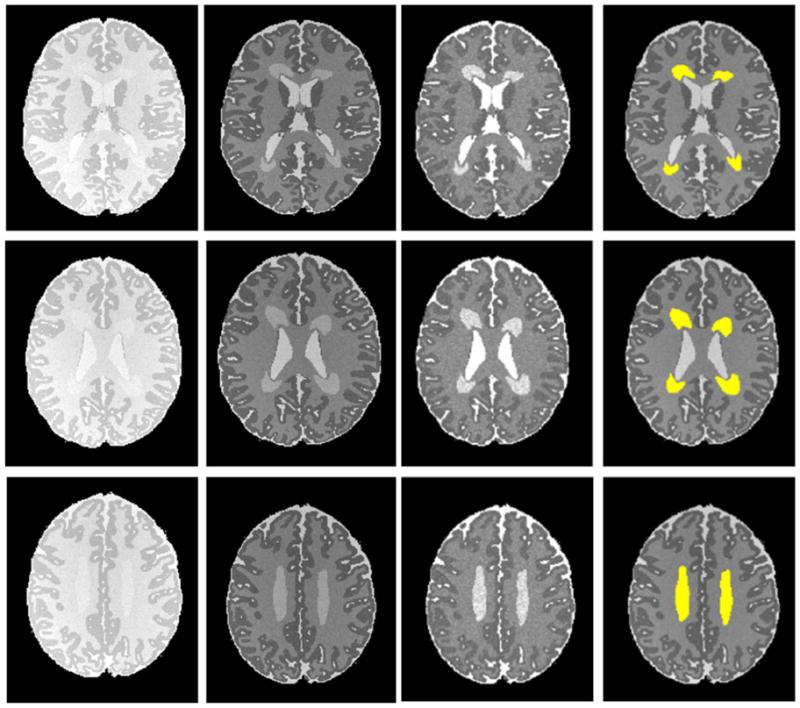
Automated DEHSI detection on simulated infant axial MR images (noise standard deviation 10). From left to right: PD-weighted, T2-weighted, calculated T2 relaxometry map and the detected DEHSI in yellow (superimposed on noise-free T2-weighted images) at three different axial levels. Qualitatively, the DEHSI detection results have strong overlap with the ground truth as shown in Figure 1.
Figure 5.
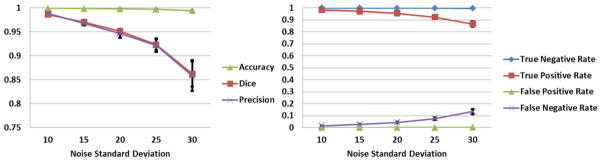
Comparison of automated DEHSI detection on simulated infant MR images with ground truth. Quantitatively, automated detection shows very high Dice similarity index values (left) and low false detection rates (right) at each noise level with ground truth. Noise levels for clinical preterm infant MRI scans are different system-wise/parameter-wise. Typical noise standard deviation is less than 25. The error bars were calculated from 25 random Monte Carlo realizations.
ELBW Data
The proposed automatic DEHSI detection approach was also tested on ELBW infant MRI scans. The results were visually inspected by a neonatologist. Signal abnormalities that are visible on T2-weighted MRI were more clearly delineated on T2 relaxometry maps. The automated segmentation closely approximated the boundaries apparent on the T2 maps. Representative images with DEHSI segmentations from a single ELBW infant are presented in Fig. 6.
Figure 6.
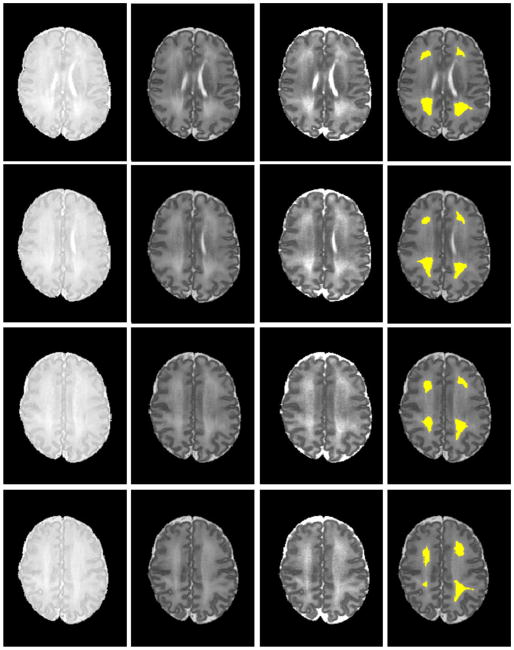
Automated DEHSI detection. From left to right: PD-, T2-weighted images; T2 relaxometry map; and the automated detected DEHSI in yellow (superimposed on T2-weighted images) at eight different axial levels. Signal abnormalities that are visible on T2-weighted MRI were more clearly delineated on T2 relaxometry maps. The automated segmentation closely approximated the boundaries apparent on the T2 maps.
Application to Brain MRI Segmentation in Very Preterm Infants
Twenty ELBW data sets were randomly selected from our cohort study database. Motion artifacts were visually assessed, resulting in exclusion of five out of twenty cases that exhibited severe motion artifacts. Of these 15 infants, nine infants were clinically diagnosed with mild to moderate abnormalities other than DEHSI, one infant with severe, and five with no abnormalities detected on anatomic MRI scans at term-equivalent age. All 15 subjects exhibited mild (covering one-third of hemispheric white matter) or moderate degree of DEHSI (covering two-thirds) per neuroradiologist assessment. Data sets were manually segmented into regions of CSF, WM and GM by an experienced rater to assess segmentation accuracy. Intra-rater reliabilities of all three tissue types were very high (Yu et al., 2010). Representative segmentation results generated by the SFS, SFS_DEHSI and the manual rater are shown in Fig. 7. Visually, SFS and SFS_DEHSI, in general, generated similar segmentations compared with manual ones. SFS tended to mislabel DEHSI as CSF, since their voxel intensity distributions appear similar. The detection errors were successfully corrected by SFS_DEHSI. The detailed quantitative comparisons for each individual subject are illustrated in Fig. 8 and a summary of the results displayed in Table 1. As described above, the accuracies were measured by the metrics of accuracy, precision, Dice, TP, TN, whose values range from 0 to 1 (the higher, the more accurate); the false segmentations were measured by FP and FN, whose values are also from 0 to 1 (the lower, the more accurate). Considerable segmentation improvements achieved by SFS_DEHSI over SFS were observed in the 15 subjects. The segmentation improvements of CSF, WM and GM by SFS_DEHSI over SFS measured by Dice were 3.57%, 4.71% and 1.14%, respectively.
Figure 7.
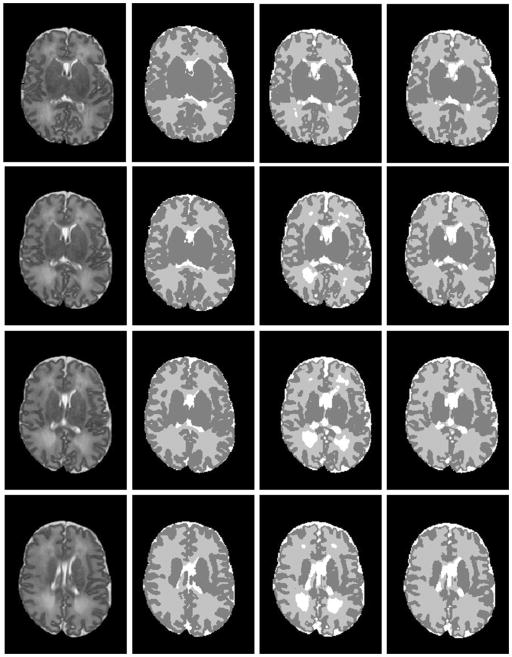
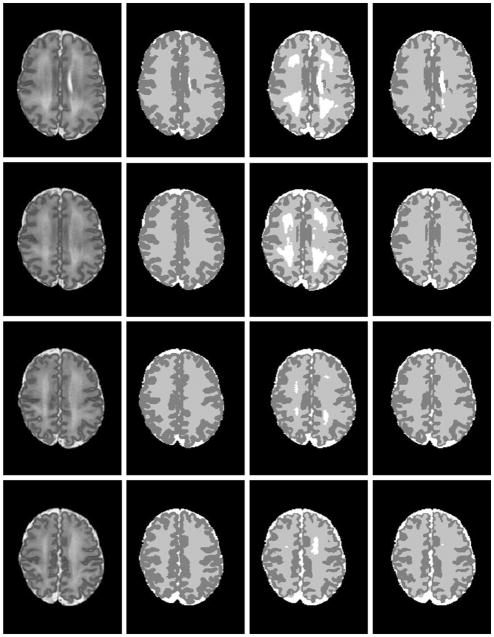
Brain MRI segmentations in very preterm infants at eight different axial levels. From left to right: original T2-weighted images; segmentations by manual rater; SFS; and SFS_DEHSI. Visually, SFS and SFS_DEHSI, in general, generated similar segmentations compared with manual ones. SFS tended to mislabel DEHSI as CSF, since their voxel intensity distributions appear similar. The detection errors were successfully corrected by SFS_DEHSI.
Figure 8.
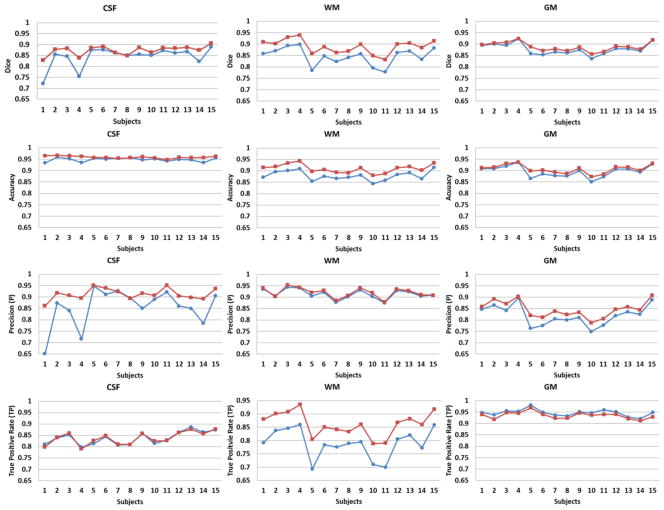
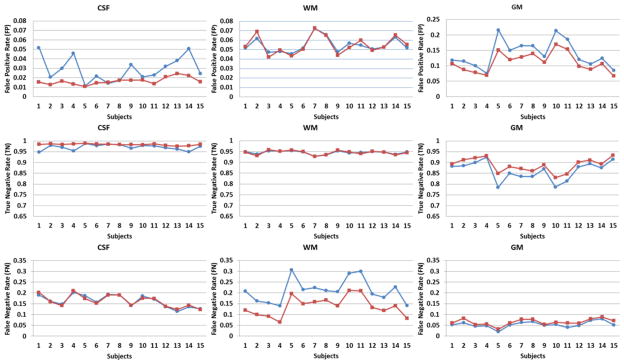
Quantitative comparisons of CSF, WM, and GM automated detected by SFS (blue circle) and SFS_DEHSI (red square) with manual segmentations (ground truth) for 15 randomly selected ELBW infants. The accuracies were measured by the metrics of Dice, accuracy, precision, true positive rate, true negative rate, whose values range from 0 to 1 (the higher, the more accurate); the false segmentations were measured by false positive rate and false negative rate, whose values are also from 0 to 1 (the lower, the more accurate). SFS_DEHSI performed considerably better than SFS in our 15 ELBW subjects.
Table 1.
Mean±SD of the comparison of automated SFS and SFS_DEHSI with manual segmentations (ground truth) for 15 randomly selected ELBW infants.
| CSF | WM | GM | ||||
|---|---|---|---|---|---|---|
|
| ||||||
| SFS | SFS_DEHSI | SFS | SFS_DEHSI | SFS | SFS_DEHSI | |
| Dice | 0.84±0.05 | 0.87±0.02 | 0.85±0.04 | 0.89±0.03 | 0.88±0.02 | 0.89±0.02 |
| Accuracy | 0.95±0.01 | 0.96±0.01 | 0.88±0.02 | 0.91±0.02 | 0.90±0.02 | 0.91±0.02 |
| Precision | 0.86±0.08 | 0.91±0.03 | 0.91±0.02 | 0.92±0.02 | 0.82±0.04 | 0.85±0.04 |
| True Positive | 0.84±0.03 | 0.84±0.03 | 0.79±0.05 | 0.86±0.05 | 0.95±0.01 | 0.94±0.01 |
| False Positive | 0.03±0.01 | 0.02±0.00 | 0.06±0.01 | 0.05±0.01 | 0.14±0.04 | 0.11±0.03 |
| True Negative | 0.97±0.01 | 0.98±0.00 | 0.95±0.01 | 0.95±0.01 | 0.86±0.04 | 0.89±0.03 |
| False Negative | 0.16±0.03 | 0.16±0.03 | 0.21±0.05 | 0.14±0.05 | 0.05±0.01 | 0.06±0.02 |
Discussion
We present a fully automated procedure to detect DEHSI using quantitative T2 relaxometry. T2 is an objective and quantitative measurement that could be readily obtained during clinical MR imaging in preterm infants at term. Hagmann et al. (2009) reported higher T2 in posterior WM than in central or frontal WM in infants with DEHSI as compared to preterm infants with normal-appearing WM and term controls. The power of their study however was limited due to subjective placements of regions of interest in visually assessed DEHSI regions. Studies with long-term neurodevelopmental follow-up present the best likelihood of determining the developmental and prognostic significance of DEHSI. To date, the outcomes following development of DEHSI at term are conflicting. Two studies observed a significant negative association between DEHSI and developmental quotient at 18 months corrected age (Dyet et al. 2006) and IQ at 9 years of age (Iwata et al., 2012). Others however reported similar rates of neurodevelopmental impairments in infants with and without DEHSI (Hart et al., 2011; de Bruine et al., 2011; Jeon et al., 2012). Lack of consistent outcomes could partly be explained by the difficulty in diagnosing DEHSI reliably. Hart et al. (2010) reported poor inter- and intra-observer agreement with qualitative diagnosis of DEHSI. Our use of computer simulations suggests the proposed automated approach yields objectively quantified DEHSI volumes that may help resolve this debate and spur additional research into the pathophysiology and histopathologic correlates of such signal abnormalities. Whole brain tissue segmentation was also enhanced by incorporating DEHSI detection.
In this work, dual-echo, turbo spin echo sequence was applied to acquire PD- and T2-weighted imaging data and two-point method was used to calculate T2 relaxation time map by assuming a single exponential decay, while most of the brain regions may show multi-exponential decay (Dula, et. al., 2010). Whittall el al. (1997, 1999) suggested that 32 echoes were optimal to define the decay curve for a good fit and to enhance insights about the underlying microscopic pathology. Although multi-echo acquisition produces more accurate T2-relaxation values, it requires long scanning times (25 min for scanning a single slice as reported in Whittall’s work) and is not capable of generating whole brain coverage (Jackson et al., 1993). The emphasis of this work was to differentiate normal and abnormal tissue; reproducible numbers rather than “true” T2 values was our goal, as this was more practical. Moreover, the ability to generate whole brain coverage in less scan time is critical for reducing motion artifacts, especially for unsedated infants. Previous T2 relaxometry studies in newborns used 2 to 4 echo times for similar reasons (Ferrie et al. 1996; Thornton et al., 1999; Shanmugalingam et al., 2006; Hagmann et al., 2009).
Other than quantitative T2 relaxonmetry, diffusion weighted imaging has shown reduced fractional anisotropy (FA) and elevated apparent diffusion coefficient (ADC) values in regions of DEHSI in preterm infants (Counsell et al., 2003a; Hagmann et al., 2009). Our proposed procedure can readily be applied to detect DEHSI using FA and ADC maps. The obtained detections could be used to verify the findings using T2 relaxation time maps. In adults, efforts have been made to investigate whether spatial locations of WMSA (e.g. periventricular or subcortical WMSA) reflect different underlying etiology or clinical consequences (de Groot et al., 2000a, 2000b; Gouw et al., 2011). As such, automated WMSA localization has been of great interest (DeCarli et al., 2005; Wu et al., 2006; van der Lijn et al., 2012). Our proposed methods can be applied for a distinction of spatially variant DEHSI by incorporating spatial information. Such work, when correlated with neurodevelopmental impairments, will also allow us to improve our definition of DEHSI, in particular, whether periventricular crossroads regions should be included or excluded as part of the DEHSI definition (Maalouf et al., 1999; Kostovic et al., 2002; Judas et al., 2005). Our approach could also be readily modified to automatically detect punctate WM lesions in preterm infants and WM hyperintensities in adults with multiple sclerosis or diabetic encephalopathy.
In summary, T2 produces objective and reproducible measurements that can improve our understanding of preterm infant brain development and may prove to be a more accurate quantitative biomarker for neurodevelopmental outcomes. We developed a fully automated method for DEHSI detection in preterm infants at term using T2 relaxometry. Computer simulations and experiments on clinical MRI data demonstrated very high DEHSI detection accuracy and improved brain tissue segmentation in ELBW infants.
Highlights.
We automate DEHSI detection in preterm infants using T2 relaxometry.
We conduct computer simulations to select an optimal detection parameter.
The proposed method is validated using both computer simulations and in vivo data.
Dice index is 95% when noise standard deviation is 20 in simulated infant brain.
Average tissue segmentation improvement by incorporating DEHSI detection is 3.14%.
Acknowledgments
This work was supported by the National Center for Research Resources (NCRR) grant UL1 RR024148 (University of Texas Health Science Center at Houston Center for Clinical and Translational Sciences), NCRR/The Eunice Kennedy Shriver National Institute of Child Health & Human Development grant UL1 RR024148-04S3 (Best Pharmaceuticals for Children Act), and The Research Institute at Nationwide Children’s Hospital (to NAP). The funding agencies played no role in the design, conduct, or analysis of the trial. The authors take full responsibility for the integrity of the data and analyses. We thank both reviewers for their kind and helpful suggestions to improve our manuscript.
Footnotes
Publisher's Disclaimer: This is a PDF file of an unedited manuscript that has been accepted for publication. As a service to our customers we are providing this early version of the manuscript. The manuscript will undergo copyediting, typesetting, and review of the resulting proof before it is published in its final citable form. Please note that during the production process errors may be discovered which could affect the content, and all legal disclaimers that apply to the journal pertain.
References
- Admiraal-Behloul F, van den Heuvel DM, Olofsen H, van Osch MJ, van der Grond J, van Buchem MA, Reiber JH. Fully automatic segmentation of white matter hyperintensities in MR images of the elderly. Neuroimage. 2005;28:607–617. doi: 10.1016/j.neuroimage.2005.06.061. [DOI] [PubMed] [Google Scholar]
- Anbeek P, Vincken KL, van Osch MJ, Bisschops RH, van der Grond J. Automatic segmentation of different-sized white matter lesions by voxel probability estimation. Med Image Anal. 2004a;8:205–215. doi: 10.1016/j.media.2004.06.019. [DOI] [PubMed] [Google Scholar]
- Anbeek P, Vincken KL, van Osch MJ, Bisschops RH, van der Grond J. Probabilistic segmentation of white matter lesions in MR imaging. Neuroimage. 2004b;21:1037–1044. doi: 10.1016/j.neuroimage.2003.10.012. [DOI] [PubMed] [Google Scholar]
- Baune BT, Roesler A, Knecht S, Berger K. Single and combined effects of cerebral white matter lesions and lacunar infarctions on cognitive function in an elderly population. J Gerontol A Biol Sci Med Sci. 2009;64:118–124. doi: 10.1093/gerona/gln004. [DOI] [PMC free article] [PubMed] [Google Scholar]
- Breteler MM, van Swieten JC, Bots ML, Grobbee DE, Claus JJ, van den Hout JH, van Harskamp F, Tanghe HL, de Jong PT, van Gijn J, et al. Cerebral white matter lesions, vascular risk factors, and cognitive function in a population-based study: the Rotterdam Study. Neurology. 1994;44:1246–1252. doi: 10.1212/wnl.44.7.1246. [DOI] [PubMed] [Google Scholar]
- Brickman AM, Sneed JR, Provenzano FA, Garcon E, Johnert L, Muraskin J, Yeung LK, Zimmerman ME, Roose SP. Quantitative approaches for assessment of white matter hyperintensities in elderly populations. Psychiat Res-Neuroim. 2011;193:101–106. doi: 10.1016/j.pscychresns.2011.03.007. [DOI] [PMC free article] [PubMed] [Google Scholar]
- Cheong JLY, Thompson DK, Wang HX, Hunt RW, Anderson PJ, Inder TE, Doyle LW. Abnormal white matter signal on MR imaging is related to abnormal tissue microstructure. Am J Neuroradiol. 2009;30:623–628. doi: 10.3174/ajnr.A1399. [DOI] [PMC free article] [PubMed] [Google Scholar]
- Counsell SJ, Allsop JM, Harrison MC, Larkman DJ, Kennea NL, Edwards D, Rutherford MA. Quantitative analysis of the cerebral white matter in preterm infants using diffusion weighted imaging. Pediatr Res. 2002;51:438a–439a. [Google Scholar]
- Counsell SJ, Allsop JM, Harrison MC, Larkman DJ, Kennea NL, Kapellou O, Cowan FM, Hajnal JV, Edwards AD, Rutherford MA. Diffusion-weighted imaging of the brain in preterm infants with focal and diffuse white matter abnormality. Pediatrics. 2003a;112:1–7. doi: 10.1542/peds.112.1.1. [DOI] [PubMed] [Google Scholar]
- Counsell SJ, Kennea NL, Herlihy AH, Allsop JM, Harrison MC, Cowan FM, Hajnal JV, Edwards B, Edwards AD, Rutherford MA. T2 relaxation values in the developing preterm brain. Am J Neuroradiol. 2003b;24:1654–1660. [PMC free article] [PubMed] [Google Scholar]
- Counsell SJ, Rutherford MA, Cowan FM, Edwards AD. Magnetic resonance imaging of preterm brain injury. Arch Dis Child Fetal Neonatal Ed. 2003c;88:F269–274. doi: 10.1136/fn.88.4.F269. [DOI] [PMC free article] [PubMed] [Google Scholar]
- Counsell SJ, Shen YJ, Boardman JP, Larkman DJ, Kapellou O, Ward P, Allsop JM, Cowan FM, Hajnal JV, Edwards AD, Rutherford MA. Axial and radial diffusivity in preterm infants who have diffuse white matter changes on magnetic resonance imaging at term-equivalent age. Pediatrics. 2006;117:376–386. doi: 10.1542/peds.2005-0820. [DOI] [PubMed] [Google Scholar]
- de Bruine FT, van den Berg-Huysmans AA, Leijser LM, Rijken M, Steggerda SJ, van der Grond J, van Wezel-Meijler G. Clinical Implications of MR Imaging Findings in the White Matter in Very Preterm Infants: A 2-year Follow-up Study. Radiology. 2011;261:899–906. doi: 10.1148/radiol.11110797. [DOI] [PubMed] [Google Scholar]
- de Groot JC, de Leeuw FE, Oudkerk M, Hofman A, Jolles J, Breteler MM. Cerebral white matter lesions and depressive symptoms in elderly adults. Arch Gen Psychiat. 2000;57:1071–1076. doi: 10.1001/archpsyc.57.11.1071. [DOI] [PubMed] [Google Scholar]
- de Groot JC, de Leeuw FE, Oudkerk M, van Gijn J, Hofman A, Jolles J, Breteler MM. Cerebral white matter lesions and cognitive function: the Rotterdam Scan Study. Ann Neurol. 2000;47:145–151. doi: 10.1002/1531-8249(200002)47:2<145::aid-ana3>3.3.co;2-g. [DOI] [PubMed] [Google Scholar]
- DeCarli C, Fletcher E, Ramey V, Harvey D, Jagust WJ. Anatomical mapping of white matter hyperintensities (WMH) - Exploring the relationships between periventricular WMH, deep WMH, and total WMH burden. Stroke. 2005;36:50–55. doi: 10.1161/01.STR.0000150668.58689.f2. [DOI] [PMC free article] [PubMed] [Google Scholar]
- Dice LR. Measures of the Amount of Ecologic Association between Species. Ecology. 1945;26:297–302. [Google Scholar]
- Dula AN, Gochberg DF, Valentine HL, Valentine WM, Does MD. Multiexponential T2, magnetization transfer, and quantitative histology in white matter tracts of rat spinal cord. Magn Reson Med. 2010;63:902–909. doi: 10.1002/mrm.22267. [DOI] [PMC free article] [PubMed] [Google Scholar]
- Duncan JS, Bartlett P, Barker GJ. Technique for measuring hippocampal T2 relaxation time. AJNR Am J Neuroradiol. 1996;17:1805–1810. [PMC free article] [PubMed] [Google Scholar]
- Dyet LE, Kennea N, Counsell SJ, Maalouf EF, Ajayi-Obe M, Duggan PJ, Harrison M, Allsop JM, Hajnal J, Herlihy AH, Edwards B, Laroche S, Cowan FM, Rutherford MA, Edwards AD. Natural history of brain lesions in extremely preterm infants studied with serial magnetic resonance imaging from birth and neurodevelopmental assessment. Pediatrics. 2006;118:536–548. doi: 10.1542/peds.2005-1866. [DOI] [PubMed] [Google Scholar]
- Ferrie JC, Barantin L, Saliba E, Akoka S, Tranquart F, Sirinelli D, Pourcelot L. MR assessment of the brain maturation during the perinatal period: quantitative T2 MR study in premature newborns. Magn Reson Imaging. 1999;17:1275–1288. doi: 10.1016/s0730-725x(99)00080-6. [DOI] [PubMed] [Google Scholar]
- Gibson E, Gao FQ, Black SE, Lobaugh NJ. Automatic Segmentation of White Matter Hyperintensities in the Elderly Using FLAIR Images at 3T. J Magn Reson Imaging. 2010;31:1311–1322. doi: 10.1002/jmri.22004. [DOI] [PMC free article] [PubMed] [Google Scholar]
- Gouw AA, Seewann A, van der Flier WM, Barkhof F, Rozemuller AM, Scheltens P, Geurts JJ. Heterogeneity of small vessel disease: a systematic review of MRI and histopathology correlations. J Neurol Neurosur Ps. 2011;82:126–135. doi: 10.1136/jnnp.2009.204685. [DOI] [PubMed] [Google Scholar]
- Gurol ME, Irizarry MC, Smith EE, Raju S, Diaz-Arrastia R, Bottiglieri T, Rosand J, Growdon JH, Greenberg SM. Plasma beta-amyloid and white matter lesions in AD, MCI, and cerebral amyloid aniopathy. Neurology. 2006;66:23–29. doi: 10.1212/01.wnl.0000191403.95453.6a. [DOI] [PubMed] [Google Scholar]
- Hagmann CF, De Vita E, Bainbridge A, Gunny R, Kapetanakis AB, Chong WK, Cady EB, Gadian DG, Robertson NJ. T2 at MR imaging is an objective quantitative measure of cerebral white matter signal intensity abnormality in preterm infants at term-equivalent age. Radiology. 2009;252:209–217. doi: 10.1148/radiol.2522080589. [DOI] [PubMed] [Google Scholar]
- Hart AR, Smith MF, Rigby AS, Wallis LI, Whitby EH. Appearance of diffuse excessive high signal intensity (DEHSI) on MR imaging following preterm birth. Pediatr Radiol. 2010;40:1390–1396. doi: 10.1007/s00247-010-1633-7. [DOI] [PubMed] [Google Scholar]
- Hart A, Whitby E, Wilkinson S, Alladi S, Paley M, Smith M. Neuro-developmental outcome at 18 months in premature infants with diffuse excessive high signal intensity on MR imaging of the brain. Pediatr Radiol. 2011;41:1284–1292. doi: 10.1007/s00247-011-2155-7. [DOI] [PubMed] [Google Scholar]
- Hasan KM, Walimuni IS, Kramer LA, Narayana PA. Human brain iron mapping using atlas-based T2 relaxometry. Magnetic Resonance in Medicine. 2012;67:731–739. doi: 10.1002/mrm.23054. [DOI] [PMC free article] [PubMed] [Google Scholar]
- He L, Greenshields IR. An MRF spatial fuzzy clustering method for fMRI SPMs. Biomed Signal Process Contr. 2008;3:327–333. [Google Scholar]
- Hulsey KM, Gupta M, King KS, Peshock RM, Whittemore AR, McColl RW. Automated quantification of white matter disease extent at 3 T: Comparison with volumetric readings. J Magn Reson Imaging. 2012 doi: 10.1002/jmri.23659. [Epub ahead of print] [DOI] [PubMed] [Google Scholar]
- Inder TE, Wells SJ, Mogridge NB, Spencer C, Volpe JJ. Defining the nature of the cerebral abnormalities in the premature infant: a qualitative magnetic resonance imaging study. J Pediatr. 2003;143:171–179. doi: 10.1067/S0022-3476(03)00357-3. [DOI] [PubMed] [Google Scholar]
- Iwata S, Nakamura T, Hizume E, Kihara H, Takashima S, Matsuishi T, Iwata O. Qualitative brain MRI at term and cognitive outcomes at 9 years after very preterm birth. Pediatrics. 2012;129:10. doi: 10.1542/peds.2011-1735. [DOI] [PubMed] [Google Scholar]
- Jackson GD, Connelly A, Duncan JS, Grunewald RA, Gadian DG. Detection of hippocampal pathology in intractable partial epilepsy: increased sensitivity with quantitative magnetic resonance T2 relaxometry. Neurology. 1993;43:1793–1799. doi: 10.1212/wnl.43.9.1793. [DOI] [PubMed] [Google Scholar]
- Jeon TY, Kim JH, Yoo SY, Eo H, Kwon JY, Lee J, Lee M, Chang YS, Park WS. Neurodevelopmental outcomes in preterm infants: comparison of infants with and without diffuse excessive high signal intensity on MR images at near-term-equivalent age. Radiology. 2012;263:518–526. doi: 10.1148/radiol.12111615. [DOI] [PubMed] [Google Scholar]
- Judas M, Rados M, Jovanov-Milosevic N, Hrabac P, Stern-Padovan R, Kostovic I. Structural, immunocytochemical, and MR imaging properties of periventricular crossroads of growing cortical pathways in preterm infants. AJNR Am J Neuroradiol. 2005;26:2671–2684. [PMC free article] [PubMed] [Google Scholar]
- Keunen K, Kersbergen KJ, Groenendaal F, Isgum I, de Vries LS, Benders MJ. Brain tissue volumes in preterm infants: prematurity, perinatal risk factors and neurodevelopmental outcome: A systematic review. J Matern Fetal Neonatal Med. 2012;25(Suppl 1):89–100. doi: 10.3109/14767058.2012.664343. [DOI] [PubMed] [Google Scholar]
- Kidokoro H, Anderson PJ, Doyle LW, Neil JJ, Inder TE. High Signal Intensity on T2-Weighted MR Imaging at Term-Equivalent Age in Preterm Infants Does Not Predict 2-Year Neurodevelopmental Outcomes. Am J Neuroradiol. 2011;32:2005–2010. doi: 10.3174/ajnr.A2703. [DOI] [PMC free article] [PubMed] [Google Scholar]
- Kostovic I, Judas M, Rados M, Hrabac P. Laminar organization of the human fetal cerebrum revealed by histochemical markers and magnetic resonance imaging. Cereb Cortex. 2002;12:536–544. doi: 10.1093/cercor/12.5.536. [DOI] [PubMed] [Google Scholar]
- Krishnan ML, Dyet LE, Boardman JP, Kapellou O, Allsop JM, Cowan F, Edwards AD, Rutherford MA, Counsell SJ. Relationship between white matter apparent diffusion coefficients in preterm infants at term-equivalent age and developmental outcome at 2 years. Pediatrics. 2007;120:E604–E609. doi: 10.1542/peds.2006-3054. [DOI] [PubMed] [Google Scholar]
- Maalouf EF, Duggan PJ, Rutherford MA, Counsell SJ, Fletcher AM, Battin M, Cowan F, Edwards AD. Magnetic resonance imaging of the brain in a cohort of extremely preterm infants. J Pediatr. 1999;135:351–357. doi: 10.1016/s0022-3476(99)70133-2. [DOI] [PubMed] [Google Scholar]
- Maillard P, Delcroix N, Crivello F, Dufouil C, Gicquel S, Joliot M, Tzourio-Mazoyer N, Alperovitch A, Tzourio C, Mazoyer B. An automated procedure for the assessment of white matter hyperintensities by multispectral (T1, T2, PD) MRI and an evaluation of its between-centre reproducibility based on two large community databases. Neuroradiology. 2008;50:31–42. doi: 10.1007/s00234-007-0312-3. [DOI] [PubMed] [Google Scholar]
- Mantyla R, Erkinjuntti T, Salonen O, Aronen HJ, Peltonen T, Pohjasvaara T, Standertskjold Nordenstam CG. Variable agreement between visual rating scales for white matter hyperintensities on MRI - Comparison of 13 rating scales in a poststroke cohort. Stroke. 1997;28:1614–1623. doi: 10.1161/01.str.28.8.1614. [DOI] [PubMed] [Google Scholar]
- Mathur AM, Neil JJ, Inder TE. Understanding brain injury and neurodevelopmental disabilities in the preterm infant: the evolving role of advanced magnetic resonance imaging. Semin Perinatol. 2010;34:57–66. doi: 10.1053/j.semperi.2009.10.006. [DOI] [PMC free article] [PubMed] [Google Scholar]
- Oros-Peusquens AM, Laurila M, Shah NJ. Magnetic field dependence of the distribution of NMR relaxation times in the living human brain. Magn Reson Mater Phy. 2008;21:131–147. doi: 10.1007/s10334-008-0107-5. [DOI] [PubMed] [Google Scholar]
- Ramirez J, Gibson E, Quddus A, Lobaugh NJ, Feinstein A, Levine B, Scott CJM, Levy-Cooperman N, Gao FQ, Black SE. Lesion Explorer: A comprehensive segmentation and parcellation package to obtain regional volumetrics for subcortical hyperintensities and intracranial tissue. Neuroimage. 2011;54:963–973. doi: 10.1016/j.neuroimage.2010.09.013. [DOI] [PubMed] [Google Scholar]
- Rose J, Mirmiran M, Butler EE, Lin CY, Barnes PD, Kermoian R, Stevenson DK. Neonatal microstructural development of the internal capsule on diffusion tensor imaging correlates with severity of gait and motor deficits. Dev Med Child Neurol. 2007;49:745–750. doi: 10.1111/j.1469-8749.2007.00745.x. [DOI] [PubMed] [Google Scholar]
- Shanmugalingam S, Thornton JS, Iwata O, Bainbridge A, O’Brien FE, Priest AN, Ordidge RJ, Cady EB, Wyatt JS, Robertson NJ. Comparative prognostic utilities of early quantitative magnetic resonance imaging spin-spin relaxometry and proton magnetic resonance spectroscopy in neonatal encephalopathy. Pediatrics. 2006;118:1467–1477. doi: 10.1542/peds.2005-2976. [DOI] [PubMed] [Google Scholar]
- Skiold B, Horsch S, Hallberg B, Engstrom M, Nagy Z, Mosskin M, Blennow M, Aden U. White matter changes in extremely preterm infants, a population-based diffusion tensor imaging study. Acta Paediatr. 2010;99:842–849. doi: 10.1111/j.1651-2227.2009.01634.x. [DOI] [PubMed] [Google Scholar]
- Swartz RH, Black SE, Feinstein A, Rockel C, Sela G, Gao FQ, Caldwell CB, Bronskill MJ. Utility of simultaneous brain, CSF and hyperintensity quantification in dementia. Psychiat Res-Neuroim. 2002;116:83–93. doi: 10.1016/s0925-4927(02)00068-9. [DOI] [PubMed] [Google Scholar]
- Thornton JS, Amess PN, Penrice J, Chong WK, Wyatt JS, Ordidge RJ. Cerebral tissue water spin-spin relaxation times in human neonates at 2.4 tesla: methodology and the effects of maturation. Magn Reson Imaging. 1999;17:1289–1295. doi: 10.1016/s0730-725x(99)00063-6. [DOI] [PubMed] [Google Scholar]
- van der Lijn F, Verhaaren BF, Ikram MA, Klein S, de Bruijne M, Vrooman HA, Vernooij MW, Hammers A, Rueckert D, van der Lugt A, Breteler MM, Niessen WJ. Automated measurement of local white matter lesion volume. Neuroimage. 2012;59:3901–3908. doi: 10.1016/j.neuroimage.2011.11.021. [DOI] [PubMed] [Google Scholar]
- Wang Y, Catindig JA, Hilal S, Soon HW, Ting E, Wong TY, Venketasubramanian N, Chen C, Qiu A. Multi-stage segmentation of white matter hyperintensity, cortical and lacunar infarcts. Neuroimage. 2012;60:2379–2388. doi: 10.1016/j.neuroimage.2012.02.034. [DOI] [PubMed] [Google Scholar]
- Wang L, Shi F, Lin WL, Gilmore JH, Shen DG. Automatic segmentation of neonatal images using convex optimization and coupled level sets. Neuroimage. 2011;58:805–817. doi: 10.1016/j.neuroimage.2011.06.064. [DOI] [PMC free article] [PubMed] [Google Scholar]
- Whittall KP, MacKay AL, Graeb DA, Nugent RA, Li DK, Paty DW. In vivo measurement of T2 distributions and water contents in normal human brain. Magn Reson Med. 1997;37:34–43. doi: 10.1002/mrm.1910370107. [DOI] [PubMed] [Google Scholar]
- Whittall KP, MacKay AL, Li DK. Are mono-exponential fits to a few echoes sufficient to determine T2 relaxation for in vivo human brain? Magn Reson Med. 1999;41:1255–1257. doi: 10.1002/(sici)1522-2594(199906)41:6<1255::aid-mrm23>3.0.co;2-i. [DOI] [PubMed] [Google Scholar]
- Woodward LJ, Anderson PJ, Austin NC, Howard K, Inder TE. Neonatal MRI to predict neurodevelopmental outcomes in preterm infants. N Engl J Med. 2006;355:685–94. doi: 10.1056/NEJMoa053792. [DOI] [PubMed] [Google Scholar]
- Wu MJ, Rosano C, Butters M, Whyte E, Nable M, Crooks R, Meltzer CC, Reynolds CF, Aizenstein HJ. A fully automated method for quantifying and localizing white matter hyperintensities on MR images. Psychiat Res-Neuroim. 2006;148:133–142. doi: 10.1016/j.pscychresns.2006.09.003. [DOI] [PMC free article] [PubMed] [Google Scholar]
- Xue H, Srinivasan L, Jiang S, Rutherford M, Edwards AD, Rueckert D, Hajnal JV. Automatic segmentation and reconstruction of the cortex from neonatal MRI. Neuroimage. 2007;38:461–477. doi: 10.1016/j.neuroimage.2007.07.030. [DOI] [PubMed] [Google Scholar]
- Yoshita M, Fletcher E, DeCarli C. Current concepts of analysis of cerebral white matter hyperintensities on magnetic resonance imaging. Top Magn Reson Imaging. 2005;16:399–407. doi: 10.1097/01.rmr.0000245456.98029.a8. [DOI] [PMC free article] [PubMed] [Google Scholar]
- Yu X, Zhang Y, Lasky RE, Datta S, Parikh NA, Narayana PA. Comprehensive brain MRI segmentation in high risk preterm newborns. PLoS One. 2010;5:e13874. doi: 10.1371/journal.pone.0013874. [DOI] [PMC free article] [PubMed] [Google Scholar]