

Abstract
Species-specific vocalizations of mammals, including humans, contain slow and fast frequency modulations (FMs) as well as tone and noise bursts. In this study, we established sex-specific hemispheric differences in the tonal and FM response characteristics of neurons in the Doppler-shifted constant-frequency processing area in the mustached bat's primary auditory cortex (A1). We recorded single-unit cortical activity from the right and left A1 in awake bats in response to the presentation of tone bursts and linear FM sweeps that are contained within their echolocation and/or communication sounds. Peak response latencies to neurons' preferred or best FMs were significantly longer on the right compared with the left in both sexes, and in males this right-left difference was also present for the most excitatory tone burst. Based on peak response magnitudes, right hemispheric A1 neurons in males preferred low-rate, narrowband FMs, whereas those on the left were less selective, responding to FMs with a variety of rates and bandwidths. The distributions of parameters for best FMs in females were similar on the two sides. Together, our data provide the first strong physiological support of a sex-specific, spectrotemporal hemispheric asymmetry for the representation of tones and FMs in a nonhuman mammal. Specifically, our results demonstrate a left hemispheric bias in males for the representation of a diverse array of FMs differing in rate and bandwidth. We propose that these asymmetries underlie lateralized processing of communication sounds and are common to species as divergent as bats and humans.
Keywords: communication, hearing, lateralization, music, speech
a left hemispheric specialization for processing of speech sounds is a defining characteristic of the human brain (Geschwind and Levitsky 1968). Studies of brain-damaged (Divenyi and Robinson 1989), learning-impaired (Merzenich et al. 1996; Nagarajan et al. 1999; Tallal et al. 1993; Temple et al. 2000), and healthy passive listeners (Belin et al. 1998; Makela et al. 2005; Schwartz and Tallal 1980) demonstrate high temporal precision of the left auditory cortex (AC) that enables it to process speech sounds that contain rapid formant transitions similar to linear frequency-modulated (FM) sweeps (Jamison et al. 2006; Zatorre and Belin 2001). The low temporal precision of the right AC matches its inability to follow fast spectral changes that span a large frequency range within a given time window (Poeppel 2003; Zatorre et al. 2002). This low temporal precision does not, however, constrain the right AC from conducting a refined analysis of small fluctuations in average frequency that may be present in stimuli sampled over relatively long time intervals. This refined spectral precision is presented as an explanation for why the right AC can process steady-state signals, such as vowel sounds, just as well as the left AC and why it is specialized for processing speech-related prosodic variation and voice identity (Robinson and Fallside 1991) as well as musical sounds (Poeppel 2003). This asymmetry tends to be greater in the auditory cortices of human males than in females (Brown et al. 1999; Dawe and Corballis 1986; Lansdell 1964; McGlone 1977; Shaywitz et al. 1995).
Neurophysiological studies of the mustached bat (Pteronotus parnellii) have revealed that its AC contains functional maps for processing its stereotypic echolocation signals (O'Neill and Suga 1979; Suga and Jen 1976). Multifunctional neurons within its AC respond to constant frequencies (CFs) and FMs that are present not only in echolocation signals but also in the rich variety of communication sounds (or social calls) emitted by this species (Esser et al. 1997; Kanwal et al. 1994, 1999; Washington and Kanwal 2008). CFs and FMs in social calls of bats and other mammalian species are acoustically analogous to formants and formant transitions in human speech (Kanwal and Rauschecker 2007; Liberman et al. 1956; Rauschecker and Scott 2009; Suga 1992). Therefore, understanding the auditory processing of combinations of FMs and CFs can provide important clues about common mechanisms that direct hemispheric specializations for processing spectrotemporal information within simple syllabic calls of bats analogous to that of phonemes, the spectrotemporal unit of speech. Furthermore, in the midst of emitting and listening to the echoes of their own biosonar or echolocation pulses, bats may encounter social vocalizations of others in the colony. To simultaneously process, perceive, and respond to both types of sounds that occasionally overlap in frequency can be challenging. Here, again, an understanding of the mechanisms underlying lateralization of call processing (Kanwal 2012) can provide important insights into a neural solution to this problem.
We recorded single-neuron responses to combinations of CFs and FMs in the right and left primary auditory cortex (A1) of mustached bats with the intent of investigating hemispheric differences in the representation of CFs as well as multiple FM parameters, such as rate (slope) and bandwidth, covaried with duration and the central frequency of FMs. All recordings were obtained from the Doppler-shifted CF processing (DSCF) area, which encompasses nearly half of A1 in this species (Kanwal 1999; Suga and Jen 1976; Xiao and Suga 2002) and has been shown to process both CFs (Kanwal et al. 1999) and FMs (Washington and Kanwal 2008). We used both male and female bats to test for hemispheric differences within and between sexes. Our results demonstrate sex-specific hemispheric asymmetries for processing FMs and include a hemispheric difference in the response latencies to CFs.
MATERIALS AND METHODS
Surgery and Electrophysiological Recordings
All methods were approved by the Georgetown University Animal Care and Use Committee. Surgical and recording methods were previously described (Kanwal et al. 1999; Medvedev and Kanwal 2004; Washington and Kanwal 2008). We used 10 (6 male and 4 female) wild-caught mustached bats. Animals were anesthetized with an initial dose of 0.5–1% isoflurane/oxygen mixture (medical grade; Anaquest) followed by a continuous stream of ∼0.25% isoflurane. A skin incision was made along the midline of the head of each bat, and a 2-mm-diameter metal post was glued immediately caudal to the intersection of the sagittal and coronal sutures. Each bat was allowed >3 days recovery before initiation of electrophysiological recordings. During recordings, each bat was restrained by clamping the metal post, and the body was suspended in a Styrofoam mold by elastic bands in a heated (31°C), sound-proof, and echo-attenuated chamber (IAC 400A). Electrophysiological recordings were made from the AC at a depth of 300–650 μm using custom-made, sharpened, vinyl-coated tungsten-microelectrodes (>1 MΩ). A second microelectrode (< 1 MΩ) was placed onto the dura mater of a nonauditory region of cortex as a reference for differential recording. Electrical signals acquired by the recording electrode were amplified and bandpass filtered between 300 and 3,000 Hz.
Successful neural recordings presented here were obtained from a total of 129 penetrations. Of these, 38 penetrations were from the left hemispheres and 26 from the right hemispheres of male mustached bats; 39 penetrations were from the left hemispheres and 26 from the right hemispheres of female mustached bats. Sampling bias in single-unit recordings may result from differences in electrode location, impedance and tip diameter, which select for a particular size range of the cell body, dendritic morphology, and spiking properties of neurons (Stone 1973). To minimize the possibility of a sampling bias when making right-left (R-L) comparisons, we used similar electrodes for recording from the right and left sides. In 4/6 males and 3/4 females, we recorded from both sides of the same animal. We recorded only from the left hemisphere in a male and in a female, and only from the right hemisphere in another male. Response characteristics from each side of these animals were comparable to those from the same side and sex of other animals.
Acoustic Stimuli
We used constant-frequency tone bursts (or simply CFs) and frequency modulations (FMs) to study response characteristics of DSCF neurons in the mustached bat A1. CFs were generated using custom-made analog function generators. A customized SIGNAL 3.0 script (Engineering Design) was used to generate FMs (Washington and Kanwal 2008). All CFs were 30 ms in duration, including 0.5-ms rise and fall times of amplitude. FMs ranged in duration between 0.4 and 213 ms and were tapered only if their duration exceeded 2 ms. We presented CFs from two custom-made condenser loudspeakers that were flat (±6 dB SPL) from 20 to 120 kHz. We presented FMs from a leaf-tweeter speaker (Panasonic) that was flat (±3 dB SPL) from 5 to 100 kHz, which did not generate a significantly wideband click at DSCF neurons' preferred stimulus amplitudes (<80 dB SPL). Moreover, DSCF neurons are tuned to a narrow range of frequencies and can discriminate between 2-ms-long FMs presented in the upward vs. downward direction (see data supplement, Washington and Kanwal 2008).
Constant frequencies.
We first determined which frequencies elicited peak responses from a neuron to 1) determine if it was a DSCF neuron and 2) establish a frequency on which to (initially) center FMs. We classified a neuron as a “DSCF neuron” if it had a peak response to a CF between 57 and 61 kHz (best high frequency, or BFhigh) and this response was facilitated when paired with a simultaneously presented CF between 23 and 28 kHz (best low frequency, or BFlow). The neural responses to CFs were elicited by CFs (BFlow + BFhigh) paired at onset and presented 200 times at best amplitude (BA) for excitation. Neurons generally showed only a small response to BFlow alone, and the criteria for facilitation were the same as previously described (Fitzpatrick et al. 1993; Kanwal et al. 1999). Pairs of CFs in the ranges 23–28 and 57–61 kHz were presented to facilitate responses per the well-studied tuning properties of DSCF neurons (Kanwal et al. 1999). The frequencies and amplitudes of both CFs were adjusted to obtain BFs in the ranges of 23–28 and 57–61 kHz at their BAs of facilitation. Stimuli were tested at the resolution set by the step value for changing CF, FM, and amplitude parameters, e.g., of FM rates or bandwidths within the respective arrays. Frequency adjustments to CFs in the BFlow and BFhigh ranges were performed manually using custom-made sweep generator analog equipment with a 0.01-kHz resolution. Frequency-tuning curves were obtained by changing the frequency of 30-ms CFs in six 0.25-kHz steps above and below the manually determined BFhigh. Each of the 14 CFs was presented 100 times and decreased in amplitude by 10 dB SPL per every 10 repetitions starting at 97 dB SPL. To obtain representative peristimulus time histograms (PSTHs), we recorded single-neuron responses to 200 repetitions of best FMs and CFs at their BAs. Examples of three single neurons showing facilitation to combinations of CFs (BFlow + BFhigh) as well as CFs and FMs (BFlow + best FM) are shown in Fig. 1. Because of potential amplitude-related latency shifts, R-L comparisons of temporal response parameters are based on 200 repetitions of the best FMs and/or CFs at BA for excitation.
Fig. 1.
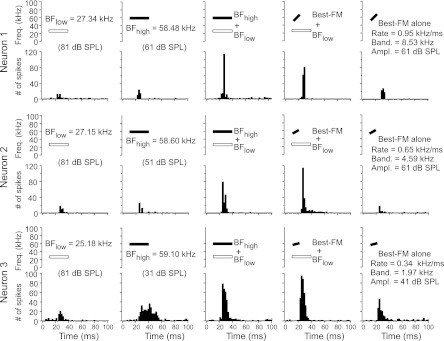
Combination-sensitive constant-frequency (CF) and CF/frequency-modulated (FM) responses in the Doppler-shifted constant-frequency (DSCF) processing area. Idealized spectrograms of auditory stimuli (top) and peristimulus time histograms (below) show the role of response facilitation by stimulus combinations in 3 representative neurons. Responses are shown in 2-ms bins for 3 DSCF neurons to their best low frequency (BFlow), best high frequency (BFhigh), BFlow + BFhigh, BFlow + best FM (optimized for rate, bandwidth, and central frequency), and best FM alone. Each stimulus was presented at its best amplitude (BA) of excitation. Each neuron demonstrates the synergistic effects of pairing acoustic stimuli (tones or FMs) in the BFhigh range with a tone in the BFlow range. Spectrograms of CFs at BFlow are depicted as open rectangles, and stimuli in the BFhigh range are shown as filled rectangles. Each stimulus was repeated 200 times. Ampl., amplitude; Band., bandwidth; Freq., frequency.
The term “best” as used here and in the previous literature (Kanwal et al. 1999; Suga et al. 1983, 1987) implies the value of a stimulus parameter at which the response magnitude is the highest. Response magnitude is described as the total number of spikes in either a 5- or 10-ms window and is estimated by sliding this window in 1-ms steps from stimulus onset. Because of the phasic nature of onset responses in the DSCF area, this response measure is optimal and the most realistic given that this is a widely accepted integration window for postsynaptic neurons. Average firing rate computed over relatively long (>10 ms) response durations is less appropriate because of differences in duration between different stimuli, which ranged approximately from 2 to 200 ms. Response measures over 50-ms or longer time windows are likely to yield erroneous results because a majority of the FM rates tested had durations of under 10 ms. We recorded from neurons representing the same range of BFs from each side. Although the results reported here are derived from summary statistics of single-neuron populations, none of the neurophysiological data described in this article are derived from multineuron recordings.
Frequency modulations.
FMs used in this study were linear modulations of frequency (f) in the range 57–61 kHz. Details of the procedure for studying FM response characteristics have been reported elsewhere (Washington and Kanwal 2008). All linear FMs are defined by four parameters: duration (Δt, in ms), bandwidth (Δƒ, in kHz), rate of modulation (Δƒ/Δt, in kHz/ms), and the central frequency of an FM (in kHz). To determine the best FM parameters for each neuron, we created a sequence of FM stimuli (or an FM array), varied one (target) FM parameter (e.g., rate) within a desired range, and allowed a nontarget parameter (e.g., duration) to covary with the first while other parameters were kept constant. Each FM array was presented 100 times and decreased in amplitude by 10 dB SPL per every 10 repetitions starting at 91 dB SPL. All stimuli in the FM arrays were paired at onset with a CF at BFlow for facilitating the response and maximizing peak response magnitudes. Because we needed to determine the FM directional preference for each neuron, there were two types of FM arrays: one where all the FMs were upward and another where all the FMs were downward (Washington and Kanwal 2004).
Experimental Design
We first created 14 FMs with rates increasing from 0.04 to 4.0 kHz/ms at a constant bandwidth of either 3.5 or 5.25 kHz to generate an array of different FM rates (Fig. 2). We call this an “FM rate array.” The peak response magnitude elicited by FMs presented in the rate array indicated the “best FM rate” for a neuron. Keeping the FM rate constant, we then varied the bandwidths of 13 FMs from either 0.44 to 5.25 kHz or 0.66 to 7.88 kHz to generate the FM bandwidth array. An initial bandwidth range was based on the narrow width of frequency tuning in DSCF neurons, which ranges from ∼0.4 to ∼5 kHz. Midway through data acquisition, we discovered that DSCF neurons continued to respond robustly to FMs with relatively broad bandwidths (∼5.25 kHz) despite their relatively narrow tuning to CFs. To capture this wider range of tuning, we increased the FM bandwidth range to ∼7.88 kHz and pooled the data for R-L comparisons. The rates of all FMs in the bandwidth array were set equal to the best FM rate of the neuron under study. Each sequence of FM stimuli (or FM array) was presented 100 times and decreased in amplitude by 10 dB SPL every 10 repetitions starting at 91 dB SPL. Peak response magnitudes to FMs in the bandwidth array allowed us to describe the “best FM bandwidth” at the best FM rate for a neuron. All stimuli in the FM rate and FM bandwidth arrays were centered on the BFhigh of the neuron under study. FM duration was allowed to covary for both of these target parameters.
Fig. 2.
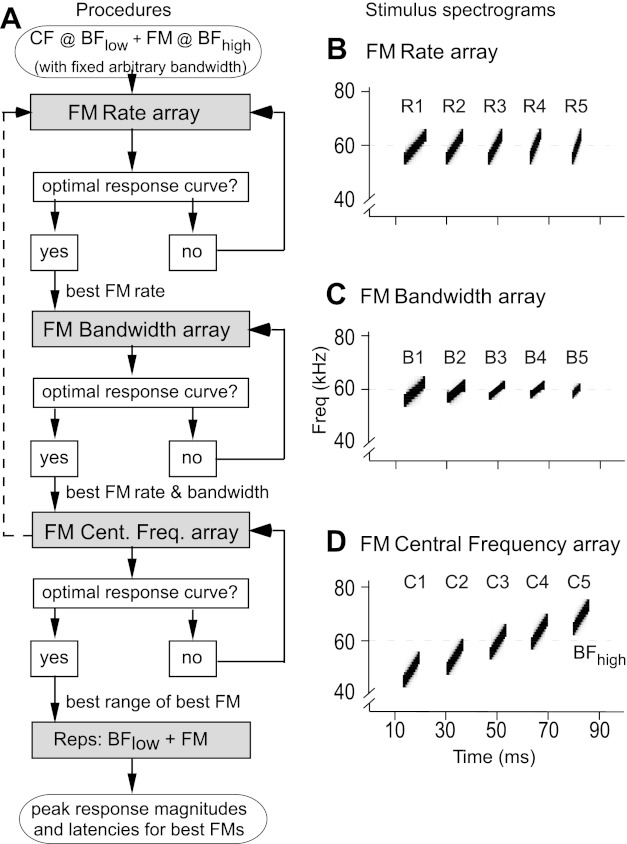
Schematic depicting the experimental design to determine the parameters for the best FM stimulus at each recording location. A: flow chart shows the sequence of presentation of different arrays in which a single stimulus parameter was systematically modified. Each FM array was composed of 15 stimuli: a no-stimulus control and 14 FMs (or 13 FMs and a CF in the BFhigh range). Each FM array was repeated 100 times. B–D show samples of spectrograms representing each FM array. B: spectrogram of 5 upward FMs with equal bandwidths (10 kHz) and center frequencies (60 kHz) but different rates (R1–R5). C: spectrogram of 5 upward FMs with equal rates (1 kHz/ms) and center frequencies (60 kHz) but different bandwidths (B1–B5). D: spectrogram of 5 upward FMs with equal rates (2 kHz/ms), bandwidths (10 kHz), and durations (5 ms) but different center frequencies (C1–C5). Duration covaries with rate and bandwidth in B and C, respectively.
Finally, we varied the FM central frequency to generate another FM array at best FM rate and best FM bandwidth that contained 13 FMs (with the middle one centered on BFhigh) that were shifted in frequency by one-half the best FM bandwidth of the neuron under study. The rates and bandwidths of all FMs in the “FM central frequency array” were, respectively, equal to the best FM rate and best FM bandwidth of the neuron under study. All other FM parameters were kept constant. We used the FM central frequency array to determine where to initiate the best FM in the neuron's excitatory frequency response area. Here, we report only single neuron responses elicited by FMs modulated in a neuron's “best FM direction” as measured by peak response magnitude. An FM modulated at the best FM rate, spanning the best FM bandwidth, and centered on the best FM central frequency of a particular neuron is referred to as the “best FM” for that neuron.
The range of FM parameters to be tested in this study was carefully selected by keeping various issues in mind. First and foremost, FM parameters are meant to be neuroethologically meaningful. Each range of parameters is meant to be meaningful in a species-specific manner. The upper limit of 4.0 kHz/ms for mustached bats represents the modulation rate of the downward FM in the second harmonic of their echolocation signal, which is comparable to the fastest rates encountered in some of the social calls. FMs centered on BFhigh that have bandwidths broader than 9 kHz can interact with other excitatory frequency ranges (see Kanwal et al. 1999), making it difficult to make conclusive statements about response mechanisms.
Data Analysis
Responses to BFlow, BFhigh, and best FM were recorded in the form of PSTHs. These histograms, calculated online by summation of spike trains over repeated trials, were used to measure the neuronal response that represents a stimulus-locked change in peak response magnitude and latency. Peak response magnitudes and latencies of DSCF neural responses to “best FMs” (final step in Fig. 2) described below were elicited by CFs and best FMs (BFlow + best FM) paired at onset and presented 200 times at their BA of excitation.
Peak response magnitudes to CFs and FMs presented 200 times at BA were calculated using 5-ms bin widths. Peak response magnitudes to FMs presented within arrays were calculated using 10-ms bin widths to eliminate small differences due to amplitude-related latency shifts. Peak responses to FMs in arrays presented at different amplitudes were collapsed across amplitudes to create single-neuron “FM response magnitude curves” (Fig. 3, A and B). A response magnitude curve, or simply a response curve, is a line plot for values corresponding to peak response magnitudes, expressed as a percentage of the maximum peak response value, to the stimulus being tested. This provided an amplitude-independent measure for comparing response curves while still incorporating the effect of amplitude on the averaged response measure. In this manner, response curves for individual neurons as well as those representing an average of response curves for all neurons (shown for 2 neurons in Fig. 3C) on the left vs. the right side (referred to as “population-response curves” with SE bars) could be compared and tested for significant differences using repeated-measures analyses of variance (ANOVA). Because of a potential for amplitude-related latency shifts, R-L comparisons of temporal parameters in responses to FMs are based on the response to the best FM within the FM rate, bandwidth, or central frequency arrays.
Fig. 3.
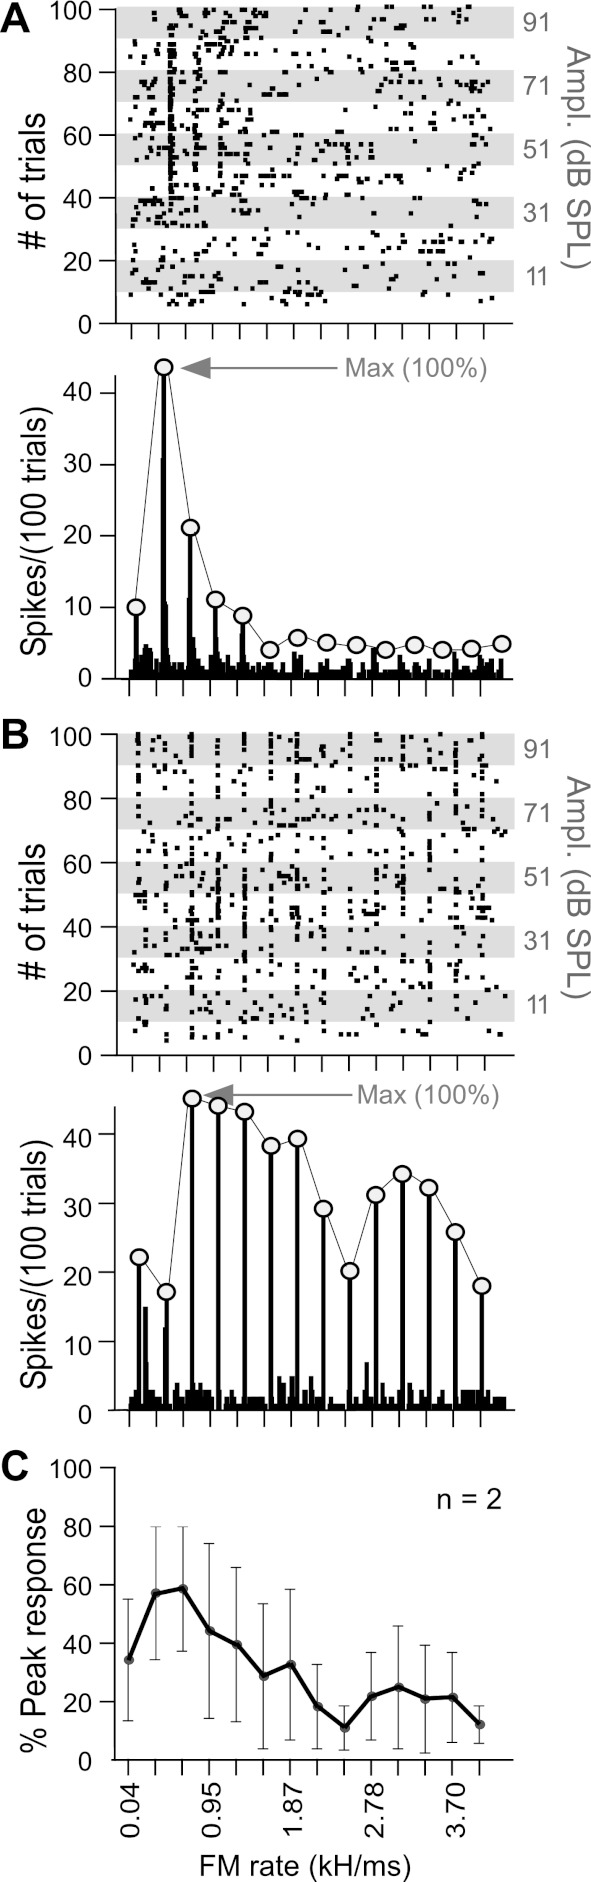
Generation of a normalized FM rate-response curve. A, top: raster plot of a single left DSCF neuron's responses to 14 upward FMs varying in rate from 0.04 to 4.0 kHz/ms. FM bandwidth (5.25 kHz) was fixed, and duration covaried with rate. FM sweeps were centered on the BFhigh (58.95 kHz) and paired at onset with a 30-ms CF at BFlow (25.50 kHz) as shown in Fig. 1. The CF at BFlow was presented at BA (81 dB SPL) throughout each of the 100 trials. The amplitude of each FM (shown on right ordinate) was attenuated by 10 dB SPL every 10 trials. This methodology provided the BA of the best FM for each neuron. It also allowed amplitude tuning to impact the final response curve so that comparisons across neurons were not biased by selection of a particular amplitude. Bottom: peristimulus time histograms summing responses at each FM rate. Peaks (open circles) connected by gray lines show an FM rate-response curve for a single neuron. Each response is based on 100 stimulus trials (bin width = 10 ms) for each of the 14 FMs at several different intensities ranging from −9 to 91 dB SPL. B: same as A for a second DSCF neuron tested with same FM parameters. BFhigh (also central frequency of FM) = 59.26 kHz, BFlow = 25.35 kHz, and BA at BFlow = 91 dB SPL. C: average of the 2 response curves obtained by taking the mean of responses at each FM rate. Note that the y-axis changes from “spikes/100 trials” to “%peak response” due to normalization. Error bars (SE) are big given that the plot represents the average of only 2 neurons.
We measured three types of temporal response parameters: peak response latency (time from stimulus onset to maximum firing rate), response-onset latency (time to first significant deviation 3 SD above the level of ongoing background activity in at least 3 successive 1-ms bins from stimulus onset), and response duration (response-onset latency subtracted from the time of response offset). Peak response latencies were calculated using 1-ms bin widths. For response-onset latencies and response durations, however, we converted our spike train data into spike density functions using 3-ms-wide Gaussian kernels and a 1-ms-wide sliding window.
Response-onset latencies, peak response latencies, and response durations for FMs were only measured for the best FM at BA and only for tone pairs at BFlow + BFhigh at BA. This avoided the confounding effects of amplitude-related latency shifts. Response latency to BFlow alone is typically much longer than that to BFhigh so that it does not have a significant impact on the much shorter response latencies to either BFhigh or an FM traversing through the BFhigh range (Kanwal et al. 1999). Accordingly, a presentation of this FM with the same onset as BFlow does not have a significant impact on response latency. Hence, computing response latencies to the best stimulus makes comparisons of this response measure across neurons and between hemispheres viable and independent of specific stimulus parameters, such as FM amplitude, rate, bandwidth, and duration.
Unlike the treatment of two ranges of FM bandwidth, FM rate arrays spanning a narrow range (e.g., 0.08 to 0.22 kHz/ms) were not pooled with FM rates spanning a relatively wider (0.04 to 4.0 kHz/ms) range. We used two-way ANOVAs to compare preferred FM parameters and temporal response properties between hemispheres and sexes. We used repeated-measures ANOVAs and multilevel (hierarchical linear) modeling to make similar comparisons between population-response curve data.
RESULTS
Response Measures and Terminology
We recorded from a total of 326 DSCF neurons: 178 from the left hemisphere (LH) and 142 from the right hemisphere (RH) in 10 mustached bats. Of these, 158 (LH = 88, RH = 70) were from 6 male bats and 168 (LH = 91, RH = 77) from 4 female bats. F statistics from ANOVAs and means (±SE) are only reported when statistically significant or pivotal in helping us to arrive at a conclusion.
Response Asymmetry for CFs
To test for sex-dependent, hemispheric differences in response to FMs, we first determined the excitatory frequencies for the tone pair (BFlow and BFhigh) for each of the 326 neurons. This enabled us to estimate a central frequency for synthesizing FMs as well as to confirm the extent to which the hemispheric asymmetry was reflected in the responses to CFs and emergent properties that were unique to FMs. Because DSCF neurons are spectrally combination sensitive, we used pairs of CFs (30 ms in duration) presented at the best frequencies (BFlow + BFhigh) and at the BAs of each neuron to elicit maximal firing in each neuron. Neurons typically responded phasically at CF onset, and activity reached baseline or spontaneous level within 20–50 ms.
The frequencies and amplitudes of CF stimuli were similar between hemispheres and sexes. In males, there were no significant hemispheric differences between the values of BFlow (LH: 25.36 ± 0.10 kHz, n = 88; RH: 25.32 ± 0.10 kHz, n = 70) or BFhigh (LH: 59.21 ± 0.07 kHz, n = 91; RH: 59.08 ± 0.06 kHz, n = 77), and the same was true for BFlow (LH: 26.10 ± 0.09 kHz; RH: 25.91 ± 0.08 kHz) and BFhigh (LH: 59.15 ± 0.10 kHz; RH: 58.95 ± 0.05 kHz) in females. BAs for BFlow in males (LH: 87.41 ± 0.62 dB SPL; RH: 85.02 ± 0.96 dB SPL) and females (LH: 82.17 ± 0.76 dB SPL; RH: 83.64 ± 1.06 dB SPL) were similar, as were BAs for BFhigh in males (LH: 56.46 ± 1.73 dB SPL; RH: 64.71 ± 1.32 dB SPL) and females (LH: 57.70 ± 1.27 dB SPL; RH: 64.80 ± 0.66 dB SPL).
There were significant differences in temporal response parameters in males but not in females. PSTHs showing responses from four different neurons are shown in Fig. 4A. In males, the peak response latency was 10 ms for the left hemispheric example neuron and 27 ms for the right hemispheric one. The right and left hemispheric DSCF neuron shown for females had latencies comparable to those of the male left DSCF neuron. As a population, average peak response latencies did not differ between sexes but were significantly longer for right compared with left DSCF neurons (F[1, 322] = 7.08, P < 0.01) (Fig. 4B). Average peak response latencies were significantly longer in males than in females (F[1, 322] = 9.87, P < 0.01) and longer on the right compared with the left (F[1, 322] = 5.79, P < 0.05). An interaction effect of hemisphere and sex showed that neurons on the right side in males had significantly longer (and more variable) peak response latencies than those on the left or compared with either side in females (F[1, 322] = 11.82, P < 0.01). A similar sex-dependent asymmetry held for response-onset latencies (F[1, 322] = 8.73, P < 0.01). Specifically, in males, response-onset latencies on the right showed greater variance than those on the left (σ2: RH = 26.0; LH = 16.2), whereas the response-onset latencies in females were more similar between hemispheres (RH = 16.5; LH = 11.5).
Fig. 4.
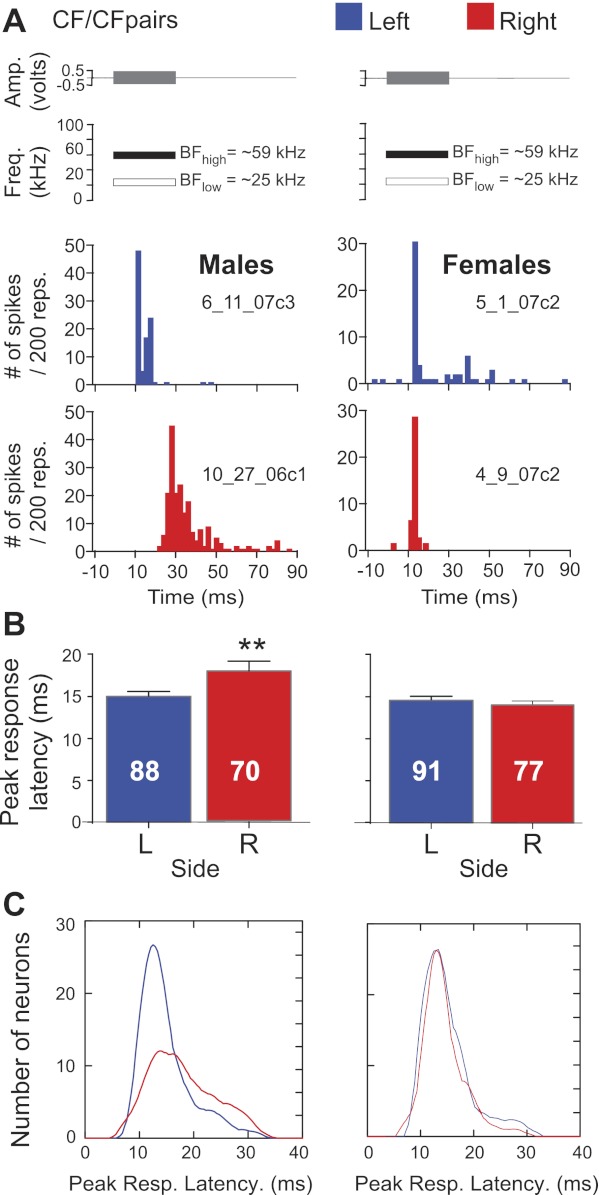
Response profile of left (L; blue) and right (R; red) hemispheric DSCF neurons to CF tone pairs in males and females. A: amplitude envelopes (top) and idealized spectrograms (middle) for CF pairs (BFlow + BFhigh) presented to awake mustached bats. Filled rectangles represent parametrically optimized CFs, and open rectangles represent a 30-ms CF at BFlow (∼25 kHz). Peristimulus time histograms (bottom) represent responses from DSCF neurons in the left (LH) and right hemisphere (RH) for each sex. B: bar graphs representing means and SE for each population of peak response latencies on each side in males and females for CF stimuli. Latencies were significantly different (**P < 0.01) in males. C: kernel plots showing the variability in peak response latencies for each population shown above. Tones were presented as 200 repetitions (reps.) at a rate of 4 s−1. Resp., response.
The distribution of peak response latencies to CF pairs on the right was wider than that on the left in males and compared with either side in females. These data are shown as moving average (kernel) plots in Fig. 4C. However, neither response duration nor peak response magnitude showed hemispheric or sex differences. Overall, our data display significant sex-dependent, hemispheric differences for response latencies to tone pairs. Neurons used in each of the FM analyses presented below were also included in this analysis of neural responses to tone pairs.
Selectivity for FM Rate and Bandwidth Within Individual Neurons
We first present data on R-L differences in DSCF neuron selectivity for FM parameters based on peak response magnitudes and then examine the temporal characteristics of neurons' response patterns to their best FMs. Figure 5 shows raster and PSTH plots of a sequence of single-unit responses obtained for slow to fast FM rates from DSCF neurons in the left (A–C) and right hemispheres (D–F). The bandwidth of each FM was fixed. Figure 6A shows examples of two types of response curves that were present in both the left and the right hemisphere, but in different proportions (see Fig. 6B). One type of response curve (shown at left in Fig. 6A), illustrates sharp tuning to a fast FM rate (0.34 kHz/ms), whereas the other type illustrates broad tuning to a relatively slow FM rate (1.87 kHz/ms).
Fig. 5.
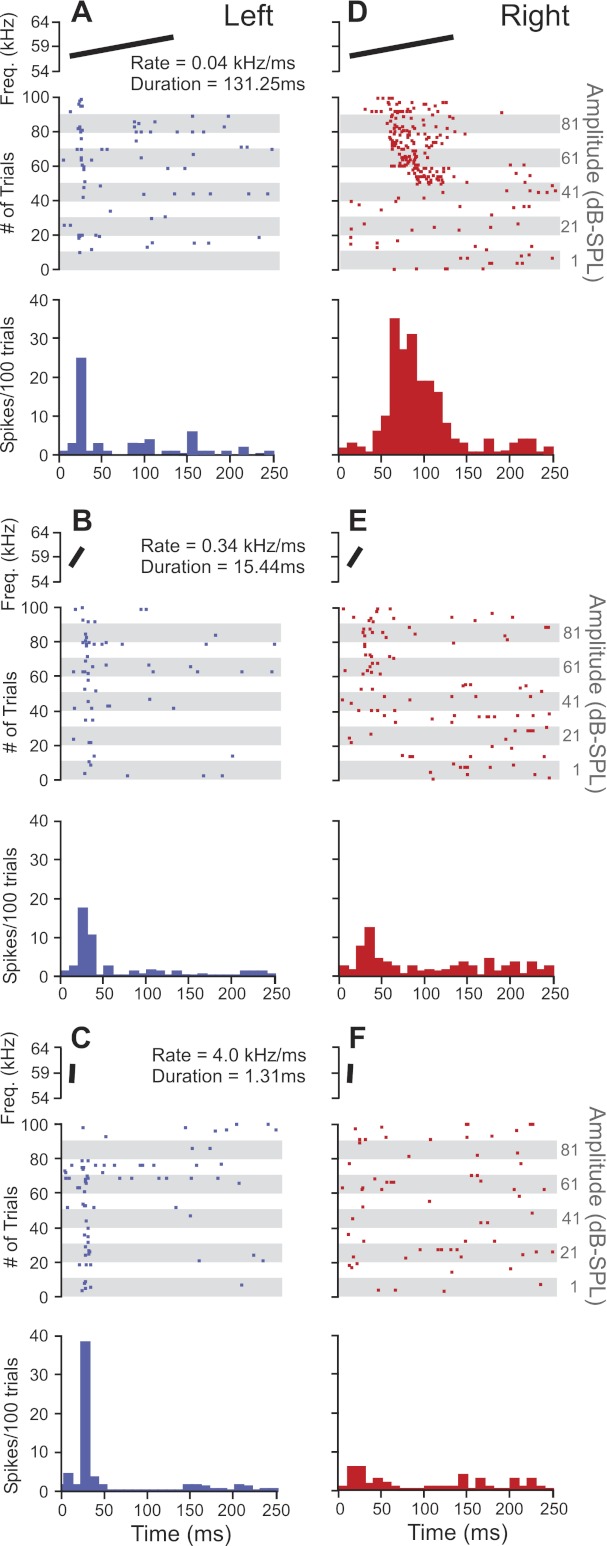
Raw data demonstrating differences in preferences for FM rate and effects of FM duration on the right vs. left side. Data in A–F include a spectrographic plot of the FM stimulus (top), peristimulus raster plot (middle), and a peristimulus time histogram (bottom) of each neuron's response to 100 repetitions of the FM. A–C represent the firing patterns of a single left DSCF neuron in response to FM rates of 0.04, 0.34, and 4.0 kHz/ms, respectively. D–F represent the firing patterns of a single right DSCF neuron in response to the same rates. Each of the FMs described had a bandwidth of 5.25 kHz. Responses from both the left and right DSCF neurons were obtained from male bats. Responses are shown for a bin width of 10 ms and are collapsed over 10 different amplitude levels (91 to −9 dB SPL). All FM stimuli were paired with each neuron's best CFs present at its BA (not shown).
Fig. 6.
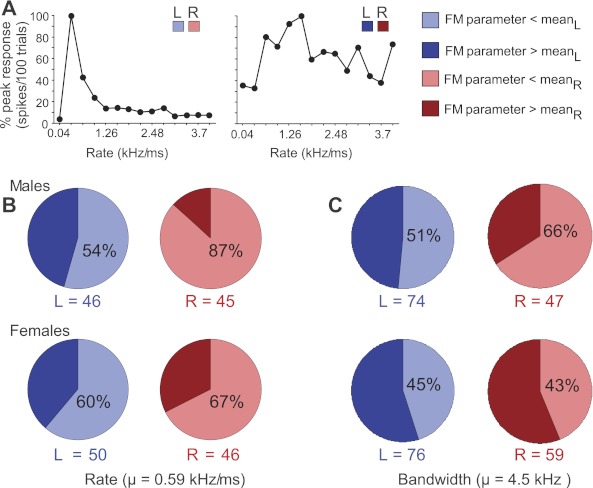
Classification and occurrence of FM rate and bandwidth preference in DSCF neurons by side and sex. A: 2 examples of neuronal response curves showing peak responses, expressed as percentages of the highest peak value, as a function of FM rate ranging from 0.04 to 4.0 kHz/ms. Response curve at right shows a peak (“tuning”) to an FM rate (1.87 kHz/ms) greater than the mean preferred rate, whereas the curve at left has a peak at an FM rate (0.34 kHz/ms) that is less than the mean preferred rate for the population. B: pie charts showing the percentage of neurons with best FM rates below and above the mean preferred rate in the DSCF area on the left vs. the right side in males and females. C: pie charts showing the percentage of best FM bandwidths below and above the mean preferred bandwidth. Light and dark shades of blue and red, respectively, represent the proportion of DSCF neurons with best FM parameters that are greater than (> mean) and less than the average (< mean) for rate and bandwidth for all neurons (0.59 kHz/ms for FM rate and 4.5 kHz for FM bandwidth).
We divided response curves into two groups according to their preferred FM. The boundary between these two groups was the average of best FM rates for all neurons, regardless of the side from which they were recorded or the sex of the animal. The percentage of best FM rates and best FM bandwidths below vs. above the mean rate for each side in each sex are plotted as pie charts (Fig. 6B). In males, the percentage of slow vs. fast rates was dissimilar between hemispheres such that 54% of left DSCF neurons responded best to slow rates (<0.6 kHz/ms), but 87% of right DSCF neurons did the same. In females, the percentages of each group were relatively even with 60% of left and 67% of right DSCF neurons responding best to slow rates. The preferred or best FM bandwidths were divided into two groups as well, separated by the mean value of best bandwidths (4.5 kHz) obtained for all neurons. Percentages of these in each hemisphere in each sex are also shown as pie charts (Fig. 6C). The percentage of best FM bandwidths below vs. above the mean bandwidth in males was dissimilar between the two sides such that 51% were narrow band (<4.5 kHz) in the left hemisphere and 66% were narrowband in the right hemisphere. In females, the division of best FM bandwidths across the two sides was similar.
Population-Level Selectivity for FM Rates
We averaged response curves of single neurons to create population-response curves and compared these response curves using repeated-measures ANOVAs and multilevel modeling. Values for peak response magnitudes declined more steeply with increasing FM rate for the mean response on the right compared with the left for data averaged across males and females (Fig. 7A) and particularly in males (Fig. 7B). Overall, neurons on the left, particularly in males, were generally more responsive to fast FM rates relative to those on the right (Fig. 7, A and B). The distributions of response curves for both sides in females were similar to those on the right side in males (Fig. 6C). Mean peak response magnitude was greatest to the slowest FM rate (0.04 kHz/ms) in both hemispheres and declined monotonically with increases in FM rate (F[13, 2,379] = 63.83, P < 0.01). The results showed a significant main effect of hemisphere (F[13, 2,379] = 7.33, P < 0.01) but not sex (F[13, 2,379] = 3.19, P = 0.08). An interaction effect between the factors of hemisphere, sex, and FM rate (F[13, 2,379] = 2.63, P = 0.01) was also significant and provided statistical evidence of a sex-dependent, hemispheric asymmetry for FM rate preference. This provides quantitative evidence indicating a preference for relatively rapid rates in left hemispheric DSCF neurons compared with those on the right in males or compared with neurons in either hemisphere in females.
Fig. 7.
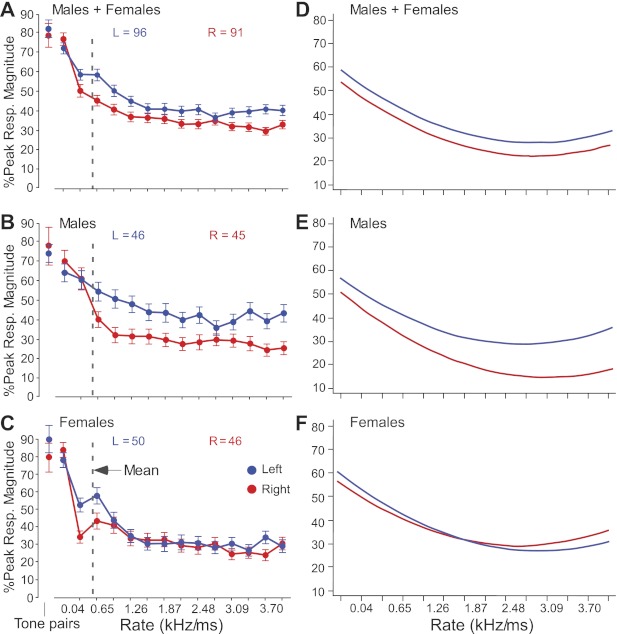
Population-response curves and predicted outcomes of multilevel modeling for FM rate. All FMs were presented in the direction preferred by each neuron; FM bandwidth remained constant with changes in FM rate. Response curves were normalized to their absolute maxima before averaging. Response curves are shown for LH (blue) and RH (red) in males and females averaged together (A), in males only (B), and in females only (C). Dashed vertical lines indicate the mean best FM rate of all 187 neurons. Each response is based on 100 stimulus trials (bin width = 10 ms) for each of the 14 FMs at intensities ranging between −9 and 91 dB SPL. D–F: line graphs of predicted outcomes of multilevel modeling for measuring the effects of FM rate, sex, and hemisphere (see also Table 1) on the peak responses of DSCF neurons from 4 male (E) and 2 female (F) mustached bats (number of spikes in 10-ms bin). Ordinate is percentage of peak response in a 10-ms bin, and abscissa is FM rate from 0.04 to 4.0 kHz/ms.
We also performed multilevel (hierarchical linear) modeling of the response curve data, because this type of analysis is 1) more sensitive than the repeated-measures ANOVA and 2) unlikely to result in significance if the data were biased by one or two animals. Figure 7, D–F, shows a set graphical representations of predicted outcomes of DSCF neural responses to increasing FM rate from 0.04 to 4.0 kHz/ms. Figure 7D shows the predicted percentage of peak response to increasing FM rate for neurons from male and female bats (LH = 96; RH = 91), Fig. 7E shows this same relationship in male bats alone (LH = 46; RH = 45), and Fig. 7F shows this relationship in female bats alone (LH = 50; RH = 46). Table 1 shows the correlational coefficients and, in parentheses, the t values associated with the outcomes predicted by the multilevel model. Specifically, the multilevel model shows that, over the total range (0.04–4.0 kHz/ms), there were significant main effects of FM rate, hemisphere, and sex on peak response magnitude but not strong interaction effects between hemisphere and rate on peak response magnitude. Such an interaction effect did exist, however, within the range of 0.04–1.26 kHz/ms. Furthermore, when separated by sex, males, but not females, showed a strong main effect of hemisphere on peak response magnitude. Accordingly, FM rate-driven peak response magnitudes differed significantly (P < 0.05) between the two sides in males and females.
Table 1.
Predicted outcome values and their significance, separated by percentiles of FM rate
| FM Rate |
||||
|---|---|---|---|---|
| Total (0.04–4.0 kHz/ms) | 33rd Percentile (0.04–1.26 kHz/ms) | 67th Percentile (1.26–2.48 kHz/ms) | 99th Percentile (2.48–4.0 kHz/ms) | |
| Males + Females | ||||
| Rate | −22.54‡ | −26.42‡ | −3.27 | −1.42 |
| (−13.48) | (−7.41) | (−0.80) | (−0.92) | |
| Hemisphere | 5.01* | −1.10 | 8.90 | −8.81 |
| (2.42) | (−0.28) | (0.85) | (−1.36) | |
| Sex | 5.47† | 6.10* | 4.54 | 4.31 |
| (2.93) | (2.28) | (1.30) | (1.47) | |
| Hemisphere × rate | 0.17 | 12.10* | −2.43 | 4.17 |
| (0.13) | (2.43) | (−0.43) | (1.94) | |
| Intercept | 61.73‡ | 65.15‡ | 40.30‡ | 37.16‡ |
| (31.40) | (20.64) | (5.25) | (7.61) | |
| Females | ||||
| Rate | −20.90‡ | −18.57‡ | −0.41 | 0.16 |
| (−8.42) | (−3.42) | (−0.07) | (0.07) | |
| Hemisphere | 4.22 | 2.63 | 4.77 | −14.17 |
| (1.39) | (0.44) | (0.31) | (−1.45) | |
| Hemisphere × rate | 2.30 | 3.64 | −4.55 | 3.36 |
| (−1.25) | (0.48) | (−0.54) | (1.05) | |
| Intercept | 67.38‡ | 67.26‡ | 43.95‡ | 41.16‡ |
| (26.22) | (15.64) | (3.90) | (5.82) | |
| Males | ||||
| Rate | −24.22‡ | −34.45‡ | −6.19 | −3.03 |
| (−10.93) | (−7.55) | (−1.16) | (−1.51) | |
| Hemisphere | 5.84† | −4.90 | 13.43 | −2.97 |
| (2.11) | (−0.94) | (0.98) | (−0.35) | |
| Hemisphere × rate | 2.76 | 20.78† | −0.32 | 4.95 |
| (1.53) | (3.24) | (−0.04) | (1.76) | |
| Intercept | 60.75‡ | 63.27‡ | 41.49‡ | 30.91‡ |
| (27.40) | (19.54) | (5.73) | (6.60) | |
Values in each row represent the relationship between a given variable (rate, hemisphere, sex, hemisphere × rate, or variable intercept) determined using the coeffiecient of regression and the corresponding t score (in parentheses), corresponding to Fig. 7, D and E. Values in each column correspond to a different range of frequency modulation (FM) rates. The first column lists the effects of each variable and the total range of FM rates (0.04–4.0 kHz/ms) on peak response magnitude. The second, third, and fourth columns, respectively, correspond to the lowest (0.04–1.26 kHz/ms, or 33%), middle (1.26–2.48 kHz/ms, or 67%), and highest (2.48–4.0 kHz/ms, or 99.9%) percentiles of the total range of FM rates. Sex is excluded as a variable for predicted outcomes for male and female bats alone. P values show how significantly each variable affected the magnitudes of neural responses (*P < 0.05; †P < 0.01; ‡P < 0.001).
Population-Level Selectivity for FM Bandwidth
Peak response magnitudes increased with FM bandwidth in both hemispheres in females but in only the left hemisphere in males (Fig. 8, A–C). Right DSCF neurons in males responded maximally to FMs between 1.75 and 3.06 kHz, whereas on the left they reach their maximum at or above 7.88 kHz. Conversely, on the left, neurons responded least to FMs <0.88 kHz, whereas on the right they showed a steady decline in peak response magnitude for bandwidths >3.1 kHz. In females, left and right hemispheric DSCF neurons exhibited a pattern more similar to that on the left in males.
Fig. 8.
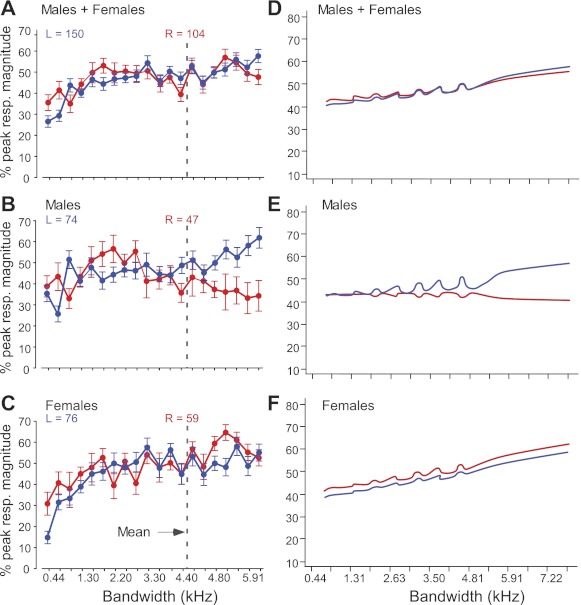
Population-response curves and predicted outcomes of multilevel modeling for FM bandwidth. All FMs were presented in the direction preferred by each neuron; FM rate remained constant, and duration covaried with changes in FM bandwidth. Response curves were normalized to their absolute maxima before averaging. Response curves are shown for LH (blue) and RH (red) in males and females averaged together (A), in males only (B), and in females only (C). Dashed vertical lines indicate the mean best FM bandwidth of all 256 neurons. D–F: line graphs of predicted outcomes of multilevel modeling measuring the effects of FM bandwidth, sex, and hemisphere (see also Table 2) on the peak responses of DSCF neurons from 6 male (E) and 4 female (F) mustached bats (number of spikes in 10 ms bin). Ordinate is percentage of peak response in a 10-ms bin, and abscissa is FM bandwidth from 0.4 to 7.9 kHz.
We used two repeated-measures ANOVAs (1 per bandwidth range presented; 0.44–5.25 kHz and 0.66–7.88 kHz) to test whether the factors of hemisphere and/or sex impacted the shape of FM bandwidth population-response curves For each range, FM bandwidth had a significant (P < 0.01) main effect such that peak response magnitudes increased with FM bandwidth, as previously reported (Washington and Kanwal 2008). We observed a significant interaction effect of FM bandwidth, hemisphere, and sex along both ranges: 0.44–5.25 kHz (F[11, 1,661] = 3.67, P < 0.01) and 0.66–7.88 kHz (F[11, 1,232] = 3.06, P < 0.01). This interaction effect indicates that there were significant hemispheric differences in the preference of DSCF neurons for FM bandwidths in males but not in females.
We also used multilevel modeling to analyze the response curves elicited by the FM bandwidth arrays at 0.44–5.25 and 0.66–7.88 kHz as a single data set. Figure 8, D–F, shows a set of graphical representations of predicted outcomes of DSCF neural responses to increasing FM bandwidth from 0.4 to 7.9 kHz. Figure 8D shows the predicted percentage of peak response to increasing FM bandwidth for neurons from male and female bats (LH = 150; RH = 104). Figure 8E shows this same relationship in male bats alone (LH = 74; RH = 45), and Fig. 8F shows this relationship in female bats alone (LH = 76; RH = 59). Table 2 shows the correlational coefficients and, in parentheses, the t values associated with the outcomes predicted by this multilevel model. Specifically, when data from both sexes were taken together, there was a significant main effect of FM bandwidth and hemisphere on peak response magnitude but no interaction effect of FM bandwidth and hemisphere over the entire range of 0.44–7.88 kHz. For the broadest bandwidths (4.8–7.9 kHz), not only did FM bandwidth, hemisphere, and sex affect peak response magnitude, but hemisphere and bandwidth interacted to affect peak response magnitude, as well. In males, peak response magnitude was affected by an interaction between FM bandwidth and hemisphere over the entire range of 0.44–7.88 kHz. Although such an interaction effect was not seen over the entire range in females, at the broadest bandwidths, peak response magnitude in females was affected not only by FM bandwidth and hemisphere but also by an interaction between these factors. This interaction effect of FM bandwidth and hemisphere suggests that, in females, right DSCF neurons prefer broader bandwidths than left DSCF neurons. Overall, this analysis, like the repeated-measures ANOVAs discussed above, showed that peak response magnitudes were significantly affected by interaction between hemisphere and FM bandwidth (P < 0.01) such that neurons in the RH of males preferred narrower FM bandwidths than neurons in the LH of males or in both hemispheres of females.
Table 2.
Predicted outcome values and their significance, separated by percentiles of FM bandwidth
| FM Bandwidth |
|||||
|---|---|---|---|---|---|
| Total (0.4–7.9 kHz) | 25th Percentile (0.4–1.8 kHz) | 50th Percentile (1.8–3.5 kHz) | 75th Percentile (3.5–4.8 kHz) | 100th Percentile (4.8–7.9 kHz) | |
| Males + Females | |||||
| Bandwidth | 0.96* | 11.92‡ | −1.41 | −0.16 | −2.76* |
| (2.16) | (4.05) | (−0.37) | (−0.07) | (−2.01) | |
| Hemi. | −5.28† | −5.91 | −12.20 | 5.83 | −25.41* |
| (−2.75) | (−1.37) | (−0.98) | (0.47) | (−2.25) | |
| Sex | 0.26 | −3.92 | −0.71 | 6.68† | 8.81† |
| (0.19) | (−1.60) | (−0.28) | (2.98) | (3.24) | |
| Hemisphere × bandwidth | 1.40 | 0.85 | 4.07 | −0.83 | 4.36* |
| (2.35) | (0.22) | (0.82) | (−0.27) | (2.31) | |
| Intercept | 43.42‡ | 32.59‡ | 52.91‡ | 43.84‡ | 61.78‡ |
| (26.61) | (9.13) | (5.51) | (4.58) | (7.38) | |
| Females | |||||
| Bandwidth | 2.31‡ | 11.13‡ | −0.93 | 1.13 | −3.91* |
| (4.33) | (2.78) | (−0.19) | (0.36) | (−2.38) | |
| Hemi. | −4.21 | −15.40† | −3.12 | 20.49 | −39.94† |
| (−1.65) | (−2.61) | (−0.19) | (1.19) | (−2.77) | |
| Hemisphere × bandwidth | 0.42 | 7.66 | 2.05 | −4.90 | 5.09* |
| (0.57) | (1.44) | (0.31) | (−1.16) | (2.18) | |
| Intercept | 41.17‡ | 31.15‡ | 48.79‡ | 46.20‡ | 82.90‡ |
| (22.07) | (7.04) | (4.02) | (3.67) | (8.11) | |
| Males | |||||
| Bandwidth | −1.25 | 12.76† | −2.73 | −1.99 | −1.10 |
| (−1.67) | (2.97) | (−0.47) | (−0.57) | (−0.45) | |
| Hemisphere | −7.77† | 3.70 | −25.26 | −11.08 | −9.13 |
| (−2.65) | (0.59) | (−1.33) | (−0.60) | (−0.50) | |
| Hemisphere × bandwidth | 3.17† | −5.52 | 7.21 | 3.86 | 4.12 |
| (3.29) | (−1.00) | (0.96) | (0.86) | (1.30) | |
| Intercept | 47.50‡ | 29.51‡ | 59.39‡ | 50.01‡ | 43.16‡ |
| (20.83) | (6.07) | (4.01) | (3.49) | (3.06) | |
Values in each row represent the relationship between a given variable (bandwidth, hemisphere, sex, hemisphere × rate, or variable intercept) determined using the coeffiecient of regression and the corresponding t score (in parentheses), corresponding to Fig. 8, D and E. Values in each column correspond to a different range of FM bandwidths. The first column lists the effects of each variable and the total range of FM bandwidths (0.4–7.9 kHz) on peak response magnitude. The second, third, fourth, and fifth columns, respectively, correspond to the first (0.4–1.8 kHz, or 25%), second (1.8–3.5 kHz, or 50%), third (3.5–4.8 kHz, or 75%), and fourth (4.8–7.9 kHz, or 99.9%) quartiles of the total range of FM bandwidths. Sex is excluded as a variable for predicted outcomes for male and female bats alone. P values show how significantly each variable affected the magnitudes of neural responses (*P < 0.05; †P < 0.01; ‡P < 0.001).
Population-Level Selectivity for FM Central Frequency
We also performed analyses of population-response curves for selectivity of the central frequency in best FMs (data not shown). Although every neuron did not respond maximally when centered on BFhigh, the central frequencies of best FMs were close enough to BFhigh in the vast majority (>80%) of DSCF neurons in both hemispheres and in both sexes so that the best FM always contained BFhigh even if it was not necessarily centered on it. Furthermore, the bell-shaped population-response curves for FM central frequency peaked similarly at BFhigh in both hemispheres in males as well as females. Although changes in FM central frequency alone have a profound impact on the peak response magnitudes of DSCF neurons (Washington and Kanwal 2008), ANOVAs revealed that neither sex (F[1, 114] = 0.178, P = 0.647) nor hemisphere (F[1, 114] = 0.597, P = 0.441) had an effect on peak response magnitudes for values of FM central frequency. Furthermore, no interaction of sex and hemisphere (F[1, 114] = 0.390, P = 0.533) or interaction between FM central frequency, sex, and hemisphere (F[1, 114] = 0.525, P = 0.470) had an effect on peak response magnitude.
The Duration Parameter in FMs
Because FM duration covaries with FM rate and bandwidth, we tested the effect of FM duration on peak response magnitudes. Figure 9, A and B, shows response curves in two neurons for FM rate and bandwidth, respectively. The tuning for both of these FM parameters was unimodal, and that for FM rate was relatively sharp. The two neurons, however, did not show a systematic preference for the same FM duration. Rather, the preferred duration shifted from >131.3 ms to 65.6 ms for the LH neuron and to 32.8 ms for the RH neuron when tested across different FM rates vs. different FM bandwidths.
Fig. 9.
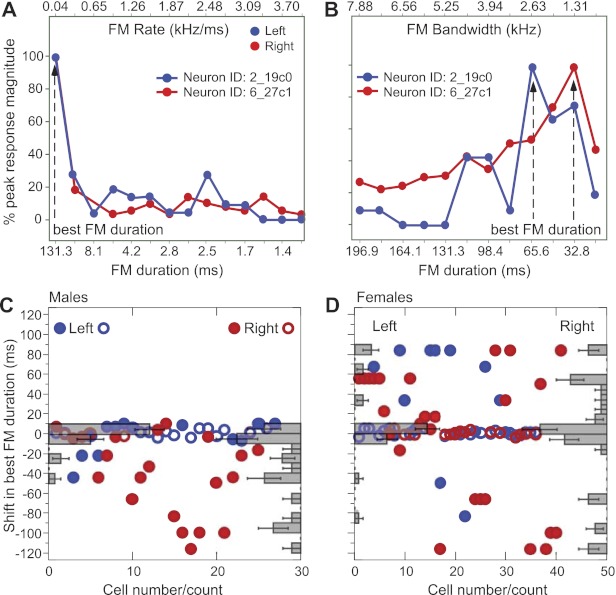
Effect of FM duration on response magnitude. FM rate (A) and FM bandwidth (B) response curves from 2 single DSCF neurons (1 from each hemisphere) of a male mustached bat are shown. Duration scale is computed from rate (bandwidth was fixed at 5.25 kHz in A and 3.5 kHz in B) and bandwidth (rate was fixed at 0.04 kHz/ms) in A and B, respectively. X-axis ticks are labeled for alternate intervals to improve legibility. C: population-response data for shifts in best FM duration computed from the best FM duration in FM bandwidth curves minus the best FM duration in FM rate curves for each side in males (C) and in females (D). Density histograms for the left and right side are superimposed on the respective side of each scatter plot. Duration shifts in neurons on the left and right side that are tuned to fast FMs (≥0.6 kHz/ms) are indicated by open circles, and those tuned to slow FMs (<0.6 kHz/ms) are indicated by filled circles.
A scatter plot of shifts in best FM duration for those computed from FM bandwidth vs. FM rate tuning for the population revealed no clear trends for either side or sex (Fig. 9, C and D). Average shifts in best FM duration were the smallest in the RH of females (mean = −0.61) and the LH of males (mean = −1.34). However, the spread (standard deviation) of shifts was nearly five times larger in the RH of females (53.59, n = 41) compared with the LH of males (11.61, n = 27). In the LH of females, the mean shift was 11.8 (SD = 34.68, n = 36), and in the RH of males it was −33.22 (SD = 38.94, n = 25). R-L differences were significant in males (P = 0.0003, 2-tailed t-test, n = 77) but not in females (P = 0.1133, 2-tailed t-test, n = 52). In males, the best duration computed from a presentation of different FM rates was longer than that computed from the response to different FM bandwidths in the same neuron. In females, the shifts in best FM duration obtained from FM bandwidth tuning could be toward either shorter or longer duration than those obtained from FM rate tuning. This suggests that, overall, neurons in males, especially in the RH, prefer narrower FM bandwidths and/or relatively slow FM rates compared with those in females.
In some neurons, such as those in the LH that preferred wide FM bandwidths when optimized for FM rate, best FM durations could not shift much because fast FMs swept over relatively short durations (<10 ms). In other words, it was very uncommon for neurons tuned to similar FM rates or bandwidths to be also tuned to a best FM duration unless the entire FM was very short. This made the presence of FM (unlike CF) duration tuning within either single neurons or the population in the AC unlikely. There were a few neurons (5/52, or ∼10% in females but none in males), however, in which duration might be the primary constraint influencing response magnitude, i.e., there was virtually no shift in best FM duration tuning to FM rates that were <0.6 kHz/ms. Finally, a plot of averaged relative response magnitudes to different FM durations, similar to the ones plotted for FM rate and FM bandwidth in Figs. 7 and 8, also revealed a complete lack of tuning for particular FM durations within both hemispheres in either sex (not shown). Thus there is a lack of either tuning to or preference for particular FM durations at both the single-unit and population level within the DSCF area in mustached bats.
Best FM Parameters and Their Right-Left Distribution
Next, we examined distributions of best FM parameters to 1) test whether the overall representation of rate, bandwidth, and center frequency is significantly different between the two hemispheres and 2) obtain a graphical representation of how each parameter is distributed between hemispheres given the FM preference of individual neurons. Figure 10, A–D, shows bar graphs and kernel density plots for the distribution of the rate, bandwidth, duration, and central frequency, respectively, of best FMs within each hemisphere of males and females. Bar graphs show the overall hemispheric differences for each FM parameter as mean and SE. Best FM rates were slower in the RH (0.22 ± 0.05 kHz/ms, n = 73) compared with the LH (0.99 ± 0.13 kHz/ms, n = 51) in males, but not in females (0.41 ± 0.51 kHz/ms, n = 65 for LH and 0.47 ± 0.83 kHz/ms, n = 58 for RH) (Fig. 10A). There was also a slight but significant (P < 0.02) difference in best FM bandwidth in males (but not females) such that neurons on the right preferred narrower FM bandwidths (3.49 ± 0.29 kHz) than those on the left (4.39 ± 0.26 kHz). RH neurons preferred longer FMs (34.12 ± 4.94 ms) than those on the left (14.03 ± 1.96 ms) in both sexes (P < 0.01). Nearly one-quarter (18/75) of right DSCF neurons in females had best FM rates of 0.04 kHz/ms and best FM bandwidths ≥4 kHz; thus these FMs exceeded 100 ms. Indeed, some right DSCF neurons in females had best FMs that approached 200 ms in duration (Fig. 10C). FMs with durations ≥100 ms represented only about 10% (7/63) of the best FMs for left DSCF neurons in females.
Fig. 10.
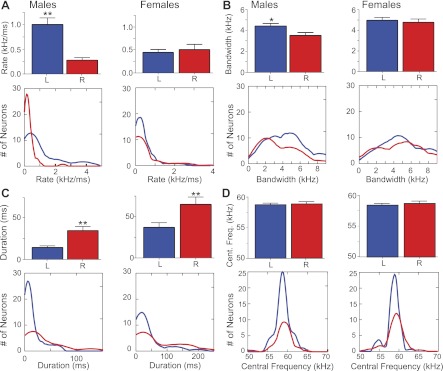
Distribution of different FM parameters between each hemisphere of male and female bats. Bar graphs compare the mean and SE (top), and kernel density plots (bottom) show the distribution of best FM parameters for neurons in the left and right DSCF area in males (124 neurons) and females (123 neurons). Plots are shown for FM rate (A), FM bandwidth (B), FM duration (C), and FM central frequency (D). All neurons in A–D are from the same sample. Significance levels for differences in the RH vs. LH for mean of each FM parameter are as follows: *P = 0.02, FM bandwidth; **P < 0.01, FM rate and FM duration.
ANOVAs revealed a significant main effect of hemisphere on best FM rate (F[1, 243] = 14.28, P < 0.01) and best FM duration (F[1, 243] = 17.70, P < 0.01), but not best FM bandwidth (F[1, 243] = 3.50, P = 0.06), in males. Overall, there was a significant interaction effect of sex and hemisphere on best FM rate (F[1, 243] = 14.28, P < 0.01), but not best FM duration (F[1, 243] = 0.46, P = 0.50) or best FM bandwidth (F[1, 243] = 1.45, P = 0.23), across all neurons.
Kernel density plots show that more than twice as many neurons responded to low FM rates on the right vs. the left side of males, but this relationship was reversed in females. Differences in the distribution of FM bandwidth were apparent beyond 3 kHz in males and between 2 and 5 kHz in females (Fig. 10B). Distribution of central frequency within the best FM was similar on the two sides in both males and females (Fig. 10D).
Temporal Response Parameters of Single Neurons to Their Best FMs
A single unit's temporal response parameters of peak response latency and response duration obtained by 200 presentations of the “best FM” (FMs optimized for rate and bandwidth and paired at onset with a CF at BFlow) at BA were less affected by sex than they were by hemisphere (Fig. 11, A and B). Statistical comparisons of temporal response parameters for best FMs revealed a significant main effect of hemisphere on response-onset latency (F[1, 253] = 15.38, P < 0.01), peak response latency (F[1, 253] = 21.65, P < 0.01), and response duration (F[1, 253] = 10.76, P < 0.01). In response to best FM, peak response latency was significantly (F[1, 253] = 4.68, P < 0.05) affected by sex such that DSCF neurons in both hemispheres had longer peak response latencies to best FMs in females compared with those in males. Sex and hemisphere had no significant interaction effects with response-onset latency, peak response latency, or response duration. Despite significant differences in temporal response parameters, neurons responded to best FMs with similar magnitudes on both sides and in both sexes. Thus the asymmetry in temporal response parameters was independent of response magnitude.
Fig. 11.
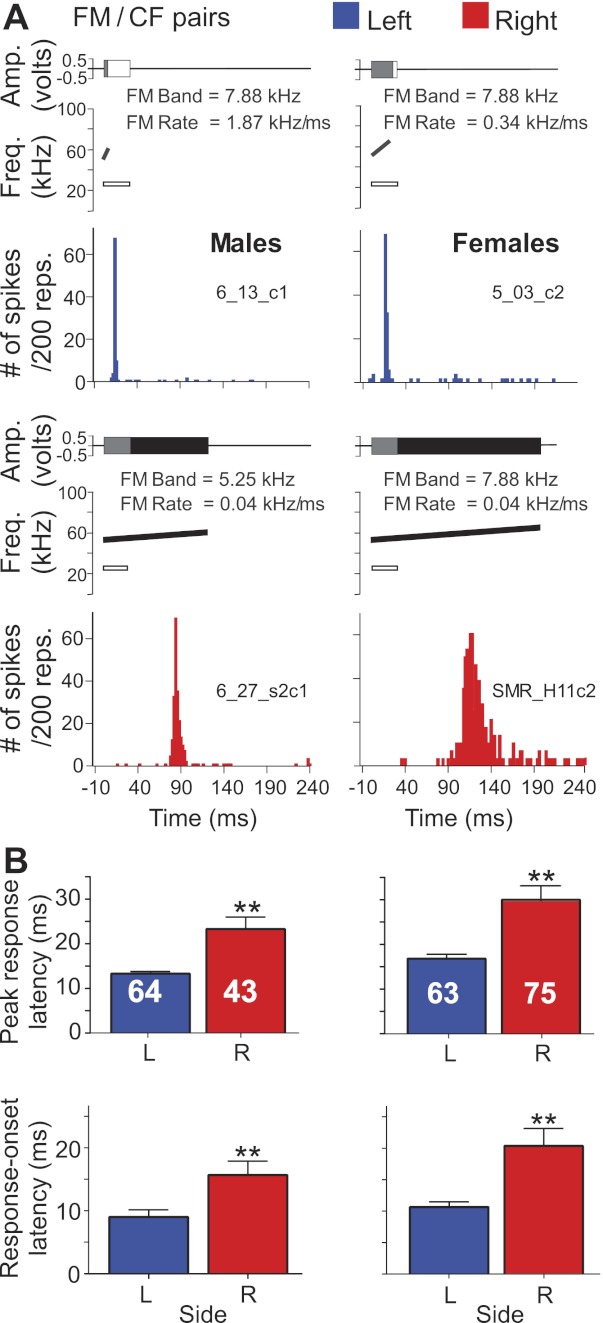
Response profile of DSCF neurons to FM/CF pairs in males and females. A: amplitude envelopes (top) and idealized spectrograms (middle) for optimal FM/CF pairs presented to awake male (left) and female (right) mustached bats. Amplitude envelopes for parametrically optimized FMs and a 30-ms CF at BFlow (∼25 kHz) are superimposed. Peristimulus time histograms (bottom) represent neural responses to stimuli illustrated in the corresponding top panels. B: bar graphs comparing peak response latencies of DSCF neurons in males (**P < 0.01). C: bar graphs comparing response-onset latencies of the same neurons in the right vs. left hemisphere from male bats (**P < 0.01). Stimuli were presented as 200 repetitions at a rate of 4 s−1.
Response Latencies to FMs vs. CFs
Longer latencies observed in right vs. left hemisphere (see Fig. 11) can result from a number of sources. These sources include an intrinsic difference in the membrane properties, such as integration time constants, asymmetric delay lines at the cortical and subcortical levels (Gordon and O'Neill 1998; Razak and Fuzessery 2006), the organization of inhibitory response areas relative to excitatory response areas (Kanwal et al. 1999; Sadagopan and Wang 2010), differences in the timing of inhibitory and excitatory interactions that initiate spiking and maximally excite the neuron (e.g., rebound excitation) (Gittelman and Li 2011; Gittelman and Pollak 2011; Razak and Fuzessery 2006), and/or differences in the duration of FMs preferred by each neuron as a result of duration tuning (Fuzessery et al. 2006). To address the role of one or more of these parameters, we compared response latencies of each neuron with its best CF vs. best FM.
Figure 12, A and B, shows scatter plots of response-onset latencies for FMs vs. CFs for right and left hemispheric neurons in males and females, respectively. Overall, response-onset latencies to FMs tended to be longer than those to CFs in females but less so in males. However, in both sexes, latencies to FMs were longer for DSCF neurons in the right than those in the left hemisphere, as shown in Fig. 11. Not surprisingly, in a majority of the neurons in females and in roughly half of those in males, response-onset latencies to FMs were longer than those to CFs. In the other half of neurons in males and in several neurons in females, response-onset latencies were shorter for FMs than they were for CFs. In some neurons (plotted above the dashed horizontal line) that preferred relatively slow- and long-duration FMs, response-onset latencies to FMs could be four to five times longer than that to their preferred CF. Such neurons were more abundant in females than in males.
Fig. 12.
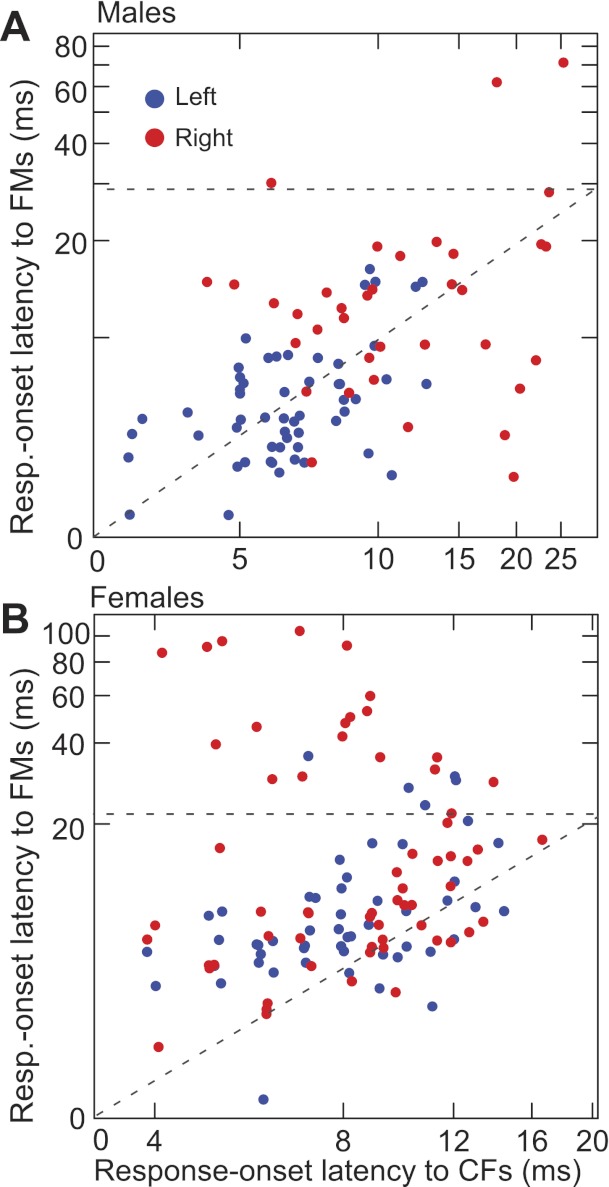
Changes in response latency with CF and FM stimuli. Scatter plots of response-onset latencies for FMs vs. CFs within each neuron are shown for the right (red) vs. left side (blue) in males (A) and females (B). Horizontal dashed lines transect the FM latency axis at values equal to that of the range on the CF latency axis. Diagonal dashed lines represent equivalent response latencies.
Influence of FM Parameters on Peak Response Latency
To further investigate the effect of FM stimulus parameters on peak response latency, in Fig. 13 we plotted peak response latencies to the best FMs of each neuron across hemispheres and sexes for FM bandwidth, FM rate, and FM duration in the left and right hemispheres of males (A–C) and females (D–F). Our data show that best FM rates pooled from neurons within each hemisphere (σ2: RH = 0.06; LH = 1.26) exhibited a wider variance in the LH compared with the RH. Centroids (99% confidence intervals) show the center of mass for data points representing left and right hemispheric DSCF neurons. None of the centroids in any of the three scatter plots in Fig. 13, A–C, intersect, and all of the best FM parameters significantly (P < 0.05) differ between hemispheres. In Fig. 13, D–F, all of the centroids intersect, and the only best FM parameter to significantly differ between hemispheres was FM duration (see Fig. 10C).
Fig. 13.
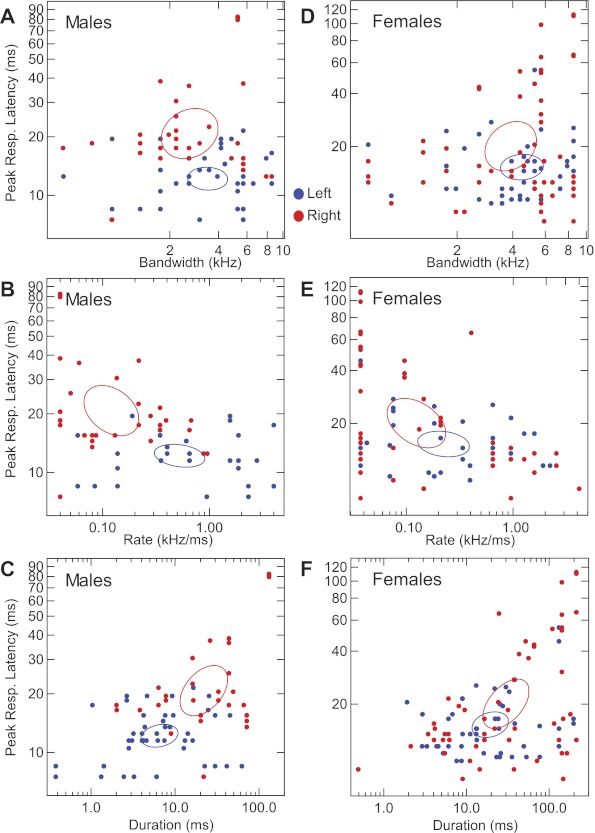
Scatter plots showing effect of FM parameters on peak response latencies. Each data point represents the peak response magnitude of a neuron at its optimal parameter (rate, bandwidth, and duration) value for the best FM shown in left (blue) and right (red) DSCF neurons in males (A–C) and females (D–F). Oval lines are centroids (99% confidence intervals) representing centers of mass for data points related to left (blue ovals) and right (red ovals) DSCF neurons. Best FMs were paired at onset with BFlow. Correlation coefficients and significance levels for latency of the response to the best FM for each parameter in each sex were as follows: males, bandwidth (left: r = 0.10, P = 0.46; right: r = 0.20, P = 0.244), rate (left: r = 0.30, P = 0.026; right: r = 0.29, P = 0.088), and duration (left: r = 0.03, P = 0.849; right: r = 0.73, P < 0.0001); females: bandwidth (left: r = 0.03, P = 0.862; right: r = 0.31, P = 0.022), rate (left: r = 0.21, P = 0.157; right: r = 0.28, P = 0.040), and duration (left: r = 0.36, P = 0.016; right: r = 0.56, P < 0.0001).
Finally, we correlated the best FM parameters of our neurons with the latencies of their peak responses to best FMs. In LH, we observed significant correlations when comparing peak-response latency with best FM rate in males (r = 0.30, P = 0.02) and females (r = 0.28, P = 0.02). In females, but not in males, we observed significant correlations when comparing peak response latency with best FM bandwidth in RH (r = 0.31, P = 0.02) and with best FM duration in LH (r = 0.36, P = 0.02). Most importantly, there was a strong correlation between peak response latency and best FM duration in the RH of both males (r = 0.73, P < 0.0001) and females (r = 0.56, P < 0.0001). Figure 13, C and F, demonstrates that RH neurons in both sexes take longer to respond to FMs that have longer durations, because correlations between FM duration and peak response latency were stronger for right DSCF neurons. These data suggest that peak response latency is strongly influenced by FM duration.
DISCUSSION
Linear FM sweeps overlapping in bandwidth with the CF tuning of DSCF neurons represent spectrotemporally dynamic components of species-specific social calls (Kanwal and Rauschecker 2007; Washington and Kanwal 2008). Unlike different call types, however, artificially synthesized FM sweeps are quantifiable on a continuous scale. This makes them attractive for understanding the neural mechanisms underlying call processing and perception (Washington and Kanwal 2008). The data presented in this study show sex-specific hemispheric differences in neural responses to both CF and FM stimuli. Specifically, in males, neurons in the RH 1) exhibited relatively long peak response latencies to CF as well as FM stimuli and 2) responded more strongly to stimuli with slow rates of modulation and narrow bandwidths approaching a CF than to broadband, fast-rate FMs. Except for response latency to best FM stimuli, pronounced R-L differences were not observed in females with the use of the same procedure. This makes recording bias a highly unlikely explanation of the observed asymmetry.
Hemispheric Asymmetry
The proposed asymmetry for the simultaneous perception of two classes of behaviorally significant events is not unique to bats. Studies of other nonhuman mammalian auditory systems have also reported left hemispheric lateralization for the representation of social calls and communication-related elements within sounds. Macaques (Hauser and Andersson 1994; Heffner and Heffner 1984) and rodents (Ehret 1987; Fitch et al. 1993) exhibit a right-ear advantage (REA) for perception of social calls. Functional imaging and 2-deoxy-d-glucose metabolic studies from rhesus macaques have also reported a left lateralization in the temporal pole (Poremba et al. 2004) for perception of social calls and a right lateralization of the superior temporal gyrus (Poremba and Mishkin 2007) for perception of environmental sounds. In the common marmoset, the organization of responses to pure tones in A1 was not significantly lateralized when tested within the same individual (Philibert et al. 2005), but FMs were not tested in this study. Studies combining foot shock within a fear conditioning paradigm and cortical lesions in gerbils have shown that perception of global vs. local features within FMs is different between the two sides (Wetzel et al. 2008). In these animals, the right side plays a greater role in determining the direction of an FM sweep, whereas the left side plays a dominant role in gap detection between segments of the same FM. These findings together with the results of this study suggest that lateralized processing is common within the auditory cortex of mammals and constitutes an important operational principle for simultaneous processing of multiple parameters within auditory signals.
In humans, neuroimaging results indicate that the right AC prefers slowly as opposed to rapidly modulated acoustic signals (Belin et al. 1998; Boemio et al. 2005), which are similar to the CFs and slow FMs used in the present study. Steady-state signals represent vowels in speech sounds and are also important for the perception of pitch, prosody, and speaker identity (Robin et al. 1990). Inertness to rapidly changing broadband FMs gives the RH an advantage over the LH for detecting small frequency differences over a relatively long timescale. Conversely, the LH exhibits a stronger response than the RH to formant transitions or rapid changes in the predominant frequency in speech sounds. This underlies the classic REA reported for comprehension of speech sounds (Schwartz and Tallal 1980) and is also consistent with multiple timescales of integration proposed as a basis of lateralization of speech perception in humans per the “asymmetric sampling in time” or AST hypothesis (Poeppel 2003). Accordingly, it is thought that the left AC processes rapid signal changes, such as consonant-vowel combinations, whereas the right AC is better at detecting slight changes in pitch or vocal intonation (Schonwiesner et al. 2005; Zatorre and Belin 2001; Zatorre et al. 2002). In patients with lesions in the left temporoparietal junction, the ability to perceive temporal, but not spectral, information is impaired, and vice versa in those with lesions in the right temporoparietal junction (Robin et al. 1990). This type of double dissociation between spectral and temporal information processing is consistent with our findings.
Sex-Specific Asymmetries
An REA for processing rapidly changing spectral information as in tone sequences is prominent in male rather than female rats (Fitch et al. 1993). Sex differences in hemispheric lateralization for vocalization are often reported in songbird studies, which also show more lateralization in males than females (DeVoogd and Nottebohm 1981; Nottebohm and Arnold 1976). Lateralization of song perception in zebra finches changes if the song is from a conspecific (LH) or is the bird's own song (RH) (Poirier et al. 2009). It was found that male zebra finches use both spectral and temporal information to classify long call stimuli by the sex of the bird producing the call but that females use only temporal information (Vicario 2004).
In humans, an interaction of sex hormones with developing neurons (Geschwind and Galaburda 1985a, 1985b) accounts for a less frequent and smaller extent of cerebral lateralization for speech and language in the auditory cortices of females (Dawe and Corballis 1986; Lansdell 1964). Specifically, prenatal exposure to testosterone affects the development of left lateralized brain areas for processing temporal information in speech (Beech and Beauvois 2006). Changes in testosterone levels in infants have been implicated in dysfunctional processing of this information (Geschwind and Galaburda 1985a; Tallal et al. 1988, 1993). Thus sex differences in auditory lateralization are present within many species in different taxonomic groups.
Computational and Cellular Underpinnings of Hemispheric Asymmetry
Next, we consider which parameters of an FM may play the biggest role in generating hemispheric asymmetry. For this, we need to examine the cellular basis of a neuron's response to an FM and how it is different from that to a pure tone. In FM processing neurons, a preferred FM bandwidth is a function of the spatial summation of the input frequencies, whereas a preferred FM sweep rate reflects the rate of temporal summation of a range of frequency inputs (Heil et al. 1992). Integration of wide bandwidths at slow rates extends the time between the best FM's onset and offset of the frequency sweep traversing a neuron's excitatory response area. Per the “leaky integrate-and-fire” model (Jolivet et al. 2004), a mismatch between the FM rate and the integration time constant in AC neurons may prevent the excitatory postsynaptic potential (EPSP) from reaching spiking threshold. Similarly, a narrow range of frequency inputs as in narrowband/slow FM sweeps may lead to a subthreshold EPSP after summation of EPSPs arriving from different dendritic compartments, each of which receives a different frequency input. The amount of spatial summation may also be constrained by inhibitory sidebands skirting and/or overlapping the excitatory/facilitatory tuning of a neuron (Kanwal et al. 1999) so that even broadband FMs fail to trigger spiking activity in narrowly tuned DSCF neurons in the RH. Hence, auditory hemispheric asymmetry may originate from a difference in the bandwidth of excitatory frequency tuning and/or the timescale at which single neurons in the right vs. the left hemisphere integrate auditory inputs (Telkemeyer et al. 2009). Our data on correlations between FM parameters and response latency suggest that because long-duration FMs take longer to traverse a neuron's effective excitatory response area, they therefore elicit responses later compared with shorter FMs preferred by left DSCF neurons.
Interhemispheric interactions can also play an important role in determining response characteristics and/or stimulus selectivity in cortical neurons. In the asymmetry observed here, activity in the LH may directly influence the CF and/or FM responses of DSCF neurons on the opposite side, but this remains to be investigated. The presence of interhemispheric connectivity was reported previously for the ventral portion of the DSCF area on the two sides in mustached bats (Liu and Suga 1997) and is consistent with a report of laminar organization of excitatory-excitatory (E-E) neurons in the A1 of cats (Imig and Reale 1980).
With respect to cellular morphology, one histological study of Nissl-stained cell bodies in the DSCF area found no hemispheric differences in neuronal densities (Sherwood et al. 2005), supporting the possibility of a physiological difference originating from differences in synaptic connectivity within the dendritic arbor as explained above. Because Nissl stains provide only faint staining of dendritic segments proximal to the cell body, this method also misses differences in anatomical characteristics of cortical neurons (e.g., dendritic morphology, symmetry of synaptic densities, or whether neurons are GABAergic or glutamatergic) that are fundamentally important in auditory processing. Alternately, an absence of cytoarchitectural differences within A1 across the two hemispheres may also suggest that hemispheric differences either originate at subcortical levels or result from interhemispheric interactions.
Temporal Summation and Duration Selectivity
The role of FM duration as a parameter that determines FM selectivity in DSCF neurons is not obvious in the cortex, although it does appear to play a role in the inferior colliculus (Fuzessery et al. 2006). Our data show that neurons do not show a systematic preference for duration in either hemisphere of either sex (see Fig. 9, C and D) and that neurons in the right hemisphere in both sexes prefer relatively long-duration (slow rate) FMs (see Fig. 10C). A principal components analysis of the acoustic structure of social calls yielded duration as an acoustic parameter that varies independently of other parameters (Kanwal et al. 1994). Therefore, call duration plays an important role in a classification of calls based on multiple acoustic parameters in different call types. Duration-tuned neurons are known to exist in both the inferior colliculus (Brand et al. 2000; Ehrlich et al. 1997; Fuzessery et al., 2006) and the cortex of bats (Galazyuk and Feng 1997; Razak and Fuzessery 2006) and other species (He et al. 1997), but this does not necessarily mean that duration tuning represents an important underlying attribute for FM selectivity in the cortex. In the AC of pallid bats, as well, FM rate selectivity, at least for rates in the echolocation range, does not depend on duration tuning to tones as it does in the inferior colliculus (Razak and Fuzessery 2006). More recently, Gittelman and Pollak (2011) and Gittelman and Li (2011), using whole cell patch-clamp recordings in the inferior colliculus, have established that spike threshold and the timing of excitatory and inhibitory postsynaptic potentials enhance FM velocity (rate) selectivity. Our findings are generally consistent with previous reports of FM selectivity within the AC, in that cortical neurons do not exhibit a systematic preference for FM duration.
Our results suggest that FM duration is not a primary determinant of the response strength to a particular FM. Right DSCF neurons in males do not integrate over the entire duration or bandwidth of a slow FM because peak responses are often reached well before the end of the FM (see Fig. 11A), and sometimes even during the first half of the stimulus. If neurons were selective for or tuned to a particular duration, then a comparison of a neuron's preference for FM rate and bandwidth would yield a consistent preference for that (same) duration. This was not the case at the level of single units (see Fig. 9). Finally, our selection of the peak response magnitude within a narrow (5 or 10 ms) time window minimizes the influence, if any, of stimulus duration on FM preference. If one adopted the total number of spikes as a response measure, stimulus duration could become a confounding factor, but even so, this is unlikely because DSCF responses are phasic in nature and are greatly dependent on FM direction and rate as well as the FM's central frequency.
With the exception of the long quasi-CF (QCFl) call type, shallow FMs with a duration longer than 50 ms are not commonly present in species-specific social calls (Kanwal et al. 1994), suggesting once again that FM rate may be the main determinant of FM duration selectivity in DSCF neurons. The duration of linear FMs cannot be completely ruled out, however, as an important factor in generating parametric FM selectivity across the two sides, particularly in females. In a few neurons in females, the preferred duration can be longer than 200 ms. These neurons could play an important role in responding to the whistle-like QCFl call type with a small (3.6%) modulation in frequency and a duration that ranges from 105 to 500 ms (Kanwal et al. 1994). This call is frequently produced by this species during affiliative interactions (Clement et al. 2006).
Right-Left Differences in Response Latencies
The data presented in Fig. 12 show that in both males and females, the response-onset latency to a neuron's preferred FM is frequently shifted from that to its preferred CF. In roughly half of the neurons in males, and in several neurons in females, where response-onset latencies to the preferred FM are shorter than those to a preferred CF, an upsweep or downsweep of frequencies leads to a rapid buildup of the EPSP, possibly via rebound excitation (Gittelman and Li 2011; Gittelman and Pollak 2011; Zhang et al. 2003). This suggests the existence of synaptic mechanisms for processing FMs that are different from those for processing the simpler CF stimuli. In other words, response-onset latency is not a fixed, intrinsic property that is determined only by synaptic delays within ascending auditory inputs. Rather, this temporal response parameter as recorded in DSCF neurons is strongly influenced by the acoustic parameters of sounds (see Figs. 12 and 13). Our data showing that left hemispheric neurons frequently have shorter latencies suggests that complex sounds, such as those used for communication, may activate the LH before the RH. Given the presence of multiple frequencies within FMs and communication sounds (Kanwal et al. 1994), the neural circuit activated by complex sounds may be quite different from that activated by a tone. In fact, many cortical neurons in mustached bats, e.g., those in the FM-FM area, are specialized to respond to FMs (Ohlemiller et al. 1996).
The presence of FM specialization, as in the FM-FM and other cortical areas in mustached bats, suggests that the mechanisms determining responses to tone vs. FM stimuli in the DSCF area may also be different. Given that the neurons recorded here respond to both tones and FMs, a comparison between excitatory/inhibitory frequency-response areas and the preferred FM bandwidth for the same neuron could illustrate a possible causal relationship between FM rate/duration and response latency. Because of time constraints (both regulatory and technical) in holding and recording from a single neuron in awake animals, we could not obtain these data. From studies in the squirrel monkey (Godey et al. 2005) and owl monkey (Atencio et al. 2007), however, response latency to different speeds or rates of wideband FMs can be used to predict the bandwidth of excitatory-response areas in the AC. However, FM-specialized, combination-sensitive neurons, as exist in the mustached bat's FM-FM area (Ohlemiller et al. 1996), exhibit tuning to a different frequency range (compared with that present in their best FM) when combinations of pure tones are presented simultaneously. This makes it difficult to assume a linear relationship between latency and FM rate/duration because the neuron treats tones and FMs as somewhat independent and qualitatively different stimuli.
Echolocation vs. Communication
Finally, we consider the behavioral advantage that an R-L asymmetry might bestow on the life of a bat. An R-L difference in FM response properties of neurons may emerge from a behavioral dichotomy in the usage of left vs. right DSCF neurons. Given their poor visual acuity, mustached bats, like most microchiropterans (Suthers and Wallis 1970), must echolocate to track and capture insects on a daily basis to satisfy their high metabolic demand. During echolocation, DSCF neurons track relative target velocity, which is essentially a pitch-perception task requiring high-frequency resolution for detecting minute differences between CFs and/or very low rate (<0.05 kHz/ms) upward FMs in echoes returning from an approaching target (Müller R and Kanwal JS, unpublished observations). Response magnitude curves obtained in this study (see Fig. 8B) show that RH neurons in males are biased to detect approaching targets because their peak response magnitudes increase to CFs and CF-like (very low rate FM) stimuli. More so than those on the right, left hemispheric DSCF neurons in males are highly sensitive to and respond well to stimuli that contain a relatively steep FM, such as the “bent-upward FM” emitted in fear, or traverse a relatively broad bandwidth, such as the “fixed sinusoidal FM” (fSFM) and the “rectangular broadband noise burst” (rBNB) emitted during aggression between males (Clement et al. 2006; Clement and Kanwal 2012). Male bats also emit rBNB calls to achieve or maintain dominance within a colony of thousands of individuals (Clement and Kanwal 2012). Differentiating broadband and fast FMs from very slow FMs and CFs associated with echolocation can be critical for survival. Females are not observed to engage in such aggression, and thus their A1 may not be similarly lateralized as in males. Although sex-specific differences in vocalization frequencies do exist, at least for echolocation (Suga et al. 1987), differential frequency tuning and call selectivity of neurons in males vs. females has not been carefully analyzed.
In summary, although RH neurons may be dedicated to processing echolocation signals carrying information about the environment, many LH neurons in males appear to be designed to process FM rates and bandwidths frequently encountered in processing social calls. In this respect, hemispheric lateralization may serve a function similar to that reported in macaques (Poremba et al. 2004; Poremba and Mishkin 2007). In bats, activity in the left hemispheric DSCF neurons may alert the animal to social exigencies, particularly aggression, that require immediate attention. Rapid activation of LH neurons by broadband calls such as rBNB may in fact modify the sensitivity of the RH to respond to particular acoustic features or FM parameters within a social call. Further studies are required to delineate interhemispheric differences (Kanwal 2012) and interactions for call processing that may result from differences in the processing of spectrotemporal parameters within FMs.
GRANTS
This work was supported in part by National Institutes of Health Grants DC02054 and DC008822 (to J. S. Kanwal), DC75763 (to S. D. Washington), and HD046388 (to V. Gallo).
DISCLOSURES
The funding agencies had no role in study design, data collection and analysis, decision to publish, or preparation of the manuscript. No conflicts of interest, financial or otherwise, are declared by the authors.
AUTHOR CONTRIBUTIONS
Author contributions: S.D.W. and J.S.K. conception and design of research; S.D.W. performed experiments; S.D.W. and J.S.K. analyzed data; S.D.W. and J.S.K. interpreted results of experiments; S.D.W. and J.S.K. prepared figures; S.D.W. and J.S.K. drafted manuscript; S.D.W. and J.S.K. edited and revised manuscript; S.D.W. and J.S.K. approved final version of manuscript.
ACKNOWLEDGMENTS
We acknowledge the Ministry of Agriculture, Land and Marine Resources in Trinidad, which kindly permitted us to export mustached bats, and F. Muradali, who assisted with collection and exportation procedures. We thank Dr. Ru San Chen for advice with the statistical analysis, Dr. Robert T. Naumann for assistance with data analyses, and Dr. Gerd Schüller and Leon Der for the design and fabrication of the stereotaxic recording setup.
REFERENCES
- Atencio CA, Blake DT, Strata F, Cheung SW, Merzenich MM, Schreiner CE. Frequency-modulation encoding in the primary auditory cortex of the awake owl monkey. J Neurophysiol 98: 2182–2195, 2007 [DOI] [PubMed] [Google Scholar]
- Beech JR, Beauvois MW. Early experience of sex hormones as a predictor of reading, phonology, and auditory perception. Brain Lang 96: 49–58, 2006 [DOI] [PubMed] [Google Scholar]
- Belin P, Zilbovicius M, Crozier S, Thivard L, Fontaine A. Lateralization of speech and auditory temporal processing. J Cogn Neurosci 536–540, 1998 [DOI] [PubMed] [Google Scholar]
- Boemio A, Fromm S, Braun A, Poeppel D. Hierarchical and asymmetric temporal sensitivity in human auditory cortices. Nat Neurosci 8: 389–395, 2005 [DOI] [PubMed] [Google Scholar]
- Brand A, Urban R, Grothe B. Duration tuning in the mouse auditory midbrain. J Neurophysiol 84: 1790–1799, 2000 [DOI] [PubMed] [Google Scholar]
- Brown CP, Fitch RH, Tallal P. Sex and hemispheric differences for rapid auditory processing in normal adults. Laterality 4: 39–50, 1999 [DOI] [PubMed] [Google Scholar]
- Clement MJ, Dietz N, Gupta P, Kanwal JS. Audiovocal communication and social behavior in mustached bats. In: Behavior and Neurodynamics for Auditory Communication, edited by Kanwal JS, Ehret G. Cambridge, UK: Cambridge University Press, 2006, p. 57–84 [Google Scholar]
- Clement MJ, Kanwal JS. Simple syllabic calls accompany discrete behavior patterns in captive Pteronotus parnellii: an illustration of the motivation-structure hypothesis. ScientificWorldJournal 2012: 128695, 2012 [DOI] [PMC free article] [PubMed] [Google Scholar]
- Dawe S, Corballis MC. The influence of gender, handedness and head-turn on auditory asymmetries. Neuropsychologia 24: 857–862, 1986 [DOI] [PubMed] [Google Scholar]
- DeVoogd TJ, Nottebohm F. Sex differences in dendritic morphology of a song control nucleus in the canary: a quantitative Golgi study. J Comp Neurol 196: 309–316, 1981 [DOI] [PubMed] [Google Scholar]
- Divenyi PL, Robinson AJ. Nonlinguistic auditory capabilities in aphasia. Brain Lang 37: 290–326, 1989 [DOI] [PubMed] [Google Scholar]
- Ehret G. Left hemisphere advantage in the mouse brain for recognizing ultrasonic communication calls. Nature 325: 249–251, 1987 [DOI] [PubMed] [Google Scholar]
- Ehrlich D, Casseday JH, Covey E. Neural tuning to sound duration in the inferior colliculus of the big brown bat, Eptesicus fuscus. J Neurophysiol 77: 2360–2372, 1997 [DOI] [PubMed] [Google Scholar]
- Esser KH, Condon CJ, Suga N, Kanwal JS. Syntax processing by auditory cortical neurons in the FM-FM area of the mustached bat Pteronotus parnellii. Proc Natl Acad Sci USA 94: 14019–14024, 1997 [DOI] [PMC free article] [PubMed] [Google Scholar]
- Fitch RH, Brown CP, O'Connor K, Tallal P. Functional lateralization for auditory temporal processing in male and female rats. Behav Neurosci 107: 844–850, 1993 [DOI] [PubMed] [Google Scholar]
- Fitzpatrick DC, Kanwal JS, Butman JA, Suga N. Combination-sensitive neurons in the primary auditory cortex of the mustached bat. J Neurosci 13: 931–940, 1993 [DOI] [PMC free article] [PubMed] [Google Scholar]
- Fuzessery ZM, Richardson MD, Coburn MS. Neural mechanisms underlying selectivity for the rate and direction of frequency-modulated sweeps in the inferior colliculus of the pallid bat. J Neurophysiol 96: 1320–1336, 2006 [DOI] [PubMed] [Google Scholar]
- Galazyuk AV, Feng AS. Encoding of sound duration by neurons in the auditory cortex of the little brown bat, Myotis lucifugus. J Comp Physiol A 180: 301–311, 1997 [DOI] [PubMed] [Google Scholar]
- Geschwind N, Galaburda AM. Cerebral lateralization. Biological mechanisms, associations, pathology: I. A hypothesis and a program for research. Arch Neurol 42: 428–459, 1985a [DOI] [PubMed] [Google Scholar]
- Geschwind N, Galaburda AM. Cerebral lateralization. Biological mechanisms, associations, pathology: II. A hypothesis and a program for research. Arch Neurol 42: 521–552, 1985b [DOI] [PubMed] [Google Scholar]
- Geschwind N, Levitsky W. Human brain: left-right asymmetries in temporal speech region. Science 186–187, 1968 [DOI] [PubMed] [Google Scholar]
- Gittelman JX, Li N. FM velocity selectivity in the inferior colliculus is inherited from velocity-selective inputs and enhanced by spike threshold. J Neurophysiol 106: 2399–2414, 2011 [DOI] [PMC free article] [PubMed] [Google Scholar]
- Gittelman JX, Pollak GD. It's about time: how input timing is used and not used to create emergent properties in the auditory system. J Neurosci 31: 2576–2583, 2011 [DOI] [PMC free article] [PubMed] [Google Scholar]
- Godey B, Atencio CA, Bonham BH, Schreiner CE, Cheung SW. Functional organization of squirrel monkey primary auditory cortex: responses to frequency-modulation sweeps. J Neurophysiol 94: 1299–1311, 2005 [DOI] [PubMed] [Google Scholar]
- Gordon M, O'Neill WE. Temporal processing across frequency channels by FM selective auditory neurons can account for FM rate selectivity. Hear Res 122: 97–108, 1998 [DOI] [PubMed] [Google Scholar]
- Hauser MD, Andersson K. Left hemisphere dominance for processing vocalizations in adult, but not infant, rhesus monkeys: field experiments. Proc Natl Acad Sci USA 91: 3946–3948, 1994 [DOI] [PMC free article] [PubMed] [Google Scholar]
- He J, Hashikawa T, Ojima H, Kinouchi Y. Temporal integration and duration tuning in the dorsal zone of cat auditory cortex. J Neurosci 17: 2615–2625, 1997 [DOI] [PMC free article] [PubMed] [Google Scholar]
- Heffner HE, Heffner RS. Temporal lobe lesions and perception of species-specific vocalizations by Macaques. Science 226: 75–76, 1984 [DOI] [PubMed] [Google Scholar]
- Heil P, Langner G, Scheich H. Processing of frequency-modulated stimuli in the chick auditory cortex analogue: evidence for topographic representations and possible mechanisms of rate and directional sensitivity. J Comp Physiol A 171: 583–600, 1992 [DOI] [PubMed] [Google Scholar]
- Imig TJ, Reale RA. Patterns of cortico-cortical connections related to tonotopic maps in cat auditory cortex. J Comp Neurol 192: 293–332, 1980 [DOI] [PubMed] [Google Scholar]
- Jamison HL, Watkins KE, Bishop DV, Matthews PM. Hemispheric specialization for processing auditory nonspeech stimuli. Cereb Cortex 16: 1266–1275, 2006 [DOI] [PubMed] [Google Scholar]
- Jolivet R, Lewis TJ, Gerstner W. Generalized integrate-and-fire models of neuronal activity approximate spike trains of a detailed model to a high degree of accuracy. J Neurophysiol 92: 959–976, 2004 [DOI] [PubMed] [Google Scholar]
- Kanwal JS. Processing species-specific calls by combination-sensitive neurons in an echolocating bat. In: The Design of Animal Communication, edited by Hauser MD, Konishi M. Cambridge, MA: MIT Press, 1999, p. 135–157 [Google Scholar]
- Kanwal JS. Right-left asymmetry in the cortical processing of sounds for social communication vs. navigation in mustached bats. Eur J Neurosci 35: 257–270, 2012 [DOI] [PubMed] [Google Scholar]
- Kanwal JS, Fitzpatrick DC, Suga N. Facilitatory and inhibitory frequency tuning of combination-sensitive neurons in the primary auditory cortex of mustached bats. J Neurophysiol 82: 2327–2345, 1999 [DOI] [PubMed] [Google Scholar]
- Kanwal JS, Matsumura S, Ohlemiller K, Suga N. Analysis of acoustic elements and syntax in communication sounds emitted by mustached bats. J Acoust Soc Am 96: 1229–1254, 1994 [DOI] [PubMed] [Google Scholar]
- Kanwal JS, Rauschecker JP. Auditory cortex of bats and primates: managing species-specific calls for social communication. Front Biosci 12: 4621–4640, 2007 [DOI] [PMC free article] [PubMed] [Google Scholar]
- Lansdell H. Sex differences in hemispheric asymmetries of the human brain. Nature 203: 550, 1964 [DOI] [PubMed] [Google Scholar]
- Liberman AM, Delattre PC, Gerstman LJ, Cooper FS. Tempo of frequency change as a cue for distinguishing classes of speech sounds. J Exp Psychol 52: 127–137, 1956 [DOI] [PubMed] [Google Scholar]
- Liu W, Suga N. Binaural and commissural organization of the primary auditory cortex of the mustached bat. J Comp Physiol A 181: 599–605, 1997 [DOI] [PubMed] [Google Scholar]
- Makela AM, Alku P, May PJ, Makinen V, Tiitinen H. Left-hemispheric brain activity reflects formant transitions in speech sounds. Neuroreport 16: 549–553, 2005 [DOI] [PubMed] [Google Scholar]
- McGlone J. Sex differences in the cerebral organization of verbal functions in patients with unilateral brain lesions. Brain 100: 775–793, 1977 [DOI] [PubMed] [Google Scholar]
- Medvedev AV, Kanwal JS. Local field potentials and spiking activity in the primary auditory cortex in response to social calls. J Neurophysiol 92: 52–65, 2004 [DOI] [PubMed] [Google Scholar]
- Merzenich MM, Jenkins WM, Johnston P, Schreiner C, Miller SL, Tallal P. Temporal processing deficits of language-learning impaired children ameliorated by training. Nature 271: 77–84, 1996 [DOI] [PubMed] [Google Scholar]
- Nagarajan S, Mahncke H, Salz T, Tallal P, Roberts T, Merzenich MM. Cortical auditory signal processing in poor readers. Proc Natl Acad Sci USA 96: 6483–6488, 1999 [DOI] [PMC free article] [PubMed] [Google Scholar]
- Nottebohm F, Arnold AP. Sexual dimorphism in vocal control areas of the songbird brain. Science 194: 211–213, 1976 [DOI] [PubMed] [Google Scholar]
- O'Neill WE, Suga N. Target range-sensitive neurons in the auditory cortex of the mustache bat. Science 203: 69–73, 1979 [DOI] [PubMed] [Google Scholar]
- Ohlemiller KK, Kanwal JS, Suga N. Facilitative responses to species-specific calls in cortical FM-FM neurons of the mustached bat. Neuroreport 7: 1749–1755, 1996 [DOI] [PubMed] [Google Scholar]
- Philibert B, Beitel RE, Nagarajan SS, Bonham BH, Schreiner CE, Cheung SW. Functional organization and hemispheric comparison of primary auditory cortex in the common marmoset (Callithrix jacchus). J Comp Neurol 487: 391–406, 2005 [DOI] [PubMed] [Google Scholar]
- Poeppel D. The analysis of speech in different temporal integration windows: cerebral lateralization as ‘asymmetric sampling in time’. Speech Commun 41: 245–255 2003 [Google Scholar]
- Poirier C, Boumans T, Verhoye M, Balthazart J, Van der Linden A. Own-song recognition in the songbird auditory pathway: selectivity and lateralization. J Neurosci 29: 2252–2258, 2009 [DOI] [PMC free article] [PubMed] [Google Scholar]
- Poremba A, Malloy M, Saunders RC, Carson RE, Herscovitch P, Mishkin M. Species-specific calls evoke asymmetric activity in the monkey's temporal poles. Nature 427: 448–451, 2004 [DOI] [PubMed] [Google Scholar]
- Poremba A, Mishkin M. Exploring the extent and function of higher-order auditory cortex in rhesus monkeys. Hear Res 229: 14–23, 2007 [DOI] [PMC free article] [PubMed] [Google Scholar]
- Rauschecker JP, Scott SK. Maps and streams in the auditory cortex: nonhuman primates illuminate human speech processing. Nat Neurosci 12: 718–724, 2009 [DOI] [PMC free article] [PubMed] [Google Scholar]
- Razak KA, Fuzessery ZM. Neural mechanisms underlying selectivity for the rate and direction of frequency-modulated sweeps in the auditory cortex of the pallid bat. J Neurophysiol 96: 1320–1336, 2006 [DOI] [PubMed] [Google Scholar]
- Robin DA, Tranel D, Damasio H. Auditory perception of temporal and spectral events in patients with focal left and right cerebral lesions. Brain Lang 39: 539–555, 1990 [DOI] [PubMed] [Google Scholar]
- Robinson T, Fallside FC. A recurrent error propagation network speech recognition system. Comput Speech Lang 5: 259–274, 1991 [Google Scholar]
- Sadagopan S, Wang X. Contribution of inhibition to stimulus selectivity in primary auditory cortex of awake primates. J Neurosci 30: 7314–7325, 2010 [DOI] [PMC free article] [PubMed] [Google Scholar]
- Schonwiesner M, Rubsamen R, von Cramon DY. Hemispheric asymmetry for spectral and temporal processing in the human antero-lateral auditory belt cortex. Eur J Neurosci 22: 1521–1528, 2005 [DOI] [PubMed] [Google Scholar]
- Schwartz J, Tallal P. Rate of acoustic change may underlie hemispheric specialization for speech perception. Science 207: 1380–1381, 1980 [DOI] [PubMed] [Google Scholar]
- Shaywitz BA, Shaywitz SE, Pugh KR, Constable RT, Skudlarski P, Fulbright RK, Bronen RA, Fletcher JM, Shankweiler DP, Katz L, Gore JC. Sex differences in the functional organization of the brain for language. Nature 373: 607–609, 1995 [DOI] [PubMed] [Google Scholar]
- Sherwood CC, Raghanti MA, Wenstrup JJ. Is humanlike cytoarchitectural asymmetry present in another species with complex social vocalization? A stereologic analysis of mustached bat auditory cortex. Brain Res 1045: 164–174, 2005 [DOI] [PubMed] [Google Scholar]
- Stone J. Sampling properties of microelectrodes assessed in the cat's retina. J Neurophysiol 36: 1071–1079, 1973 [DOI] [PubMed] [Google Scholar]
- Suga N. Philosophy and stimulus design for neuroethology of complex-sound processing. Philos Trans R Soc Lond B Biol Sci 336: 423–428, 1992 [DOI] [PubMed] [Google Scholar]
- Suga N, Jen PH. Disproportionate tonotopic representation for processing CF-FM sonar signals in the mustache bat auditory cortex. Science 194: 542–544, 1976 [DOI] [PubMed] [Google Scholar]
- Suga N, Niwa H, Taniguchi I, Margoliash D. The personalized auditory cortex of the mustached bat: adaptation for echolocation. J Neurophysiol 58: 643–654, 1987 [DOI] [PubMed] [Google Scholar]
- Suga N, O'Neill WE, Kujirai K, Manabe T. Specificity of combination-sensitive neurons for processing of complex biosonar signals in auditory cortex of the mustached bat. J Neurophysiol 49: 1573–1626, 1983 [DOI] [PubMed] [Google Scholar]
- Suthers RA, Wallis NE. Optics of the eyes of echolocating bats. J Vision Res 10: 1165–1117, 1970 [DOI] [PubMed] [Google Scholar]
- Tallal P, Curtiss S, Kaplan R. The San Diego longitudinal study: evaluating the outcomes of preschool impairment in language development. In: International Perspectives on Communication Disorders, edited by Gerber SE, Mencher GT. Washington, DC: Gallaudet Univ. Press, 1988, p. 86–126 [Google Scholar]
- Tallal P, Miller S, Fitch RH. Neurobiological basis of speech: a case for the preeminence of temporal processing. Ann NY Acad Sci 682: 27–47, 1993 [DOI] [PubMed] [Google Scholar]
- Telkemeyer S, Rossi S, Koch SP, Nierhaus T, Steinbrink J, Poeppel D, Obrig H, Wartenburger I. Sensitivity of newborn auditory cortex to the temporal structure of sounds. J Neurosci 29: 14726–14733, 2009 [DOI] [PMC free article] [PubMed] [Google Scholar]
- Temple E, Poldrack RA, Protopapas A, Nagarajan S, Salz T, Tallal P, Merzenich MM, Gabrieli JD. Disruption of the neural response to rapid acoustic stimuli in dyslexia: evidence from functional MRI. Proc Natl Acad Sci USA 97: 13907–13912, 2000 [DOI] [PMC free article] [PubMed] [Google Scholar]
- Vicario DS. Using learned calls to study sensory-motor integration in songbirds. Ann NY Acad Sci 1016: 246–262, 2004 [DOI] [PubMed] [Google Scholar]
- Washington SD, Kanwal JS. Linear FM synthesis: test stimuli for rapid analysis of auditory neurodynamics. Hoya Tech Res Bull: 2004120S, 2004 [Google Scholar]
- Washington SD, Kanwal JS. DSCF neurons within the primary auditory cortex of the mustached bat process frequency modulations present within social calls. J Neurophysiol 100: 3285–3304, 2008 [DOI] [PMC free article] [PubMed] [Google Scholar]
- Wetzel W, Ohl FW, Scheich H. Global versus local processing of frequency-modulated tones in gerbils: an animal model of lateralized auditory cortex functions. Proc Natl Acad Sci USA 105: 6753–6758, 2008 [DOI] [PMC free article] [PubMed] [Google Scholar]
- Xiao Z, Suga N. Reorganization of the cochleotopic map in the bat's auditory system by inhibition. Proc Natl Acad Sci USA 99: 15743–15748, 2002 [DOI] [PMC free article] [PubMed] [Google Scholar]
- Zatorre RJ, Belin P. Spectral and temporal processing in human auditory cortex. Cereb Cortex 11: 946–953, 2001 [DOI] [PubMed] [Google Scholar]
- Zatorre RJ, Belin P, Penhune VB. Structure and function of auditory cortex: music and speech. Trends Cogn Sci 6: 37–46, 2002 [DOI] [PubMed] [Google Scholar]
- Zhang LI, Tan AY, Schreiner CE, Merzenich MM. Topography and synaptic shaping of direction selectivity in primary auditory cortex. Nature 424: 201–205, 2003 [DOI] [PubMed] [Google Scholar]