

Abstract
The basal ganglia-recipient thalamus receives inhibitory inputs from the pallidum and excitatory inputs from cortex, but it is unclear how these inputs interact during behavior. We recorded simultaneously from thalamic neurons and their putative synaptically connected pallidal inputs in singing zebra finches. We find, first, that each pallidal spike produces an extremely brief (∼5 ms) pulse of inhibition that completely suppresses thalamic spiking. As a result, thalamic spikes are entrained to pallidal spikes with submillisecond precision. Second, we find that the number of thalamic spikes that discharge within a single pallidal interspike interval (ISI) depends linearly on the duration of that interval but does not depend on pallidal activity prior to the interval. In a detailed biophysical model, our results were not easily explained by the postinhibitory “rebound” mechanism previously observed in anesthetized birds and in brain slices, nor could most of our data be characterized as “gating” of excitatory transmission by inhibitory pallidal input. Instead, we propose a novel “entrainment” mechanism of pallidothalamic transmission that highlights the importance of an excitatory conductance that drives spiking, interacting with brief pulses of pallidal inhibition. Building on our recent finding that cortical inputs can drive syllable-locked rate modulations in thalamic neurons during singing, we report here that excitatory inputs affect thalamic spiking in two ways: by shortening the latency of a thalamic spike after a pallidal spike and by increasing thalamic firing rates within individual pallidal ISIs. We present a unifying biophysical model that can reproduce all known modes of pallidothalamic transmission—rebound, gating, and entrainment—depending on the amount of excitation the thalamic neuron receives.
Keywords: songbird, basal ganglia, globus pallidus, behavior
the pallido-recipient thalamus is a critical bottleneck through which basal ganglia (BG) outputs can feed back to cortex to influence behavior (Alexander et al. 1990; Bar-Gad et al. 2003; Hikosaka 2007). These thalamic nuclei receive an inhibitory projection from pallidal areas as well as excitatory inputs from motor cortical areas (Deniau et al. 1978; Kultas-Ilinsky et al. 1978, 2003; Kunzle 1976; MacLeod et al. 1980; McFarland and Haber 2002). The integration of cortical and pallidal inputs is thought to play a key role in the function of this central node of cortical-BG interaction (Haber and McFarland 2001; Marsden and Obeso 1995; Sherman and Guillery 2006; Zweig 1995).
Several views of signal processing in pallido-recipient thalamus have been advanced. A dominant view is that thalamic activity is tonically suppressed by the firing of constitutively active pallidal neurons and that pauses in this pallidal activity disinhibit thalamic neurons, allowing them to spike (Deniau and Chevalier 1985; Hikosaka 2007). In some descriptions of this view, spiking of thalamic neurons during pallidal pauses represents an “inverted” copy of pallidal activity (Albin et al. 1989; DeLong 1990; Mink 1996), while other descriptions emphasize that pallidal pauses may open a “gate” for the further transmission of glutamatergic inputs to BG-recipient thalamus (Chevalier and Deniau 1990; Guo et al. 2008; Horak and Anderson 1984). Early on, it was posited that cerebellar inputs were a predominant source of excitatory input to pallido-recipient thalamus, and that the BG thus gated cerebello-thalamocortical transmission (Buee et al. 1986; MacLeod and James 1984; Strick 1976). More recent anatomical and functional evidence demonstrated that pallidal and cerebellar zones of the thalamus are largely distinct, and that the main excitatory projections to the pallidal-recipient thalamus arise instead from cortex (Anderson and Turner 1991; Asanuma et al. 1983; Buford et al. 1996; Ilinsky and Kultas-Ilinsky 1984; Rouiller et al. 1994; Schell and Strick 1984; Tracey et al. 1980).
Another view of the pallidothalamic interaction—the “rebound” mechanism—is based on the observation that, under some conditions, excitatory synaptic input is not required at all for thalamic spiking (Person and Perkel 2005). Instead, a specific pattern of acceleration and deceleration of inhibitory pallidal activity can activate thalamic neurons through deinactivation and subsequent activation of intrinsic low-threshold calcium channels (Pare et al. 1990; Person and Perkel 2007; Steriade 2001).
The songbird offers a unique model system in which to study signal transmission through BG, thalamic, and cortical circuitry. Songbirds have a BG thalamocortical loop that is required for song learning and that is homologous to mammalian circuitry in several respects (Doupe et al. 2005; Gale and Perkel 2010). The songbird area X contains the same striatal and pallidal cell classes that are found in mammalian BG (Carrillo and Doupe 2004; Farries and Perkel 2002), including a possible segregation into direct and indirect pathways (Farries et al. 2005; Goldberg et al. 2010; Kubikova et al. 2010). In addition, the singing-related firing patterns of songbird BG cell classes resemble firing patterns observed in corresponding mammalian cell types during behavior (Goldberg and Fee 2010; Hessler and Doupe 1999). The output of the songbird area X is a long-range GABAergic projection to the thalamic nucleus DLM (Kubikova et al. 2007; Luo and Perkel 1999b; Reiner et al. 2004a). Finally, just as pallido-recipient thalamus in mammals receives a glutamatergic cortical projection (Kunzle 1976; McFarland and Haber 2002), DLM receives excitatory, glutamatergic inputs from the motor cortical nucleus RA (Luo and Perkel 2002; Vates et al. 1997; Wada et al. 2004; Wild 1993). The existence of convergent cortical and pallidal inputs to the thalamus in both songbirds and mammals suggests that this is an important and evolutionarily conserved feature of vertebrate BG circuitry (Reiner 2009; Reiner et al. 2005).
Study of the integration of cortical and pallidal inputs in the BG-recipient thalamus is experimentally tractable in songbirds. In the zebra finch, each neuron in the thalamic nucleus DLM is innervated by a single large calyxlike pallidal axon terminal that can be recorded extracellularly (Fig. 1, A–C), allowing simultaneous observation of the pre- and postsynaptic spikes of a pallidothalamic pair (Person and Perkel 2007). Such recordings in brain slice and in anesthetized birds have provided strong evidence that DLM neurons are driven by a postinhibitory rebound (PIR) mechanism (Kojima and Doupe 2009; Leblois et al. 2009; Person and Perkel 2005). However, contrary to this view, DLM neurons can fire at high rates even after pallidal inactivation (Kojima and Doupe 2009). Furthermore, DLM neurons recorded in singing birds exhibit song-locked modulations that are most naturally explained by excitatory inputs from cortical neurons projecting to DLM, which exhibit similar modulations (Goldberg and Fee 2012). These findings suggest that the dynamics of the pallidothalamic interaction may depend strongly on experimental conditions and on the state of the bird, perhaps reflecting the sensitivity of thalamic neurons to arousal and anesthesia (Franks 2008; Llinas and Steriade 2006).
Fig. 1.
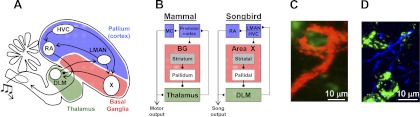
Cortical and pallidal inputs to the thalamus. A and B: schematic of the avian song system. While songbirds do not have a mammalian-like layered neocortex, their pallium has homologous structures (referred to hereafter as cortical) (Jarvis 2004). Lateral magnocellular nucleus of the anterior nidopallium (LMAN) and HVC (proper name), area X, and DLM constitute the cortical, basal ganglia (BG), and thalamic portions of the anterior forebrain pathway (AFP). LMAN forms the output of the AFP through its projection to RA, a motor cortical (MC) nucleus, which in turn projects to motoneurons in the brain stem. C and D: confocal images of thalamic neurons in DLM (green) and inputs from a calyceal pallidal axon terminal (red; C) and RA axon terminals (blue; D).
Here we test models of thalamic function by examining in detail the effect of pallidal and cortical inputs on thalamic spiking in awake, singing birds. We describe a novel mode of the pallidothalamic interaction, termed entrainment, in which each pallidal spike results in a brief period of near-absolute thalamic spike suppression, producing precise temporal locking of the thalamic spike train. Between pallidal pulses of inhibition, thalamic neurons fire at a high constant rate such that the number of thalamic spikes within a pallidal interspike interval (ISI) depends linearly on the duration of that interval, and does not depend on pallidal activity preceding the most recent pallidal spike. Finally, we examine a detailed biophysical model that, depending on the level of glutamatergic input to the thalamic neuron, captures a diversity of behavior in thalamic neurons—from rebound bursting, to gating, to the entrainment mode observed in singing birds. We conclude by presenting a simple conceptual model for the response of thalamic neurons to pallidal and cortical inputs.
MATERIALS AND METHODS
Animals.
Subjects were juvenile male zebra finches (n = 32) [36–70 days post hatch (dph)] and one additional young adult (110 dph) singing undirected song. Birds were obtained from the Massachusetts Institute of Technology zebra finch breeding facility (Cambridge, MA). The care and experimental manipulation of the animals were carried out in accordance with guidelines of the National Institutes of Health and were reviewed and approved by the Massachusetts Institute of Technology Committee on Animal Care.
Chronic neural recordings and histology.
With motorized microdrives for chronic neural recordings (Fee and Leonardo 2001), electrodes were implanted into DLM (n = 32 birds implanted). Single-neuron and paired recordings were carried out as described previously (Goldberg et al. 2010), and data were obtained in 10 birds. Units accepted for analysis had signal-to-noise ratios (average amplitude of spike peaks compared with SD of noise) of >10:1. Antidromic identification of lateral nucleus of the anterior nidopallium (LMAN)-projecting DLM neurons was carried out with a bipolar stimulating electrode implanted in LMAN with techniques described previously (Goldberg and Fee 2012) (stimulation intensities: 50–300 μA for 200 μs). All of the antidromically identified DLM neurons in our data set were validated with collision tests. At the conclusion of experiments, small electrolytic lesions (20 μA for 15 s) were made through the recording and stimulation electrodes for histological verification of electrode positions. Of the 29 DLM neurons, 17 were antidromically identified and collision tested. The other 12 neurons did not respond to LMAN stimulation with a short-latency spike, but exhibited spike waveforms, firing patterns, and multipeaked ISI distributions similar to the identified projection neurons and were included in the analysis. We suspect that these were LMAN-projecting DLM neurons but that they did not project to the part of LMAN activated by the stimulation electrode in DLM.
To visualize pallidal terminals and thalamic neurons in DLM (Fig. 1C), Alexa Dextran-555 (Molecular Probes) was injected into area X for anterograde labeling of calyceal terminals and Alexa Dextran-647 was injected into LMAN for retrograde labeling of thalamic neurons. To visualize RA axon terminals in DLM (Fig. 1D), HSV virus expressing GFP on a CMV promoter (MIT viral core facility) was injected into RA, and cholera toxin β-subunit (Molecular Probes) was injected into LMAN. Brain slices (100 μm) were imaged with a Nikon PCM2000 confocal microscope, and ImageJ was used to merge serial sections.
Data analysis.
Data were acquired and analyzed with custom MATLAB software (A. Andalman, D. Aronov, M. S. Fee, and J. H. Goldberg). We represented neural activities as instantaneous firing rates, R(t), defined at each time point as the inverse of the enclosed ISI as follows:
where ti is the time of the ith spike. Spikes were sorted off-line with custom MATLAB software (J. H. Goldberg and M. S. Fee). To sort spikes from pairs simultaneously recorded on the same electrode, we developed a template-matching spike sorting algorithm that automatically detected and assigned identity to spike overlaps.
One parameter in our analysis of the paired recordings is the duration of the brief delay between pallidal spikes and the onset of thalamic spike suppression (δ, green bracket, Fig. 2C), which was typically in the range of 0.5–1.0 ms. Because the shortest duration of pallidal spike suppression we observed was ∼3 ms, only thalamic spikes occurring <1.5 ms after a pallidal spike were used for the calculation of δ. δ was then determined as the 90th percentile of the latency of all thalamic spikes following pallidal spikes within this time window.
Fig. 2.
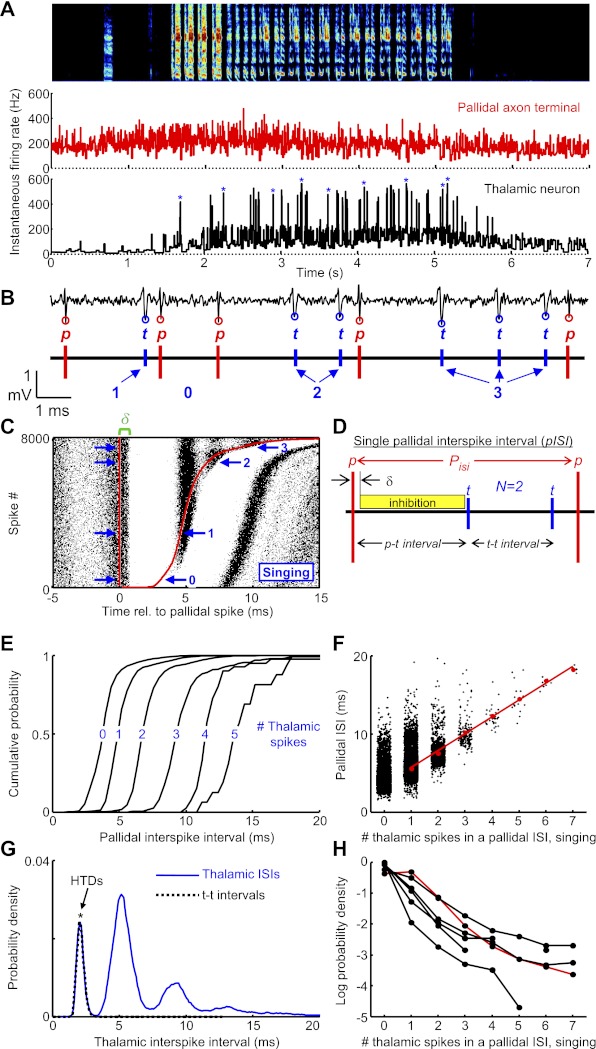
Simultaneous recordings of pallidal axon terminals and putative postsynaptic thalamic neurons during singing. A: instantaneous firing rates of a thalamic neuron (black) and its simultaneously recorded pallidal terminal (red) plotted during a bout of song [spectrogram shown at top, 65 days post hatch (dph)] (pair 1). Asterisks represent high tonic discharge events (HTDs). B: example of extracellular waveform containing signals from a thalamic neuron (t, blue circles) and its presynaptic pallidal axon terminal (p, red circles). C: raster plot of thalamic spikes (black ticks) aligned to the timing of pallidal spikes (red line). Red line at right shows the time of the next pallidal spike. The plot is sorted by the duration of the pallidal interspike interval (ISI) (n = 8,000 ISIs during singing). Note that each pallidal spike is followed by a brief period of absolute thalamic spike suppression, which begins after a brief latency (δ, green bracket). D: schematic of parameters within a single pallidal ISI (pISI). δ, The delay between a pallidal spike and the onset of thalamic spike suppression; p-t interval, the latency from the pallidal spike to the first thalamic spike that discharges in the pISI; t-t interval, the interval between successive thalamic spikes within the pISI; N, the number of thalamic spikes that discharge in the pISI. Note that thalamic spikes that occur immediately after a pallidal spike (<1.5 ms) are considered part of the previous pallidal interval. E: cumulative pallidal ISI duration probability distributions for ISIs containing 1 through 5 thalamic spikes within them. Data are from the pair shown above. F: scatterplot of individual pallidal ISI durations and the number of thalamic spikes within them (n = 22,170 spikes during singing). Red dots indicate the average pallidal ISI duration as a function of the number of thalamic spikes within it. Note that longer pallidal ISIs contain more thalamic spikes within them. G: blue, thalamic ISI duration distributions during singing (n = 15,821 ISIs, from the thalamic neuron shown above); black ticks, distribution of t-t intervals for the same neuron. H: log-probability of the number of thalamic spikes that discharge within single pallidal ISIs. Each trace is from a single pair during singing, and the red trace represents the pair from A.
Another key parameter in our analysis is the interval (p-t interval) between each pallidal spike and the first thalamic spike that occurs after the pallidal inhibition within that pallidal ISI. Because of the brief delay between pallidal spikes and the onset of spike inhibition, thalamic spikes occurring immediately after the pallidal spike (<1.5 ms) were considered to be part of the preceding pallidal ISI. The p-t interval associated with each pallidal ISI was computed as the time between the pallidal spike and the first thalamic spike assigned to that pallidal ISI.
ISIs between all thalamic spikes occurring within a single pallidal ISI were also computed (t-t intervals). We refer to multiple thalamic spikes occurring within a single pallidal ISI as “high tonic discharge” (HTD) events because these spikes occurred at a constant, high rate (Anderson and Turner 1991). The variability of t-t intervals within HTDs was computed follows: the standard deviation (SD) and coefficient of variation (CV) of t-t intervals were computed in every HTD containing three or more spikes. These values were averaged over all HTDs. This was compared to the SD and CV values of the distribution of all t-t intervals pooled from all HTDs containing three or more spikes. The statistical significance of these two analyses of variability in t-t intervals was assessed with a bootstrap analysis: a surrogate data set was generated in which each t-t interval within each HTD was assigned a value randomly drawn from the total, pooled t-t interval distribution. We conducted this analysis 1,000 times, and computed the P value as the percentage of times that the bootstrap analysis yielded an average SD less than that computed from the real data set.
To compare the measured distributions of p-t and t-t intervals (see Fig. 5, A–D) to that expected for unrelated spike trains, we created a surrogate thalamic spike train from the observed spike train by generating an artificial Poisson spike train with the same average firing rate as the spike train in the real data set. The distribution of p-t and t-t intervals was recomputed from the randomized spike trains (see Fig. 5, A–D) The same analysis was used to examine the dependence of thalamic spike count on pallidal ISI in the randomized spike trains (see Fig. 9, E and F).
Fig. 5.

Thalamic neurons discharge at high, fixed rates within pallidal ISIs. A and B: the distribution of p-t interval durations from a pair recorded during singing (A) and nonsinging (B) (solid lines, pair 4). Also plotted are the interval distributions computed after thalamic spike times were randomized (dotted lines; randomized p-t intervals smaller than δ were eliminated). C and D: distribution of t-t interval durations from the same pair during singing and nonsinging periods, plotted as in A and B. E: average t-t interval duration as a function of the interval number within the HTD (defined as multiple thalamic spikes that occur within a single pallidal ISI). F: the average firing rate within an HTD as a function of the number of spikes in the HTD. Data are means ± SE across 6 pairs during singing and nonsinging periods (solid and dotted lines, respectively).
Fig. 9.
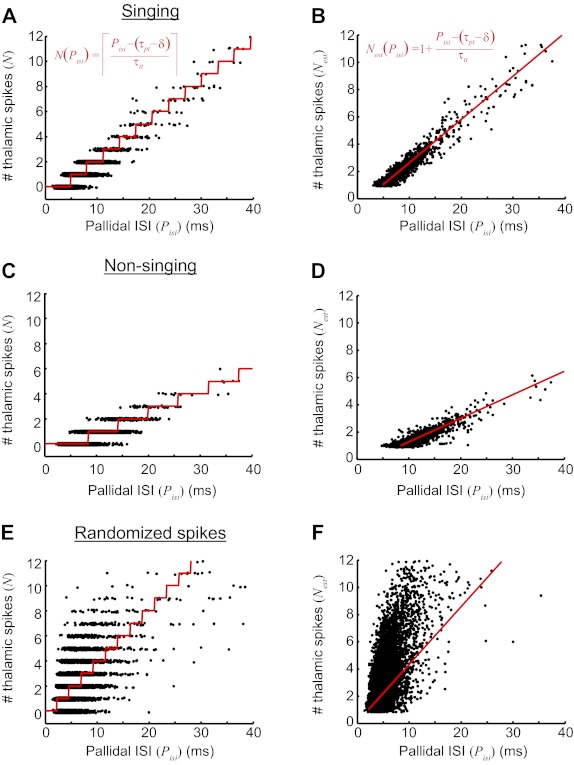
A simple threshold-linear model of pallidothalamic transmission. A: the number of thalamic spikes discharged within a pallidal ISI, plotted as a function the ISI duration. Data are from singing periods (pair 4). Red line indicates model fit (Eq. 1, inset). B: the number of thalamic spikes, plus the additional fraction estimated by Eq. 2 (see text), plotted as a function of pallidal ISI duration during singing. Red line indicates the model fit (Eq. 3, inset). C and D: results from the same pair during nonsinging periods (data presented as in A and B). E and F: results from the same pair, but with thalamic spike times randomly shuffled (data from singing periods).
Measures of history dependence.
Linear regression analyses of the dependence of thalamic discharge on past neural activity was performed in MATLAB, using the regstats function to compute slopes and r values. Each measure of thalamic activity (the mean number of thalamic spikes generated in a given pallidal ISI and the average p-t or t-t interval) was tested against the following independent variables: the duration of the current pallidal ISI, the duration of the previous pallidal ISI, the number of thalamic spikes generated in the previous pallidal interval, and the number of thalamic or pallidal spikes generated in the 50, 100, and 150 ms preceding the most recent pallidal spike.
For the analysis of dynamic changes in p-t and t-t intervals during singing (see Fig. 14), we computed running averages of p-t and t-t intervals in the periods of −1.5 s to 0.75 s relative to song bout onset (bin size = 50 ms, n = 6 pairs) or −0.2 to 0.2 s relative to syllable onset (bin size = 10 ms, n = 1 subsong pair). To determine the significance of decreases in p-t and t-t intervals prior to syllable onsets, we constructed 1,000 surrogate histograms in which the spike train for each syllable was randomly phase-shifted over a range of ±200 ms. P values for the minima of the real data set were calculated by analyzing the frequency with which randomized data sets generated smaller minima than those observed.
Fig. 14.
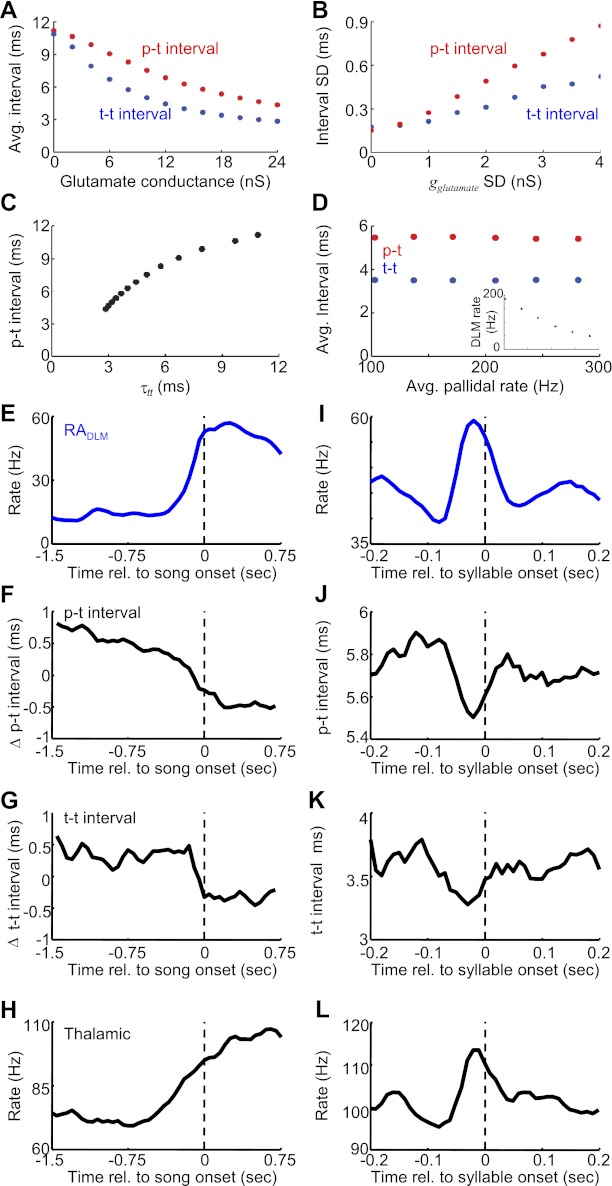
Dynamic and correlated changes in p-t and t-t intervals during singing. A: effect of model glutamatergic conductance on the average p-t and t-t intervals (from same simulations shown in Fig. 12). B: effect of gglutamate variability (standard deviation) on the standard deviation of the p-t and t-t interval distributions. C: average p-t interval vs. average t-t interval at different values of gglutamate. D: effect of pallidal firing rate on p-t and t-t intervals. Inset, effect of pallidal firing rate (same x-axis as main image) on model DLM firing rate. Pallidal firing rate was varied by uniformly scaling the ISIs in the pallidal spike train used in Figs. 11 and 12 (gglutamate = 17 ± 2 nS). E: song onset-aligned firing rates of 18 antidromically identified DLM-projecting RA neurons. F and G: song onset-aligned running averages of p-t and t-t interval durations. Shown are deviations from the overall mean values. H: average song bout onset-aligned firing rate of DLM neurons (n = 29 neurons). I: average syllable onset-aligned firing rates of RADLM neurons (n = 18 neurons recorded during subsong). J and K: syllable onset-aligned running averages of p-t and t-t interval durations for a pair recorded during subsong (pair 4). Data are mean across 225 syllables. Note the similarity in the time course of the rate increase in RADLM neurons and the decreases in p-t and t-t intervals. L: average syllable onset-aligned rate histogram for 14 DLM neurons recorded during subsong.
Simple model of dependence of thalamic spiking on pallidal ISI duration.
The number of thalamic spikes within a pallidal ISI was well predicted by the following relation:
| (1) |
where N(Pisi) is the number of thalamic spikes in the current pallidal ISI, Pisi is the duration of the current pallidal ISI, τpt is the average p-t interval, τtt is the average t-t interval, and δ is the delay between the pallidal spike and the onset of thalamic spike suppression (see Fig. 2D for schematic explanation of these variables). Finally, brackets indicate the ceiling operation, rounding up to the nearest integer (because fractions of spikes do not occur).
One source of variance in the measured thalamic spike counts is introduced by the fact that only an integer number of thalamic spikes can occur. Consider the case in which a pallidal ISI is just long enough that the model predicts three thalamic spikes. A slight decrease in thalamic excitability (for example) could cause the thalamic neuron to generate only two spikes, even though a third spike might have been generated if the pallidal ISI had been just a fraction of a millisecond longer. In this case, there would be a long trailing interval (Itr) between the last thalamic spike and the next pallidal spike, indicating that the thalamic neuron was about to generate a third spike. Indeed, Itr was strongly correlated with the residuals between the observed number of spikes (Nobs) and the number predicted by the model (r = −0.96 ± 0.01, linear regression to means, P < 0.001). We therefore used Itr to remove this highly predictable source of variance in the spike count residuals by computing an estimated fractional spike count, Nest, as follows:
| (2) |
To compute residuals with the estimated fractional spike count (Nest) we used a nondiscrete version of our model, obtained by removing the ceiling operator from Eq. 1 and adding 1:
| (3) |
Because the nondiscrete versions of the model and data eliminated a large known source of variability in the residuals, these were used to analyze the dependence of residuals on pallidal and thalamic spiking history.
DLM neuron biophysical model.
We developed a single-compartment model of the LMAN-projecting DLM neuron based on the “type I” DLM cell class originally described by Luo and Perkel (1999a). Excluding synaptic conductances, the model's current balance equation is given by
Iinj is an extrinsic applied current used to model current pulses injected through a recording pipette; in all other cases, it is set to zero. Calcium flux was treated as a normal ohmic current, since its primary functional contribution falls in the subthreshold voltage range where it is an approximately linear function of membrane potential. The equilibrium potentials for the ion species are ENa = +50 mV, EK = −100 mV, ECa = +100 mV, and EHCN = −40 mV; “HCN” denotes the hyperpolarization-activated, cyclic nucleotide-modulated mixed cation conductance common to amniote thalamic neurons. The capacitance C was 50 pF, selected to approximate the observed membrane time constant of ∼23 ms given the measured input resistance of ∼420 MΩ (Luo and Perkel 1999a). At 25°C, our model has an input resistance of 428 MΩ, giving it a membrane time constant of 21.4 ms, well within the ranges reported by Luo and Perkel (1999a).
Na+ conductance activation was treated as instantaneous, i.e., the value of the Na+ activation variable mNa was assumed to be at its steady-state value mNa∞(V):
where hNa is the Na+ inactivation gating variable and ḡNa is the maximal Na+ conductance. The K+ conductance consisted of a delayed rectifier (gKDR), three inactivating K+ conductances that are at least partially active at subthreshold potentials (gA, gD, gK2), and a K+ leak conductance (gK leak). The A, D, and K2 conductances represent the diverse collection of inactivating K+ conductances identified in thalamic neurons (Budde et al. 1992; Huguenard and Prince 1991; Kanyshkova et al. 2011) and provide outward rectification in response to depolarizing current pulses, as observed by Luo and Perkel (1999a). The total K+ conductance is
For each conductance X, mX is the activation variable, hX is the inactivation variable, and ḡX is the maximal conductance. The only Ca2+ conductance included in the model was the inactivating, low-voltage-activated T-type conductance that generates low-threshold Ca2+ spikes in thalamic neurons:
The HCN conductance is given by
All dynamical variables other than the membrane potential obeyed differential equations of the form
where x∞ is the steady-state value of gating variable x and τx is its equilibration time constant. The steady-state values were sigmoidal functions of voltage:
VH is the half-activation (or inactivation) voltage, and k is the slope factor. The values for these parameters—and the maximum values for each conductance—are given in Table 1. Most equilibration time constants were the product of two sigmoidal functions of voltage multiplied by a scale factor t2 plus a base time constant t1:
The values for these parameters are given in Table 2. However, the inactivation time constants for the A, D, and K2 conductances were voltage independent and were fixed at 16 ms, 80 ms, and 6,420 ms, respectively, at 25°C.
Table 1.
Model parameters for maximal conductances and steady-state values
| Conductance | ḡ, nS | VH, mV | k, mV |
|---|---|---|---|
| gNa (activation) | 5,000 | −24 | −7 |
| gNa (inactivation) | −60 | +6.7 | |
| gKDR | 500 | −12 | −7 |
| gA (activation) | 4 | −60 | −8.5 |
| gA (inactivation) | −78 | +6 | |
| gD (activation) | 4 | −50 | −15 |
| gD (inactivation) | −70 | +6 | |
| gK2 (activation) | 10 | −45 | −12 |
| gK2 (inactivation) | −60 | +10 | |
| gT (activation) | 30 | −55 | −5.5 |
| gT (inactivation) | −80 | +4 | |
| gHCN | 6.5 | −75 | +5.5 |
| gK leak | 1.1 | ||
| gNa leak | 0.4 |
ḡ, maximal conductance; VH, half-activation (or inactivation) voltage for steady-state activation (inactivation); k, slope factor specifying the steepness of the voltage dependence (see materials and methods).
Table 2.
Model parameters for gating kinetics
| Gating Variable | t1, ms | t2, ms | VH1, mV | k1, mV | VH2, mV | k2, mV |
|---|---|---|---|---|---|---|
| hNa | 1.87 | 52 | −120 | −5 | −60 | +12 |
| mKDR | 0.37 | 150 | +1.3 | −15 | −14.6 | +8.6 |
| mA | 0.24 | 4 | −70 | −8 | −50 | +8 |
| mD | 0.24 | 4 | −70 | −8 | −50 | +8 |
| mK2 | 0.4 | 96.3 | −70 | −20 | −40 | +8 |
| mHCN | 300 | 1,800 | −77 | −5 | −52 | +12 |
| mT | 0.48 | 16 | −90 | −7 | −60 | +13 |
| hT | 16 | 321 | −97 | −12 | −77 | +6 |
t1, t2, VH1, k1, VH2, and k2 are all parameters used in a function describing the voltage dependence of the equilibration time constant τx for several conductances (see materials and methods).
Although our model closely resembled DLM neurons in most respects, the spike afterhyperpolarization (AHP) was considerably deeper than the AHP of DLM neurons recorded in vitro. This was probably a consequence of using a single electrical compartment to represent the neuron: with spike-generating and subthreshold conductances necessarily located in the same place (rather than having spike-generating conductances more concentrated in the axon initial segment), a K+ delayed-rectifier conductance powerful enough to rapidly repolarize the action potential will also create a deep, albeit brief, AHP.
The model parameters given in Tables 1 and 2 are applicable at 25°C and were selected to make the model resemble type I DLM neurons recorded at room temperature (Luo and Perkel 1999a, 2002). To examine the model's response properties at higher temperatures, including the body temperature of zebra finches (41°C), it is necessary to appropriately scale the model's conductances and gating kinetics. Most conductances were scaled with a Q10 of 1.5 (Beam and Donaldson 1983; Schwarz 1986), an effect at least partially attributable to the temperature dependence of diffusion. However, the T-type Ca2+ conductance was scaled with a Q10 of 3, based on the observed temperature dependence of this conductance in mammalian thalamic neurons (Coulter et al. 1989), and the HCN conductance was scaled with a Q10 of 2.5, to reproduce the observed temperature dependence of DLM rebound burst latency reported by Person and Perkel (2005). Furthermore, the inactivating Na+ conductance (but not gNa leak) was adjusted with a Q10 of 2 to preserve spike amplitude at higher temperatures. Gating kinetics were scaled with a Q10 of 3, with the sole exception of gT activation, which was scaled with a Q10 of 5 (Coulter et al. 1989).
The GABAA conductance activated by area X projection neurons was represented by the product of rising and decaying exponentials; for an inhibitory postsynaptic potential (IPSP) initiated at t = 0,
To obtain a peak GABAA conductance of gpeak, the amplitude factor A was set to
At 25°C, the peak GABAA conductance for the X to DLM synapse was 12 nS and the decay time constant τdecay was 10 ms, based on the measurements of Luo and Perkel (2002); τrise was 0.7 ms. The reversal potential for the GABA conductance was −95 mV, in accordance with the extremely hyperpolarized GABAA reversal potential measured in DLM with the perforated-patch technique (Person and Perkel 2005). To model this synapse at higher temperatures, the peak conductance was scaled with a Q10 of 1.5. The time constants were adjusted with a Q10 of 2.1, corresponding to the measured temperature dependence of GABAA receptor kinetics in hippocampal neurons (Otis and Mody 1992). The amount of active GABAA conductance cannot continue to sum linearly at arbitrarily high presynaptic firing rates, but little is known about activity-dependent changes in release probability or postsynaptic receptor saturation and desensitization at this synapse. In the absence of specific information of this kind, we let gGABA saturate by scaling the dgGABA/dt expected from linear summation of inhibitory postsynaptic currents (IPSCs) by the factor
when gGABA > gpeak; this caused gGABA to saturate at ∼50% above gpeak at extremely high (∼1 kHz) presynaptic firing rates. However, given the GABAA decay time constant and the rates at which the synapse was activated in our simulations, this saturation mechanism was only weakly engaged.
To simulate the DLM model under conditions resembling the awake, singing state, we used a spike train recorded from a pallidal terminal during singing to determine the times when the GABAergic synapse was activated. We assumed that the IPSP was initiated at the time of the terminal spike; no synaptic delay was explicitly included. When simulating DLM activity under anesthetized conditions, we generated artificial pallidal spike trains with ISI statistics similar to those previously reported (Kojima and Doupe 2009; Leblois et al. 2009; Person and Perkel 2007). We did this by drawing ISIs from a nonstationary Gaussian distribution. The waveform for the time-varying firing rate was created by convolving Gaussian white noise with a Gaussian kernel 25 ms in standard deviation. This smoothed waveform was scaled and shifted to obtain a mean firing rate of 60 Hz with a standard deviation of 12 Hz. The reciprocal of this time-varying rate became the nonstationary mean of the Gaussian distribution from which ISIs were drawn; the standard deviation was 0.3 times the mean. The end result was a series of ISIs with an overall mean of ∼15.5 ms and CV of ∼0.36, exhibiting a small skew toward longer ISIs and a weak positive serial ISI correlation. In many simulations, a glutamatergic conductance was also included. This conductance could be constant or variable. If variable, its waveform was generated by convolving Gaussian white noise with a 2-ms-wide Gaussian kernel, which was scaled and shifted to obtain the desired mean and standard deviation. This conductance was independent of membrane potential (AMPA-like), and its reversal potential was 0 mV.
To compare spike times generated by the model to actual DLM spike times, we computed the correlation coefficient (CC) between the spike times, as follows:
where r̂(t) was the mean-subtracted spike train smoothed with a Gaussian kernel of 10 ms SD (Goldberg and Fee 2010; Kao et al. 2008; Olveczky et al. 2005). To determine the statistical significance of the correlation, we also compared the correlation distributions to those calculated after random, circular time shifts were added to the spike trains and considered as significant those correlations where the correlation distribution was significantly different from that of the randomly shuffled spike trains (P < 0.01, Kolmogorov-Smirnov test).
To investigate thalamic integration of time-varying excitatory inputs independent of pallidal rate changes (see Fig. 15), we simulated thalamic integration of “singing-modulated” cortical inputs and nonmodulated pallidal inputs. For the cortical inputs, a glutamatergic conductance averaging 22.0 nS (with a Gaussian noise of ± 2 nS) was modulated by simulated syllable onsets and offsets, which were instantiated as a Gaussian-shaped pulse of increased glutamate conductance centered 20 ms prior to syllable onsets, and a similarly shaped decrease in glutamate conductance centered 20 ms prior to syllable offsets (2.2 ± 1.1 nS peak conductance change, SD of Gaussian = 20 ms). Syllable onsets and offsets alternated, with intervals drawn from a 100-ms exponential distribution truncated below 40 ms (i.e., the minimum interval allowed between successive onsets and offsets was 40 ms). A “non”-singing condition was also simulated, where the glutamatergic conductance was an average 8.0 nS with a Gaussian noise of ± 2 nS. The pallidal spike train was constructed as random draws from the ISI distribution from an actual pallidal neuron recorded during singing (mean rate = 175 Hz). “Syllable” onset/offset-aligned histograms of thalamic firing rate were then computed. To compare the pallidothalamic interaction at onsets versus offsets, thalamic spikes were computed as a function of pallidal ISIs sampled from a 20-ms window centered 20 ms prior to onsets and offsets (the peak time of the associated glutamate conductance modulation).
Fig. 15.
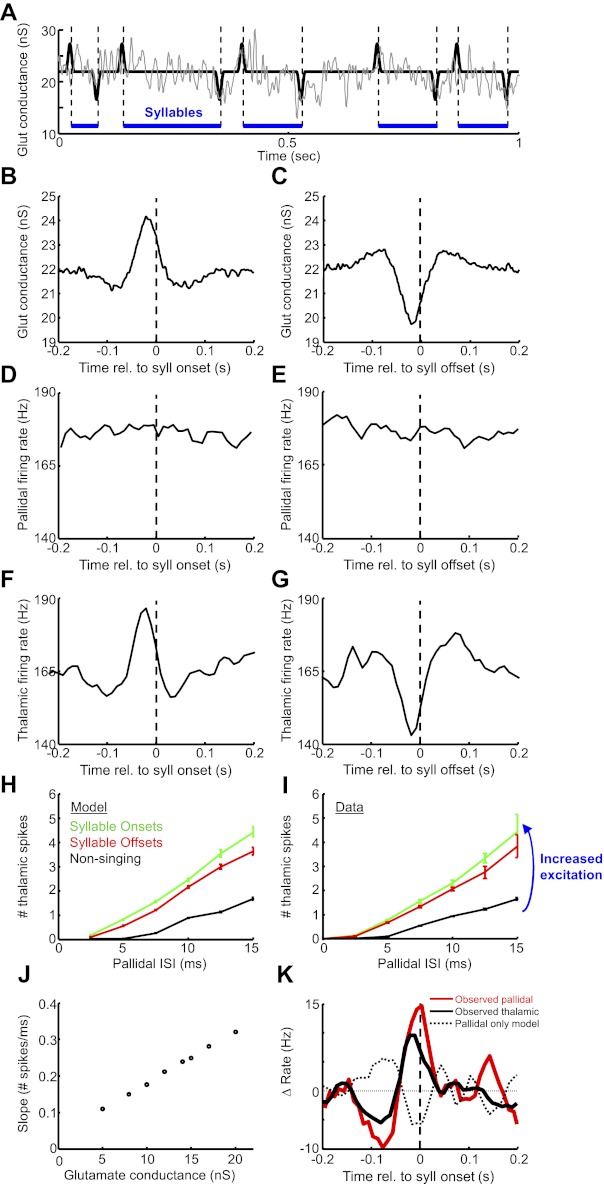
Simulation of song-locked thalamic rate modulations driven by glutamatergic input. A: the glutamatergic conductance used in simulations to activate the model DLM neuron had 3 characteristics: 1) a mean value of 22 nS, 2) syllable-modulated peaks and dips (based on measured spiking from Goldberg and Fee 2012; see materials and methods), and 3) ±2 nS of noise. A 1-s trace of the glutamate conductance is plotted without the noise to illustrate the syllable-locked modulations (black trace) and with the noise to illustrate what was used in the model (gray trace). Blue horizontal lines indicate syllables, and dashed vertical lines indicate syllable onsets and offsets. Pallidal spike inputs to the model were not song locked and were generated by randomly choosing pallidal ISIs from a measured distribution. B and C: syllable onset- and offset-aligned histograms of glutamate conductance. D and E: syllable onset- and offset-aligned histograms of pallidal firing rate. Note the lack of syllable-related modulation. F and G: syllable onset- and offset-aligned histograms of thalamic firing rate generated by the model neuron. Note that thalamic rate modulations are driven by the glutamate conductance, even in the absence of pallidal rate changes. H: the number of model thalamic spikes that discharged within a pallidal ISI, plotted against the duration of that ISI, for nonsinging periods (black) and the periods prior to syllable onsets (green) and offsets (red). Data are from the simulation shown in A–G. I: same analysis as H, plotted for a pallidothalamic pair recorded during singing in a subsong bird. Note that the slope is steeper at syllable onsets vs. syllable offsets and steeper during singing compared with nonsinging. J: the model simulation was run at different average glutamate conductances. Plotted is the slope of the linear regression fit of the relation between the number of DLM spikes and pallidal ISI duration (as in H) vs. different average glutamate conductances used in the model (see materials and methods). K: pallidal inputs alone do not explain observed thalamic firing patterns. Red trace, average syllable onset-aligned rate histogram for 6 pallidal neurons recorded during subsong. (Data shown are deviation from mean firing rate.) These spike trains were used to drive a model DLM neuron. Dashed black trace, average predicted thalamic response for the model neuron to the 6 pallidal spike trains (glutamate conductance was adjusted to set the average firing rate of the model thalamic neuron to 100 Hz for each pallidal spike train). Solid black trace, average syllable onset-aligned rate histogram for 14 DLM neurons recorded during subsong. Note that simulated thalamic response exhibited a rate decrease prior to syllable onsets, of opposite sign to the rate increase actually observed.
To investigate how the slope of the relation between model DLM spiking and pallidal ISIs depended on glutamate conductance (see Fig. 15J), we simulated the thalamic response to a recorded pallidal spike train (pair 4) at eight different average glutamate conductances between 5 and 20 nS, all with ±2-nS noise. No syllable onset or offset modulation was used for this analysis. For each glutamate conductance, the average number of thalamic spikes was plotted against pallidal ISI duration, and a linear regression was performed to compute the slope of this relation.
RESULTS
The pallidothalamic interaction during singing.
We used a motorized microdrive to record pallidal axon terminals and antidromically identified thalamocortical neurons in DLM of singing birds (see materials and methods). As reported previously (Goldberg et al. 2010), pallidal axon terminals fired at high rates in the awake bird and further increased their activity during singing (awake, nonsinging 140.7 ± 3.9 Hz vs. singing 287.4 ± 9.4 Hz). Despite these high pallidal firing rates, thalamic neurons discharged at high rates during non-singing periods, and further increased their firing rates during singing (awake, nonsinging 60.7 ± 5.6 Hz vs. singing 89.0 ± 5.1 Hz) (Goldberg and Fee 2012).
To examine precisely how thalamic spiking was affected by pallidal inputs, we recorded from putatively connected pallidal axon terminals and thalamic neurons at the end of the same electrode (Fig. 2, A and B; n = 8 pairs total, 7 pairs in awake juvenile birds, 4 of which were recorded during singing, and an additional 2 pairs in singing adults; see materials and methods). We generated rasters of thalamic spikes aligned to pallidal spikes and found that each pallidal spike was followed by a brief period of near-total suppression of thalamic activity (Fig. 2C). The latency between the pallidal spike and the onset of thalamic spike suppression (green bracket, Fig. 2C) was 650 ± 34 μs (n = 8 pairs, see materials and methods). By 1 ms after the pallidal spike, thalamic spike probability was suppressed by 99.9 ± 0.1% relative to the probability 1 ms before the pallidal spike. The period of spike suppression was brief, such that the average interval from a pallidal spike to the first postinhibition thalamic spike (p-t interval, Fig. 2D) was 5.1 ± 0.48 ms during singing (n = 6 pairs, range of p-t intervals across pairs: 3.5–7.9 ms).
Visual examination of the raw spike train revealed that, as a result of this inhibition, brief pallidal ISIs tended not to have thalamic spikes within them, whereas longer pallidal ISIs contained one or more thalamic spikes (Fig. 2B). In fact, the number of thalamic spikes within a single pallidal ISI was a strong linear predictor of the average pallidal ISI duration (Fig. 2, E and F; r = 0.99 ± 0.01, P < 0.0001 for all 6 pairs during singing). On average, each additional thalamic spike was associated with a 3.7 ± 0.1-ms increase in the average pallidal ISI duration during singing (slope range: 1.9–7.3 ms/spike). When two or more thalamic spikes discharged in a given pallidal ISI, these spikes discharged at a high, tonic rate corresponding to the highest firing rates produced by the thalamic neurons. These “high tonic discharge” (HTD) events were readily observable in the thalamic instantaneous firing rate trace (asterisks, Fig. 2A) and were associated with a distinct peak at short intervals in the thalamic ISI distribution (Fig. 2G). We refer to the ISIs between thalamic spikes within a single pallidal ISI as the t-t interval (Fig. 2D). [Thalamic spikes that occurred immediately after a pallidal spike but before the onset of pallidal inhibition (Fig. 2C, green bracket) were considered to be part of the previous pallidal ISI; see materials and methods.] Across pairs, pallidal ISIs with one or more spikes were observed with a probability that decreased roughly exponentially with the number of spikes (Fig. 2H).
Dynamics of pallidothalamic transmission depend on the behavioral state of the bird.
In awake, nonsinging birds, the basic structure of the pallidothalamic interaction was similar to that observed during singing. Each pallidal spike was followed by a brief period of thalamic spike suppression (Fig. 3, A–C), and many pallidal ISIs contained multiple thalamic spikes (Fig. 3D). In addition, as during singing, the number of thalamic spikes within a pallidal ISI was a strong linear predictor of the average duration of that ISI (r = 0.98 ± 0.02, P < 0.0001, n = 8 pairs). However, the timescales of the interaction were different during nonsinging. On average, each additional thalamic spike during nonsinging was associated with a 5.4 ± 0.9-ms increase in the average pallidal ISI (compared to singing 3.7 ± 0.1 ms, P < 0.01 paired t-test, n = 6). In addition, the average p-t interval was substantially longer (Fig. 3E) (8.0 ± 1.1 ms, significantly different from singing, P < 0.01, paired t-test, n = 6), and the thalamic firing rates within HTDs were significantly lower during nonsinging, corresponding to a longer average t-t interval (Fig. 3F, average t-t interval: 3.4 ± 0.8 ms during singing vs. 5.5 ± 0.7 ms nonsinging, P < 0.01, paired t-test, n = 6). Thus, during singing, thalamic neurons began to spike sooner after pallidal inhibition and subsequently fired at a higher rate compared with the awake nonsinging state.
Fig. 3.
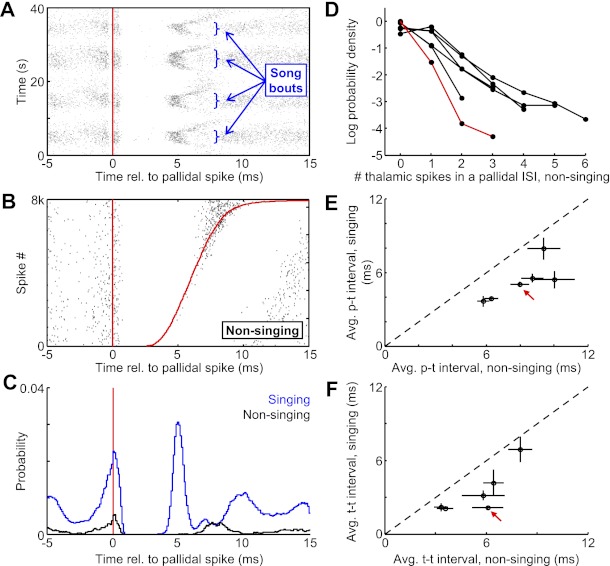
Dynamics of pallidothalamic transmission depend on the behavioral state of the bird. A: raster plot of thalamic spikes (black ticks) aligned to the timing of pallidal spikes (red line) for the pair shown in Fig. 2 (pair 1). Data are from 40 consecutive seconds of recording, containing 4 bouts of singing. Note that the duration of thalamic spike suppression is shorter during song bouts. B: raster plot, as in Fig. 2C. Red line at right shows the time of the next pallidal spike. The plot is sorted by the duration of the pallidal ISI (n = 8,000 ISIs during nonsinging). C: histograms of thalamic spike probability aligned to the timing of pallidal spikes during singing (blue) and nonsinging (black). D: log-probability of the number of thalamic spikes that discharge within single pallidal ISIs. Each trace is from a single pair during singing, and the red trace represents data from the pair at left and from Fig. 2. E and F: the average p-t interval (E) and t-t interval (F) computed during singing plotted against the value computed during nonsinging. Red arrows point to the points corresponding to the pair in A–C. Error bars are SD.
Thalamic spikes are entrained to pallidal inputs at high frequencies.
We hypothesized that the powerful yet brief suppression of thalamic activity by pallidal inputs, coupled with the fairly regular (periodic) spiking patterns of the pallidal inputs, might entrain the thalamic spikes and introduce significant structure into the temporal statistics of thalamic spike trains. We examined the ISI distributions of DLM neurons and, in the case of paired recordings, related these to the distributions of pallidal ISIs (Fig. 4A). As previously described, pallidal inputs to DLM exhibited a unimodal and relatively narrow distribution of ISIs, both during anesthesia (Kojima and Doupe 2009; Person and Perkel 2007) and in awake singing and nonsinging birds (Goldberg et al. 2010). In awake birds, pallidal spike intervals were particularly narrowly distributed in the nonsinging state (CV = 0.48 ± 0.02 singing vs. 0.32 ± 0.01 nonsinging).
Fig. 4.
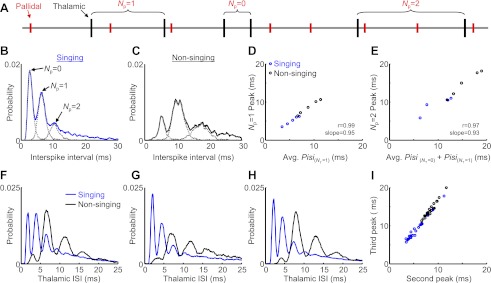
Thalamic ISI duration distributions reveal entrainment to single pallidal inputs. A: schematic of a simultaneously recorded pallidal thalamic spike train (pair 4). Note that thalamic ISIs can be labeled by the number of pallidal spikes that fall between them (Np). B: ISI distributions of a thalamic neuron recorded with its pallidal input during singing. Note the multiple peaks in the thalamic distribution. The first 3 peaks correspond to t-t intervals containing 0, 1, or 2 pallidal spikes between them (these separate distributions are plotted with gray dashed lines). C: ISI distribution for the same pair recorded during nonsinging periods. D: the timing of the 2nd peak, corresponding to t-t intervals containing 1 pallidal spike, is plotted against the average duration of pallidal ISIs containing 1 thalamic spike (NT = 1). E: the timing of the 3rd peak, corresponding to t-t intervals containing 2 pallidal spikes within them, is plotted against the sum of the average durations of pallidal ISIs containing 0 thalamic spikes and those containing 1 thalamic spike. F–H: ISI distributions during singing and nonsinging periods of 3 additional thalamic neurons. I: the timing of the 3rd peak is plotted against the timing of the 2nd peak for all thalamic neurons recorded long enough to resolve ISI distributions (n = 26 neurons).
In contrast, thalamic ISI distributions were more widely distributed and showed several pronounced peaks (Fig. 4, B and C). The first peak (shortest intervals) corresponded to intervals between thalamic spikes generated within single pallidal ISIs (t-t intervals, as in Fig. 2G). The second peak corresponded largely to pairs of thalamic spikes that occurred in consecutive pallidal ISIs. Indeed, when we computed the distribution of ISIs between thalamic spikes separated by one pallidal spike, this overlapped the second peak in the overall thalamic ISI distribution extremely well (NP = 1, Fig. 4, B and C). The average duration of thalamic ISIs that contained one intervening pallidal spike was highly correlated with the location of the second peak in the overall thalamic ISI distribution (Fig. 4D; r = 0.99, slope = 0.95, P < 0.001). Similarly, the timing of the third peak was explained by thalamic ISIs containing two intervening pallidal spikes (Fig. 4E; r = 0.97, slope = 0.93, P < 0.001), suggesting that the third peak was caused by thalamic spikes separated by two periods of pallidal inhibition. Notably, multipeaked ISI distributions were also observed in cerebellar nuclear neurons that were similarly entrained to periodic inputs from Purkinje neurons (cf. Fig. 4, Person and Raman 2012). Together, these results are consistent with the idea that thalamic neurons receive strong periodic inhibition from only a single regular spiking pallidal neuron, and tend to spike at roughly integer multiples of pallidal ISIs.
We wondered whether all thalamic neurons, even those not recorded simultaneously with a putative presynaptic pallidal input, also exhibited such structured ISI distributions. In thalamic ISI distributions obtained in paired recordings, the locations of the second and third peaks were strongly correlated (r = 0.99, slope = 1.64, P < 0.001). Similarly, all other neurons recorded long enough to construct a high-resolution ISI distribution (n = 24 neurons, >2,000 ISIs) exhibited these characteristic peaks (see Fig. 4, F–H for 3 more examples). In each of these neurons, the locations of the second and third peaks in the ISI duration distribution were strongly correlated during singing (r = 0.99, slope = 1.53, P < 0.001) and nonsinging (r = 0.98, slope = 1.69, P < 0.001) periods (Fig. 4I). These findings suggest that all DLM neurons recorded were strongly entrained to a single underlying periodic signal similar to that produced by the pallidal inputs observed in the paired recordings.
p-t intervals and t-t intervals are narrowly distributed.
Pallidal inhibition did not simply suppress thalamic spiking, i.e., delete spikes for a period of time; rather, inhibition was reliably followed by a precisely timed thalamic spike. p-t intervals were narrowly distributed both during nonsinging periods (SD = 1.5 ± 0.2 ms, CV = 0.18 ± 0.02) and even more so during singing (SD = 0.82 ± 0.2 ms, SD range across pairs: 0.38–1.8 ms, P < 0.01 compared with nonsinging, CV = 0.16 ± 0.03). In both conditions, p-t intervals were significantly more narrowly distributed than was found for unrelated spike trains (Fig. 5, A and B; P < 0.001 compared with randomized DLM spike trains; see materials and methods). These data show that the duration of pallidal suppression of thalamic spiking was relatively fixed, and that the first thalamic spike that followed a pallidal spike was entrained to it with submillisecond precision.
The t-t intervals were also narrowly distributed, especially during singing (SD of t-t intervals 1.20 ± 0.15 ms during nonsinging, 0.74 ± 0.17 ms during singing), corresponding to a small CV of ISIs (CV = 0.19 ± 0.07, n = 6 pairs during singing). In both cases, the distributions of t-t intervals were significantly narrower than was found for randomized thalamic spike trains (Fig. 5, C and D; P < 0.001; see materials and methods). Notably, t-t intervals within individual pallidal ISIs were significantly more narrowly distributed than they were across different pallidal ISIs [within-interval SD during singing = 0.46 ± 0.14 ms (CV = 0.14 ± 0.04), P < 0.05 compared with SD of t-t intervals measured across pallidal ISIs = 0.74 ± 0.17 ms (CV = 0.22 ± 0.05); see materials and methods]. The duration of t-t intervals within an HTD did not depend on which interval number it was within the HTD, i.e., whether it was measured between the first and second spike or the second and third spike (Fig. 5E; P > 0.4 linear regression to means, n = 6 pairs). Furthermore, the mean rate of an HTD event did not depend on the number of spikes within it (Fig. 5F; P > 0.2 linear regression to means, n = 6 pairs; see materials and methods). Thus, while average rates of HTDs at different times in the song (i.e., across pallidal ISIs) could exhibit moderate variability (asterisks, Fig. 2A), the thalamic firing rate within HTDs did not exhibit any systematic variations within a single pallidal ISI. The same observations applied to the nonsinging state (Fig. 5, E and F; P > 0.3 linear regression to means).
This fixed duration of thalamic ISIs within pallidal ISIs suggests that once the thalamic neuron begins to spike after pallidal inhibition it fires at a fixed rate, on average, until its spiking is terminated by another pallidal spike. This is an important feature of the thalamic firing that will play a central role in our model of the pallidothalamic interaction.
Relation between p-t and t-t intervals during singing.
We hypothesize that the speed with which thalamic neurons begin to spike after pallidal inhibition (inverse of the p-t interval) and the peak firing rate of thalamic neurons between episodes of pallidal inhibition (inverse of t-t interval) might both be controlled by a common process, such as the excitability of the thalamic neuron. Consistent with this possibility, we found that for all recorded pairs variations in p-t and t-t intervals across different pallidal intervals were significantly correlated with each other during both singing (r = 0.33 ± 0.09, P < 0.01 in 6/6 pairs) and nonsinging (r = 0.51 ± 0.10, P < 0.01 in 8/8 pairs) (Fig. 6, A and B). Thus pallidal intervals in which the thalamic neuron spiked sooner after the pallidal spike were likely to contain a higher subsequent HTD firing rate. Further support of the idea that a common mechanism underlies variations in p-t intervals and t-t intervals comes from the strong correlation of the average values of these parameters across pairs (Fig. 6C; singing: r = 0.93, P < 0.01, n = 6 pairs; nonsinging: r = 0.90, P < 0.01, n = 8 pairs). Thus thalamic neurons that spiked sooner after pallidal inhibition also exhibited higher average discharge rates within pallidal ISIs.
Fig. 6.
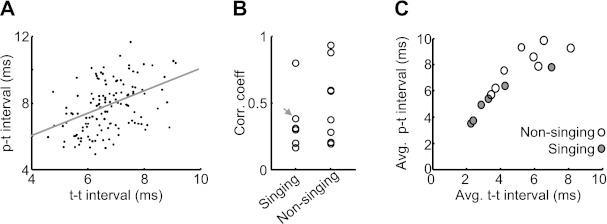
p-t and t-t intervals are correlated with one another. A: the p-t interval measured within each pallidal ISI plotted against the average t-t interval measured within the same ISI (plotted only for pallidal ISIs containing ≥2 spikes, pair 4). B: the coefficient of correlation between the average p-t and t-t intervals measured in the same pallidal ISI for all pairs recorded during singing (n = 6) and nonsinging (n = 8). Arrow points to the pair shown in A. C: the average p-t intervals are plotted against the average t-t intervals computed in the same pair. Data are from singing (shaded circles, n = 6 pairs) and nonsinging (open circles, n = 8 pairs) periods.
Dependence of p-t and t-t intervals on the history of thalamic and pallidal activity.
Different mechanisms of thalamic activation are likely to exhibit a different dependence on the history of pallidal or thalamic activity (Kojima and Doupe 2009; Pare et al. 1990; Person and Perkel 2007). For example, rebound bursting must be preceded by a prior period of hyperpolarization that deinactivates low-threshold calcium channels (Person and Perkel 2005). We found that in most pairs p-t and t-t intervals showed only weak or nonsignificant correlation with the number of thalamic spikes in the preceding pallidal ISI (Fig. 7, A and B; average r = 0.0017 and 0.027 for p-t and t-t, respectively; Tables 3 and 4) or with the number of thalamic spikes in the preceding 50 ms (Fig. 7, C and D; average r = −0.057 and −0.15 for p-t and t-t, respectively; similar results for 100-ms or 150-ms windows, Tables 3 and 4). In one pair, the t-t interval exhibited a strong negative correlation with past thalamic activity (pair 1, Table 4). Thus, contrary to what would be expected for a rebound mode of thalamic spike generation, for this pair increased recent thalamic activity was associated with shorter subsequent p-t and t-t intervals.
Fig. 7.
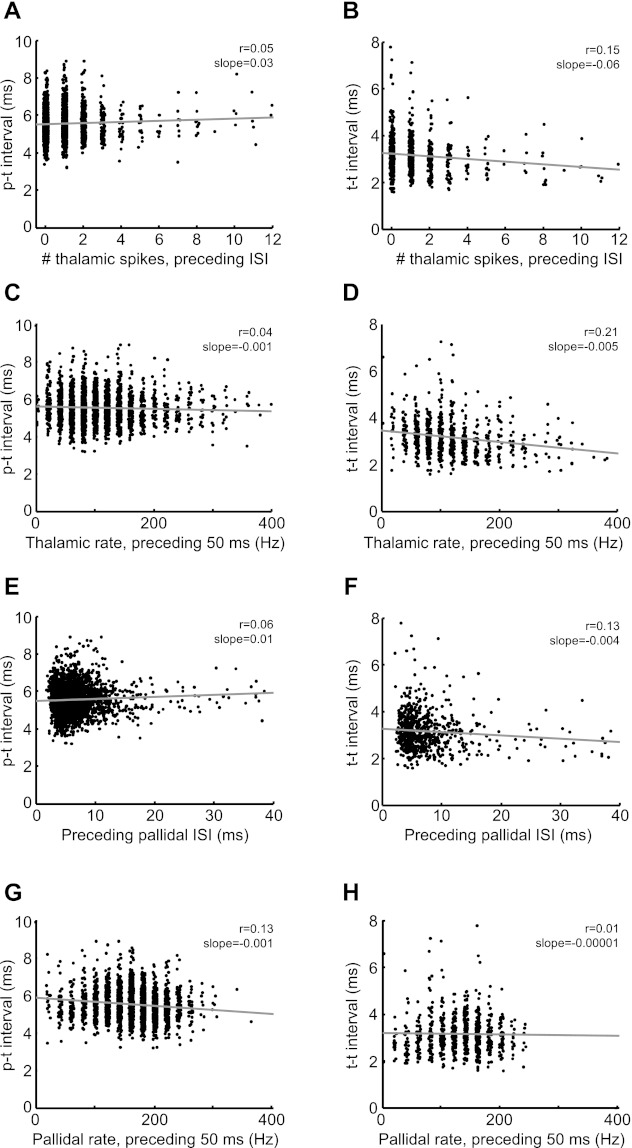
Dependence of p-t and t-t intervals on preceding neural activity. p-t intervals (left) and t-t intervals (right), measured within a pallidal ISI, are plotted against several measures of pallidal activity preceding that ISI: the number of thalamic spikes in the preceding pallidal ISI (A and B), the average thalamic firing rate in the 50 ms preceding the ISI (C and D), the duration of the preceding pallidal ISI (E and F), and the average pallidal firing rate in the 50 ms preceding the ISI (G and H). Data are from singing periods (pair 4, see Tables 3–5).
Table 3.
Analysis of p-t intervals
| Pair | p-ISI | P50 | P100 | P150 | pre#DLM | T50 | T100 | T150 | t-t | pre p-t |
|---|---|---|---|---|---|---|---|---|---|---|
| 1 | 0.04 | n.s. | n.s. | n.s. | 0.05 | −0.26 | −0.31 | −0.33 | 0.31 | 0.24 |
| 2 | n.s. | −0.24 | −0.21 | −0.23 | 0.08 | 0.08 | n.s. | 0.07 | 0.25 | 0.23 |
| 3 | n.s. | n.s. | n.s. | n.s. | n.s. | n.s. | n.s. | n.s. | 0.13 | 0.45 |
| 4 | 0.06 | −0.13 | −0.11 | −0.12 | 0.06 | n.s. | n.s. | n.s. | 0.17 | 0.25 |
| 5 | −0.27 | n.s. | n.s. | n.s. | n.s. | n.s. | n.s. | n.s. | 0.73 | n.s. |
| 6 | n.s. | n.s. | n.s. | n.s. | n.s. | −0.12 | n.s. | n.s. | 0.38 | n.s. |
Values are correlation coefficients between p-t intervals and measures of the duration of the preceding interspike interval (p-ISI), the mean pallidal rate in the preceding 50 (P50), 100 (P100), and 150 (P150) ms, the number of thalamic spikes in the preceding pallidal ISI (pre#DLM), the mean thalamic rate in the preceding 50 (T50), 100 (T100), and 150 (T150) ms, the t-t interval measured in the same pallidal ISI (t-t), and the p-t interval measured in the preceding pallidal ISI (pre p-t). Correlations and P values were computed with the corrcoef function in MATLAB. P < 0.005 was considered significant. n.s., Not significant.
Table 4.
Analysis of t-t intervals
| Pair | p-ISI | P50 | P100 | P150 | pre#DLM | T50 | T100 | T150 | p-t | pre p-t |
|---|---|---|---|---|---|---|---|---|---|---|
| 1 | n.s. | n.s. | n.s. | n.s. | n.s. | −0.49 | −0.5 | −0.44 | 0.31 | 0.18 |
| 2 | −0.19 | n.s. | n.s. | n.s. | n.s. | −0.24 | n.s. | n.s. | 0.25 | 0.19 |
| 3 | n.s. | n.s. | n.s. | n.s. | n.s. | n.s. | n.s. | n.s. | 0.13 | n.s. |
| 4 | −0.11 | n.s. | n.s. | n.s. | n.s. | −0.21 | −0.16 | −0.11 | 0.17 | 0.19 |
| 5 | n.s. | n.s. | n.s. | n.s. | n.s. | n.s. | n.s. | n.s. | 0.73 | n.s. |
| 6 | n.s. | n.s. | n.s. | n.s. | n.s. | n.s. | n.s. | n.s. | 0.38 | 0.51 |
Values are correlation coefficients between t-t intervals and measures of the duration of the preceding ISI (p-ISI), the mean pallidal rate in the preceding 50 (P50), 100 (P100), and 150 (P150) ms, the number of thalamic spikes in the preceding pallidal ISI (pre#DLM), the mean thalamic rate in the preceding 50 (T50), 100 (T100), and 150 (T150) ms, the p-t interval measured in the same pallidal ISI (p-t), and the p-t interval measured in the preceding pallidal ISI (pre p-t). Correlations and P values were computed with the corrcoef function in MATLAB. P < 0.005 was considered significant.
We next wondered whether p-t and t-t intervals exhibited any dependence on recent pallidal activity. For example, in anesthetized birds, rebound thalamic spiking was preceded by a brief period of increased pallidal firing rate (Kojima and Doupe 2009; Person and Perkel 2007), and in brain slices longer periods of sustained pallidal firing resulted in shorter p-t latencies (Person and Perkel 2005). However, pairs recorded during singing exhibited no correlation of either p-t or t-t intervals with the duration of the preceding pallidal ISI (average correlation across pairs: r = −0.018 and −0.045 for p-t and t-t, respectively, Tables 3 and 4). A similar weak overall correlation was observed between p-t and t-t intervals and the number of pallidal spikes in the preceding 50 ms (average r = −0.06 and 0.00 for p-t and t-t, respectively). In two pairs, there was a significant negative correlation between the p-t interval and the number of pallidal spikes in the 50 ms preceding the current pallidal ISI (pair 2, r = −0.21 and pair 4, r = −0.13). The sign of this correlation is consistent with that observed during rebound spiking (Person and Perkel 2005). However, in these pairs the slope of this dependence was extremely low: each additional pallidal spike in the preceding 50 ms was associated with a 0.04-ms reduction in the average p-t interval. This slope was a factor of ∼75 smaller than previously reported in the same time window during rebound spiking in brain slice (cf. Fig. 4, Person and Perkel 2007). We also found in these pairs that the p-t interval was significantly correlated with the number of pallidal spikes in the 50 ms following the current pallidal ISI (pair 2, r = −0.14 and pair 5, r = −0.08), calling into question the causality of this weak relationship.
A further test of the history dependence can be carried out by comparing the duration of pallidal ISIs that are followed by a thalamic spike (in the next interval) with those that are not. Previous studies of pallidothalamic paired recordings in anesthetized birds have reported that pallidal intervals containing thalamic spikes were preceded by shorter-than-average pallidal ISIs, and interpreted this as evidence for a rebound mode of spike generation (cf. Fig. 2, Kojima and Doupe 2009). Specifically, Kojima and Doupe (2009) computed the average duration of pallidal ISIs in the 50 ms preceding each pallidal spike (preISI). They then compared preISIs associated with pallidal intervals containing thalamic spikes to those that did not. We have carried out the same analysis on data from the awake singing and nonsinging bird (see materials and methods). In contrast to what was previously observed in anesthetized birds, we found that pallidal ISIs containing thalamic spikes were preceded by slightly longer-than-average preISIs (Fig. 8; preISI with spike: 6.4 ± 0.8 ms, without spike: 5.9 ± 0.8 ms, P < 0.05 Mann-Whitney test, n = 6/6 pairs singing, n = 8/8 pairs nonsinging). This was likely due to the fact that thalamic spikes occurred in longer-than-average pallidal ISIs (Fig. 2E, Fig. 8A), and because long pallidal ISIs had a weak tendency to be followed by another long ISI, i.e., pallidal spike trains had weak serial ISI correlations (r = 0.22 ± 0.04, n = 6 pallidal spike trains from pairs during singing) (Goldberg et al. 2010). Together with the observations that neither p-t nor t-t intervals were strongly dependent on the history of pallidal spiking, these findings suggest that, in awake birds, pallidal activity preceding the most recent pallidal spike does not significantly contribute to thalamic responsiveness.
Fig. 8.
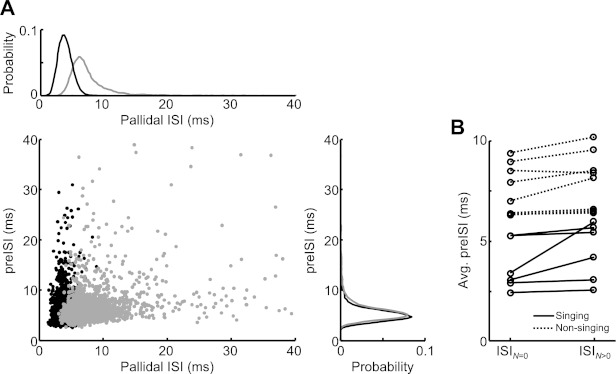
Thalamic spikes during singing are not associated with shorter preceding pallidal intervals. Previous studies have found that, in anesthetized birds, pallidal intervals containing thalamic spikes were associated with shorter preceding pallidal ISIs (preISIs), and this was interpreted as evidence for a rebound mode of spike generation (cf. Fig. 2, Kojima and Doupe 2009). Here, data from pairs recorded during singing are plotted the same way. A: pallidal ISIs plotted against preISIs, separated into ISIs containing DLM spikes (gray) and those containing no DLM spikes (black) (pair 4; see materials and methods). Probability distributions of the gray and black dots projected along the axes are shown at top and right (bin size 1 ms). B: average preISIs preceding ISIs containing no DLM spikes (ISIN=0) and ≥1 spikes (ISIN>0). In sum, in awake singing and nonsinging birds, thalamic spikes were associated with longer preceding pallidal ISIs, which is not consistent with a rebound mode of thalamic spiking.
A simple model of pallidothalamic transmission within single pallidal ISIs.
Given this lack of dependence on the history of pallidal activity, our data suggest a simple conceptual model of thalamic spiking that depends on the duration of single pallidal ISIs. We have shown that in both singing and nonsinging states each pallidal spike is followed by a period of profound thalamic spike suppression. We imagine that the latency with which the next thalamic spike occurs is set by a parameter τpt. We envision τpt as being relatively constant with a value close to the average p-t interval of the neuron, but also exhibiting some temporal variations related, perhaps, to the excitability of the thalamic neuron or the singing or nonsinging state of the bird. After a latency of τpt, the thalamic neuron generates a spike and then continues to fire at a constant ISI set by another parameter, τtt, until the thalamic spiking is terminated by the next pulse of pallidal inhibition. Like τpt, we envision τtt as being relatively constant with a value close to the average t-t interval of the neuron, but also exhibiting temporal variations related to neuronal excitability or behavioral state.
We can now formulate, based on this description of thalamic spiking, a simple mathematical model of the number of spikes produced by a thalamic neuron within any single pallidal ISI. The basic approach will be to calculate how many t-t intervals can fit in the noninhibited period between two sequential pulses of pallidal inhibition. After the first pallidal spike, the pallidal inhibition ends (allowing the thalamic neuron to spike) after a delay of τpt. The next inhibitory pulse begins after a delay of δ (∼0.65 ms, see Fig. 2C) following the next pallidal spike. Thus the interval between the pulses of inhibition, during which a thalamic neuron can spike, is given by Pisi − τpt + δ, where Pisi is the pallidal ISI. Thus the total number of thalamic spikes, N, that discharge within a given pallidal ISI is simply 1 more than the number of whole t-t intervals that will fit in the period between inhibitory pulses. This can be expressed compactly as (Eq. 1):
where the brackets indicate the ceiling operation (rounding up to the nearest integer because fractions of spikes do not occur), restricted to be a nonnegative integer. Note that here, as with the analysis of pair spike data, any thalamic spike that occurred immediately after a pallidal spike, within a latency of 1.5 ms, was assigned to the previous pallidal interval (see materials and methods).
This model exhibits two essential characteristics: 1) a threshold duration of the pallidal ISI of Pisi = τpt − δ, below which thalamic neurons cannot spike, and 2) above this threshold, a linear relation between the number of thalamic spikes and the duration of the current pallidal ISI, Pisi. Thus the number of thalamic spikes that occur within a pallidal ISI has a threshold-linear dependence on the duration of the pallidal ISI, where τpt sets the threshold for thalamic spike generation and τtt determines slope of the linear relation.
To determine how well this model fits our data, we compared the number of thalamic spikes, N, predicted by Eq. 1 with the number of thalamic spikes actually observed, as a function of the duration of pallidal ISIs (Fig. 9A). To start, we set the parameters τpt and τtt as the average p-t and t-t interval, respectively, measured during singing. The observed spike counts were well predicted by the model (r = 0.762 ± 0.041, n = 6 pairs). Nevertheless, there were some differences between the observed and predicted number of spikes (referred to here as residuals). For example, for the pair shown in Fig. 9A, Eq. 1 predicted that 1 thalamic spike would occur within pallidal ISIs of 5- to 8-ms duration, whereas 0, 1, or 2 spikes were actually observed with a probability of 0.04, 0.84, and 0.12, respectively. The average RMS of residuals during singing was 0.46 ± 0.08 spikes (n = 6 pairs).
One obvious source of difference between the observed and predicted number of spikes arises from the fact that only integer numbers of thalamic spikes can occur. For example, on one pallidal interval, the noninhibited period described above may be just long enough for the thalamic neuron to generate two t-t intervals (i.e., 3 thalamic spikes). Because of slight variations in excitability, for example, the thalamic neuron might sometimes generate 2 spikes and sometimes 3 spikes. However, when the thalamic neuron generates only 2 spikes, there will be a long “trailing” interval (Itr) between the last thalamic spike and the next pallidal spike; when the neuron generates 3 spikes, this interval will be very short. Consistent with this view, we found the duration of the trailing interval Itr was strongly correlated with the residuals between the observed number of spikes and the number predicted by the model (r = −0.96 ± 0.01, linear regression to means, P < 0.001). To correct for this highly predictable source of residuals, for each pallidal interval we used Itr and τtt to calculate the additional fraction of t-t intervals that fit between the last thalamic spike and the onset of the next pallidal inhibition (expressed as spikes, see materials and methods). The resulting estimated fractional spike counts were compared to a linearized version of our model that allows for fractions of spikes to occur (Fig. 9B, see materials and methods). This approach revealed a very strong fit of the data to the model (r = 0.94 ± 0.02, P < 0.01 compared with nonlinearized model). Residuals trended smaller between the fractional spike counts and the linearized model (RMS = 0.41 ± 0.05 spikes, n = 6 pairs).
We wondered whether the same model could describe thalamic spike counts in awake, nonsinging birds. During nonsinging periods, the average duration of p-t and t-t intervals was significantly longer than during singing, resulting in fewer thalamic spikes for a given pallidal interval duration (Fig. 3, E and F). Nevertheless, when the parameters τpt and τtt were set to the average p-t and t-t intervals during nonsinging, the relation of thalamic spike count as a function of pallidal ISI duration was well predicted by Eq. 1 (Fig. 9C; r = 0.63 ± 0.09, n = 8 pairs) and was very well described by its linearized version (Fig. 9D; r = 0.82 ± 0.04), suggesting that this model can describe thalamic spiking in both singing and nonsinging behavioral states.
Of course, the number of spikes that occur in an interval would be expected to be proportional to the duration of that interval, even for pairs of neurons that are completely unrelated. To examine how well our model predicts the spike counts in unrelated spike trains, we randomized thalamic spike times in the pallidothalamic pairs recorded during singing (see materials and methods). Not surprisingly, the number of thalamic spikes within pallidal ISIs was significantly correlated with the duration of the ISI (Fig. 9, E and F). However, the strength of the correlation was much weaker than observed in the real data set (randomized: r = 0.27 ± 0.06 vs. real: r = 0.764 ± 0.042, P < 0.001, paired t-test, n = 6 pairs), suggesting that it is the particular nature of the pallidothalamic interaction—and the resulting narrow distribution of p-t and t-t intervals—that makes thalamic spike counts within pallidal ISIs so predictable.
To determine whether past pallidal or thalamic activity could explain variance in thalamic spike number not already explained by the current pallidal ISI (Pisi), τpt, and τtt, we examined the relationship between the residuals from our linearized model and measures of past pallidal and thalamic activity during singing (see materials and methods). For no recorded pairs did residuals show a correlation with the duration of the preceding pallidal ISI or the number of DLM spikes within the preceding pallidal interval. Some pairs showed weak negative correlation with other measures of past pallidal activity (pairs 2 and 4, Table 5) or a weak positive correlation with other measures of past thalamic activity (pairs 1, 4, and 6, Table 5). However, all of these correlations had the opposite sign of what would be expected for a rebound spiking mechanism (Kojima and Doupe 2009; Person and Perkel 2005, 2007).
Table 5.
Analysis of Eq. 3 residuals
| Pair | p-ISI | P50 | P100 | P150 | pre#DLM | T50 | T100 | T150 | p-t | t-t |
|---|---|---|---|---|---|---|---|---|---|---|
| 1 | n.s. | n.s. | n.s. | n.s. | n.s. | 0.38 | 0.42 | 0.40 | −0.92 | −0.62 |
| 2 | n.s. | −0.16 | n.s. | n.s. | n.s. | n.s. | n.s. | n.s. | −0.76 | −0.43 |
| 3 | n.s. | n.s. | n.s. | n.s. | n.s. | n.s. | n.s. | n.s. | −0.90 | n.s. |
| 4 | n.s. | −0.11 | −0.11 | n.s. | n.s. | 0.22 | 0.17 | n.s. | −0.59 | −0.57 |
| 5 | n.s. | n.s. | n.s. | n.s. | n.s. | n.s. | n.s. | n.s. | −0.89 | −0.76 |
| 6 | n.s. | n.s. | n.s. | n.s. | n.s. | n.s. | 0.23 | 0.24 | −0.88 | −0.66 |
Equation 3 predicts the number of thalamic spikes that will occur in each pallidal ISI. Values are correlation coefficients between residuals from Eq. 3 and measures of the duration of the preceding ISI (p-ISI), the mean pallidal rate in the preceding 50 (P50), 100 (P100), and 150 (P150) ms, the number of thalamic spikes in the preceding pallidal ISI (pre#DLM), the mean thalamic rate in the preceding 50 (T50), 100 (T100), and 150(150) ms, and the p-t (p-t) and t-t (t-t) intervals measured in the same pallidal ISI. Correlations and P values were computed with the corrcoef function in MATLAB. P < 0.005 was considered significant.
A biophysical model of the pallidothalamic interaction.
To better understand the mechanisms driving thalamic activity during singing, we developed a biophysical model of the LMAN-projecting DLM cell type. The model parameters were selected to make it match, to the extent possible, the physiological and synaptic properties of DLM neurons studied in brain slices (Luo and Perkel 1999a, 2002). Since these slice studies were conducted at room temperature, our selected parameters were applicable at 25°C; to model conditions at higher temperatures, they were scaled by known or estimated temperature dependences (see materials and methods). At 25°C, the model had a resting membrane potential of −57 mV and an input resistance of 428 MΩ. When injected with hyperpolarizing current pulses, it exhibited prominent time-dependent inward rectification with a magnitude and time course similar to those observed in DLM neurons recorded in vitro (Fig. 10A; cf. Fig. 5A of Luo and Perkel 1999a). If sufficiently hyperpolarized, the model fired a rebound action potential shortly after the termination of the current pulse (Fig. 10A). Setting the spike-generating Na+ conductance to zero permitted an unobstructed view of the low-threshold spike that is responsible for the rebound action potential (Fig. 10A, inset); it is mediated by the T-type Ca2+ conductance that recovers from inactivation during hyperpolarization.
Fig. 10.
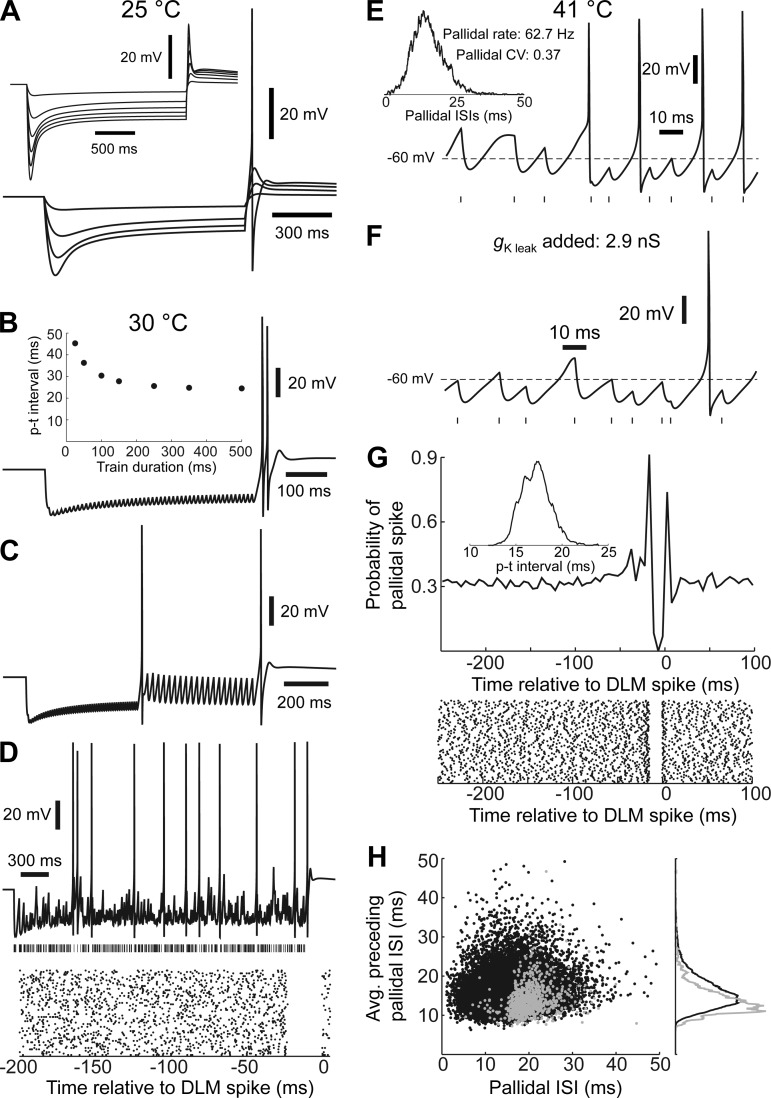
DLM neuron model. A: response of the model to hyperpolarizing current pulses when simulated at room temperature. Model was simulated with 1-s pulses of −10 pA, −30 pA, −50 pA, and −70 pA. Inset, response of model to hyperpolarizing current pulses when the spike-generating Na+ conductance is set to zero. Pulses are 2 s in duration, ranging from −110 pA to −10 pA in 20-pA increments. B: response of the model to inhibitory postsynaptic potentials (IPSPs) when simulated at 30°C: a 500-ms train of stimuli, delivered at 100 Hz. Inset, p-t interval as a function of stimulus train duration. C: a 100-Hz train of stimuli is delivered for 500 ms followed by a switch to stimulation at 40 Hz. D: response to a 140-Hz Poisson train of stimuli for 3 s. The vertical lines show the pallidal spike times on this trial. The raster shows the time of stimuli (IPSP onsets) relative to model spikes. E: response of the model to simulated anesthetized pallidal activity at 41°C. The trace shows a brief segment of the membrane potential trajectory during stimulation; the dashed line is −60 mV. The vertical lines show the pallidal spike times (IPSP onsets). Inset, distribution of simulated pallidal ISIs. F: response of the model to the same pattern of stimuli when the K+ leak conductance (gK leak) is increased to 5 nS: a brief segment of the membrane potential trajectory during stimulation. G: probability of pallidal spike in 5-ms bins as a function of time relative to a model DLM spike. Inset, p-t interval distribution. Bottom: raster of pallidal spike times relative to DLM model spikes. H: pallidal ISIs plotted against the average pallidal ISIs in the preceding 50 ms (pallidal spike train from pair 4). The black circles denote pallidal ISIs that did not contain a model thalamic spike; the gray circles are pallidal ISIs that contained 1 or more thalamic spikes. Right: distribution of average preceding ISIs for pallidal ISIs lacking thalamic spikes (black) or containing thalamic spikes (gray).
To assess the ability of our model to accurately reproduce the response of DLM neurons to pallidal input, we compared the behavior of our model to DLM neurons recorded in vitro. Person and Perkel (2005) characterized the response of DLM neurons to pallidal input in great detail, using a variety of stimulus patterns that probed the propensity of DLM neurons to engage in postinhibitory rebound firing; we tested our model with these stimulus patterns. We represented the pallidal synapse with a chloride conductance that at 25°C attained a peak value of 12 nS and decayed with a time constant of 10 ms, based on the measurements of Luo and Perkel (2002). At 30°C—the temperature at which Person and Perkel (2005) did most of their experiments—the GABAA conductance triggered by pallidal spike had a peak of 14.7 nS and a decay time constant of 6.9 ms. Person and Perkel (2005) measured the latency to the thalamic spike following the termination of 100-Hz stimulus trains while varying train duration and temperature. After a 500-ms train of IPSPs delivered at 100 Hz, our model generated a rebound burst with a latency of 24.6 ms (Fig. 10B; cf. Fig. 4 of Person and Perkel 2005). Shorter IPSP trains evoked rebound firing at longer latencies (Fig. 10B, inset), demonstrating a dependence on stimulation history similar to that reported for DLM neurons recorded in vitro (Person and Perkel 2005). Person and Perkel (2005) found that the p-t latency following 100-Hz stimulus trains decreased with increasing temperature, reporting an average Q10 of 2.6 when measured over 28–32°C; our model exhibited a similar temperature sensitivity (Q10 of 2.1 over 28–32°C).
Person and Perkel (2005) tested the ability of DLM neurons to generate rebound spikes during ongoing inhibition in three ways, and we tested our model with the same methods. First, they used brief 100-Hz stimulus trains interspersed with longer stimulus intervals, during which a rebound spike might occur, and were able to drive repetitive rebound firing at an average maximal rate of 13 Hz (range: 6–23 Hz; Person and Perkel 2005). With this kind of stimulus pattern (repeated 100-Hz trains of 4 IPSPs interspersed with 30.5-ms gaps), our model achieved a maximum rebound rate of 16.5 Hz. Second, Person and Perkel (2005) measured the ability of DLM neurons to fire a rebound spike after a drop in stimulus rate; DLM neurons were able to respond to changes from 100 Hz to 25–50 Hz. Our model was able to respond to a shift from 100 Hz to 40 Hz or less (Fig. 10C; cf. Fig. 5 of Person and Perkel 2005). Finally, Person and Perkel (2005) assessed the ability of DLM neurons to fire during 3-s Poisson stimulus trains (mean rate 140 Hz). Under these conditions, DLM neurons fired at ∼2.5 Hz on average, with rebound spikes following stimulus intervals longer than 20 ms (Person and Perkel 2005). Our model behaved similarly (Fig. 10D; cf. Fig. 2 of Person and Perkel 2005) and fired at ∼4 Hz during 140-Hz Poisson stimulation. Overall, our model behaved like a typical DLM neuron reported by Person and Perkel (2005), with similar temperature sensitivity, and exhibited a pronounced tendency to fire rebound spikes.
To use our model to simulate the behavior of DLM neurons in vivo in anesthetized birds, we raised the simulation temperature to 41°C (zebra finch body temperature) and drove it with simulated pallidal spike trains designed to resemble the pallidal spike trains recorded in the absence of auditory stimulation (see materials and methods). At 41°C, the unitary GABAA conductance peaked at 23 nS and decayed with a time constant of 3.1 ms. Under baseline conditions, DLM neurons recorded in anesthetized birds fire at average rates of ∼2.5 Hz, with individual DLM neurons ranging from 0 to ∼10 Hz (Kojima and Doupe 2009; Leblois et al. 2009; Person and Perkel 2007). However, our model fired at 28.1 Hz (Fig. 10E), well above this range. This difference could be explained by neuromodulatory influences present in vivo or by changes induced by anesthesia. Both thalamic neuromodulators and anesthetics can affect voltage-independent K+ conductances (Franks 2008; McCormick 1992); we can represent their effects in our model by altering the K+ leak conductance. Increasing gK leak from its baseline value of 2.1 nS (at 41°C) to 5.0 nS was sufficient to bring the model's firing rate down to 2.8 Hz, consistent with firing rates reported in vivo (Fig. 10F). Under these conditions, model spikes were preceded by a rise in pallidal spike probability followed by a sharp drop (Fig. 10G), an acceleration-deceleration sequence in pallidal rate similar to what was reported in previous studies (Kojima and Doupe 2009; Leblois et al. 2009; Person and Perkel 2007). Thalamic spikes tended to occur during longer-than-average pallidal ISIs, but spike probability was also influenced by the preceding history of pallidal activity: the average of pallidal ISIs in a 50-ms window preceding the ISI containing a DLM spike (13.9 ± 3.7 ms) was shorter than those preceding ISIs that did not contain a spike (16.0 ± 4.4 ms, Mann-Whitney test, P < 0.0001; Fig. 10H). This history dependence is qualitatively similar to that observed by Kojima and Doupe (2009) in vivo, although it was not as strong. Although invoking a neuromodulatory K+ leak conductance was able to explain most of the differences between our baseline model at 41°C and in vivo recordings made in anesthetized birds, other explanations are possible. For example, the brain temperature under anesthesia may be considerably lower than 41°C; we have observed the brain temperature to drop to 32°C under anesthesia even as the body temperature is monitored and maintained with a heating pad (M. A. Long and M. S. Fee, unpublished observations). When our baseline model was run at 32°C and driven by simulated anesthetized pallidal activity (like that depicted in Fig. 10E), it fired at 2.1 Hz.
To simulate conditions when the bird is awake and singing, we drove our model with a pallidal spike train recorded from a singing bird (pair 4, Tables 3–5, Figs. 7–9). This pallidal unit fired at an average rate of 175.8 Hz, with an ISI CV of 0.66. When driven with this sequence of IPSPs, the model DLM neuron fired at just 9.8 Hz (Fig. 11A). By comparison, the DLM unit recorded with this pallidal spike train fired at 110.8 Hz. This discrepancy may be caused by an inaccuracy in our model, perhaps because some of the conductances do not scale with temperature in the way we assumed or are modulated in unexpected ways in the awake in vivo state. We sought to determine whether reasonable changes in model parameters could enable the model to fire at the rates we observed in real DLM neurons (∼100 Hz) via a postinhibitory rebound mechanism. We focused our attention on three conductances that are critical for rebound firing: the T-type Ca2+ conductance, the HCN conductance, and the GABA conductance triggered by pallidal input, varying both the magnitude and kinetics of these conductances (Fig. 11, B–G). In all cases we varied these parameters while stimulating the model with the pallidal spike train from pair 4. Increasing the maximum T conductance, ḡT, increased the firing rate (Fig. 11B), but much too weakly to achieve the observed in vivo firing rates at remotely plausible values of ḡT: ḡT had to be increased to >1,500 nS to achieve a firing rate of 100 Hz. This seems especially unreasonable in view of the fact that we already scaled ḡT with a Q10 twice as large as most other conductances (Q10 of 3 vs. 1.5). Increasing the T inactivation time constant also increased the DLM firing rate (Fig. 11C), but only to a maximum rate of ∼18 Hz. Increasing the HCN conductance decreased the firing rate, whereas decreasing it raised the rate only slightly before again causing a decrease (Fig. 11D). Altering the HCN activation time constant had virtually no effect on firing rate (Fig. 11E). Increasing the peak GABA conductance activated by pallidal input paradoxically increased firing rate (Fig. 11F), probably because the rebound mechanism benefited from increased hyperpolarization, but the firing rate could not be raised beyond 16 Hz in this way. Both increases and decreases in the GABA decay time constant lowered the firing rate (Fig. 11G).
Fig. 11.
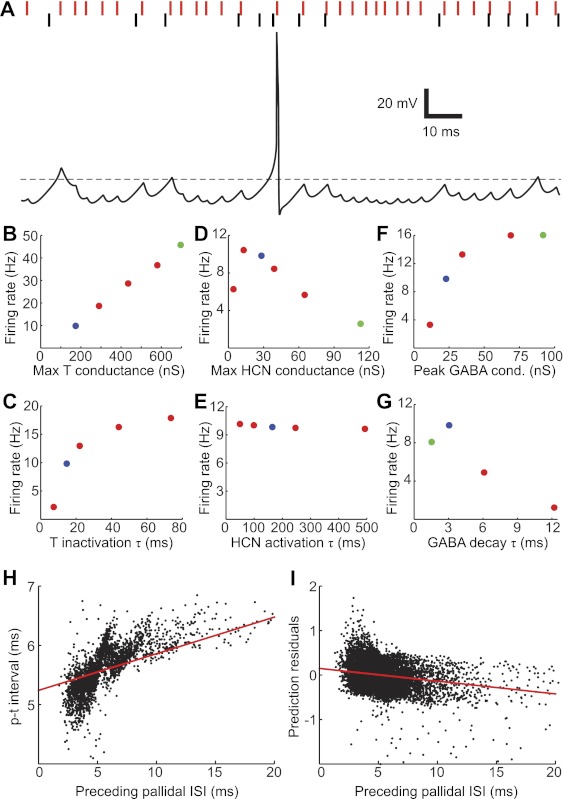
Postinhibitory rebound firing in the model: response to a recorded pallidal spike train. A: response of the model (at 41°C) to a pallidal spike train recorded in a singing bird (pair 4). The trace shows a brief segment of the membrane potential trajectory during stimulation; the dashed line is −60 mV. The vertical red and black lines show the pallidal and thalamic spike times, respectively, recorded in this pair during this time segment. B–G: red circles, effect of selected model parameters on average firing rate, including maximal T conductance (B), T inactivation time constant (τ) (C), maximal HCN conductance (D), HCN activation time constant (E), peak GABA conductance (F), and GABA decay time constant (G). The T inactivation and HCN activation time constants are voltage dependent; the plots show their values at −70 mV. Blue circles, parameter values of baseline model. Green circles, parameter values for modified model shown in H and I (baseline values were used for the T inactivation and HCN activation time constants). H and I: examples of history dependence exhibited by the modified model. Both the p-t interval (H) and the residuals of the prediction given by Eq. 1 (I) varied with the duration of the preceding pallidal ISI. Red lines show linear fit to the data.
No single parameter could be adjusted within a plausible range to make our model generate rebound firing at the rates we observed in vivo. However, we wondered whether the joint alteration of several model parameters could work. To see how that might be done, consider how multiple conductances must cooperate to generate a rebound response. Postinihibitory rebound requires hyperpolarization to remove T channel inactivation, but at those hyperpolarized potentials there is little or no T channel activation; another depolarizing conductance is needed bring the membrane potential into the range of T activation to obtain a rapid rebound response. The HCN conductance plays that role here, and in our model the speed of rebound depends critically on this conductance (not shown). Yet gHCN alone cannot accelerate the rebound beyond a certain level because its driving force drops and ultimately reverses as the membrane potential approaches spike threshold. Thus, to obtain faster postinhibitory rebound, HCN and T conductances must be increased together, and gGABA must also be increased because gHCN reduces IPSP amplitude (although gHCN is activated by hyperpolarization, its comparatively slow kinetics make it effectively constant under our stimulation conditions, thereby lowering overall membrane resistance). Rebound speed can be further increased by shortening the GABAA decay time constant. By adjusting these 4 parameters (ḡHCN, ḡT, gGABA, and τGABA, to values marked by the green circles of Fig. 11, B–G), we obtained a model that generated rebound firing at a rate (98.8 Hz) comparable to the rates observed for DLM neurons in singing birds. However, the alterations required were extreme: the HCN, T, and GABA conductances were quadrupled, and the GABA decay time constant was halved, to 1.5 ms (if the decay time constant was left unchanged at 3.1 ms, the model fired at 57.9 Hz). If these values were to be obtained by temperature scaling from 25°C, it would require Q10 values of 4.8, 7.1, 3.6, and 3.2 for ḡHCN, ḡT, gGABA, and τGABA, respectively. Furthermore, these alterations imparted a history dependence to model thalamic spiking that we did not observe in our recordings. For example, there was a strong nonlinear relationship between the average p-t interval and the duration of the preceding pallidal ISI (Fig. 11H, compare to Fig. 7E) that also showed up as a significant linear correlation (r = 0.59, P < 0.0001). In addition, when we used the linearized model (Eq. 3) to predict the number of model spikes fired during a pallidal ISI, we found a relatively strong relationship between the residuals from Eq. 3 and the preceding pallidal ISI (Fig. 11I,; r = −0.30, P < 0.0001). In summary, we were unable to make our model behave like DLM neurons recorded in awake birds with plausible alterations in intrinsic conductances or pallidal input.
A glutamatergic conductance enables the model to replicate DLM firing statistics during singing.
DLM receives a glutamatergic projection from nucleus RA (Luo and Perkel 2002; Vates et al. 1997; Wada et al. 2004; Wild 1993), and we wondered whether the addition of an excitatory conductance might allow our model fire at the high rates observed during singing. We found that increasing glutamatergic conductance (gglutamate) produced a monotonically increasing DLM firing rate (Fig. 12A). At low gglutamate, spiking was largely eliminated by removal of the T-type Ca2+ conductance (gT), but as gglutamate was increased the sensitivity of firing rate to removal of gT declined rapidly and was negligible by the time gglutamate reached the level required to drive the model at firing rates attained in unanesthetized birds (Fig. 12B).
Fig. 12.
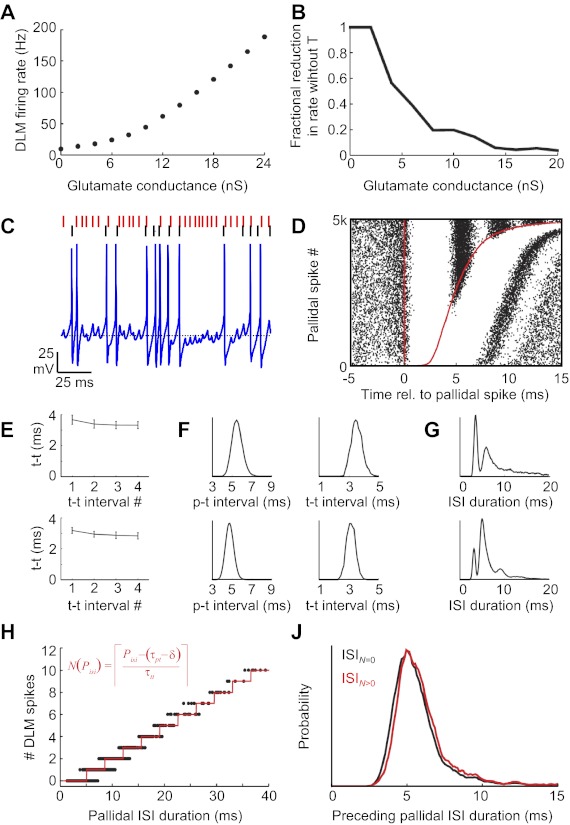
Behavior of the model when both pallidal and glutamatergic input are supplied. A: effect of glutamatergic conductance on the average DLM firing rate driven with pallidal spike train recorded during singing (from pair 4). B: fraction of the firing rate that depends on the T-type Ca2+ conductance as a function of glutamatergic conductance. This fraction was defined as the difference between the firing rates with and without the T conductance divided by the firing rate with the T conductance. At low gglutamate model spiking is wholly dependent on the T conductance, but for gglutamate > 15 nS the firing rate is almost unaffected by removal of the T conductance. C: response of the model to a recorded pallidal spike train in the presence of a constant but “noisy” glutamatergic conductance (mean: 17 nS, SD: 2 nS). The trace shows a brief segment of the membrane potential trajectory during stimulation; the dashed line is −50 mV. The red and black vertical lines show the recorded (actual) pallidal and thalamic spike times, respectively. D: raster plot of model spikes (black) aligned to the timing of pallidal spikes (red). Red line at right shows the time of the next pallidal spike. Spikes are sorted by the duration of the pallidal ISI. The top and bottom rows for E–G were generated with 2 different pallidal spike trains. (top row from pair 4; bottom row from pair 1; compare to Fig. 5E). In this case, the model firing rate was matched to the corresponding thalamic unit rate by applying a glutamatergic conductance of 22.5 ± 2 nS. E: average t-t intervals plotted as a function of the interval number within an HTD. F: distributions of model-generated p-t (left) and t-t intervals (right) for the 2 pairs shown in E. G: distributions of model-generated ISIs for the 2 pairs shown in E. H: number of model spikes fired during a pallidal ISI as a function of the duration of that ISI. Red line is the prediction generated from Eq. 1. I: distribution of pallidal ISIs averaged over a 50-ms window preceding pallidal ISIs that contained no thalamic spike (black) or at least 1 thalamic spike (red).
We next wondered whether adding gglutamate would allow the model neuron to replicate the firing patterns of DLM neurons during singing. We found that at a glutamatergic conductance averaging 17 ± 2 nS (see materials and methods), the model neuron fired like DLM neurons in several respects. The model neuron exhibited a similar average firing rate (model: 110.7 Hz; actual: 109.7 Hz) and discharged at similar times as the recorded DLM neuron (Fig. 12C). The cross correlation between model and actual spike trains was significant (cc = 0.48, compared with cc = 0.27 for zero glutamate conditions, P < 0.001; see materials and methods). In addition, as with the recorded pair, each pallidal spike was followed by a brief period of near-total thalamic spike suppression lasting an average of 5.4 ms (compared with 5.5 ms in the real neuron; Fig. 12D). This suppression began with a latency (the δ parameter; Fig. 2D) of 445 μs after the pallidal spike (compared with 725 μs in the recorded pair). As in recorded DLM neurons, model thalamic spikes appeared at regular intervals during longer pallidal ISIs (Fig. 12, D and E) and both the p-t and t-t intervals were narrowly distributed (Fig. 12F). The model exhibited a similar multipeaked ISI distribution (Fig. 12G), and the number of spikes during a pallidal ISI grew linearly with ISI duration (Fig. 12H). Using the model's average p-t interval (5.40 ms), t-t interval (3.50 ms), and spike suppression delay (0.45 ms), the number of DLM spikes in a pallidal ISI was well predicted by Eq. 1 (r = 0.96).
In addition, like the DLM recordings in awake birds, spike generation in the model in the presence of excitatory drive showed no sign of the history dependence observed in anesthetized recordings. The analysis of Kojima and Doupe (2009) carried out on the model spike train revealed that pallidal ISIs preceding an interval containing a thalamic spike (averaged in a 50-ms window) were not shorter than pallidal ISIs preceding an interval not containing a spike (Fig. 12I), as reported in anesthetized birds, but were in fact slightly longer (6.4 ± 3.8 ms vs. 6.0 ± 3.2 ms, P < 0.0001, Mann-Whitney test). This result, similar to that found in real DLM neurons during singing, is not consistent with a role for rebound spiking (Fig. 8). We also examined how p-t and t-t intervals depended on the history of thalamic and pallidal activity in the model, as we did for our recordings. The p-t and t-t intervals produced by the model were at most weakly correlated with measures of past pallidal and thalamic spiking (see Table 6). We also checked our model for correlations between the residuals from the linearized model (Eq. 3) and the history of pallidal and thalamic activity. Again, the correlations were weak or not statistically significant (see Table 6). Together, our findings demonstrate that our model DLM neuron behaves remarkably like DLM neurons recorded during singing provided there is a glutamatergic conductance to drive spiking. All of the findings described above were unaffected by setting the conductance of the low-threshold calcium conductance in the model to zero, suggesting that a postinhibitory rebound mechanism is not necessary for any aspect of DLM neuron behavior we have examined in singing birds.
Table 6.
History dependence of simulated DLM spiking
| p-ISI | P50 | pre#DLM | T50 | |
|---|---|---|---|---|
| p-t interval | −0.09 | n.s. | −0.11 | −0.04 |
| t-t interval | n.s. | n.s. | n.s. | n.s. |
| Residuals to Eq. 3 | 0.11 | −0.04 | 0.14 | 0.06 |
Values are correlation coefficients between p-t interval, t-t interval, and residuals to Eq. 3 and the preceding ISI (p-ISI), the mean pallidal (P50) and thalamic (T50) rate in the preceding 50 ms, and the number of thalamic spikes in the preceding pallidal ISI (pre#DLM).
A case of pallidothalamic gating.
One classic view of pallidothalamic interaction is that pallidal inputs largely suppress thalamic spiking until a “pause” in the pallidal spike train “disinhibits” the thalamic neuron, allowing it to spike (Deniau and Chevalier 1985). While this was not an accurate description of most of the thalamic neurons we recorded in the awake bird, we found that one pallidothalamic pair recorded in the singing bird exhibited precisely this behavior (pair 6, Fig. 13). In this pair the DLM neuron fired at very low average rates (nonsinging: 3.4 Hz; singing: 5.3 Hz) relative to all 28 other DLM neurons recorded (Fig. 13H), but it became strongly active during brief decreases in pallidal firing rate. The average p-t interval for this neuron was significantly longer (7.9 ms) than the average pallidal ISI (3.3 ms across all pallidal terminals) during singing. As a result, only 1.6% of pallidal ISIs were longer than the average p-t interval, with the consequence that thalamic activity could only occur during the longest of pallidal interspike intervals (Fig. 13A).
Fig. 13.
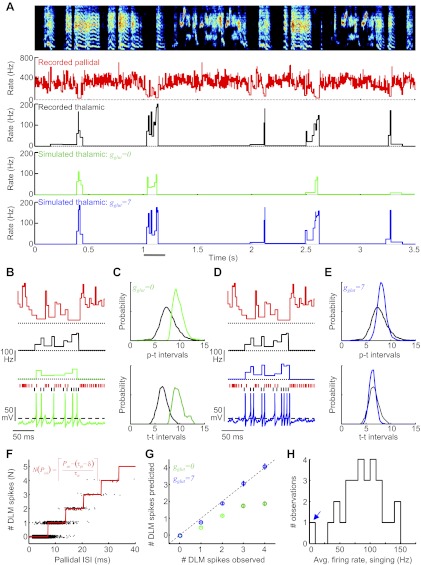
A pallidothalamic pair operating in the “gating mode.” A: song spectrogram is plotted above the instantaneous firing rates (IFRs) of the recorded pallidal neuron (red, top), the connected DLM neuron (black, pair 6), and the model DLM neuron simulated with zero glutamate (green) and with gglutamate = 7 ± 1 nS (blue, bottom). This particular DLM neuron was unique among all 29 recorded because of its low (<10 Hz) mean firing rate during singing. B: expanded view from region of the gray bar beneath the blue IFR trace in A. Bottom: membrane potential of the simulated DLM neuron under zero glutamate conditions. Red and black ticks above voltage trace indicate pallidal and thalamic spike times observed in the recording. Color code as in A. Note the poor match of the model spike times to the observed spikes. C: distribution of p-t (top) and t-t (bottom) intervals, of the recorded pair (black) and those computed from the neuron simulated with gglutamate = 0 nS (green). D and E: data are plotted as in B and C for the model simulated with gglutamate = 7 ± 1 nS. Note the close match of the model spike times to the observed spikes. F: the number of recorded thalamic spikes that discharged within a pallidal ISI is plotted as a function of its duration. Data are from singing periods in this gating pair (n = 49,364 ISIs). Note that even this “gating-mode” pair exhibits the threshold-linear response characteristic of other pairs (red line shows the best fit by Eq. 1, inset). G: predicted number of thalamic spikes in each pallidal ISI is compared to the observed number of spikes for 2 versions of the conductance-based model: gglutamate = 0 nS (green circles) and gglutamate = 7 ± 1 nS (blue symbols). Note that the zero-glutamate model fails to predict the large spike response characteristic of HTDs during long pallidal intervals (compare panels B and D, bottom). H: histogram of mean spike rate of the 29 thalamic neurons recorded during singing. The gating pair shown in this figure is the outlier at low firing rates (blue arrow).
We examined the response of our model DLM neuron to the pallidal spike train recorded during singing in this pair. With gglutamate set to zero, the model DLM neuron generated T channel-dependent rebound spikes at 3.51 Hz (compared with 5.3 Hz observed) and exhibited average p-t and t-t intervals longer than what was measured (simulated p-t and t-t = 10.0 ms and 10.4 ms, respectively, compared with measured 7.9 ms and 6.7 ms) (Fig. 13, A–C). These data suggest that in a rare case where DLM spiking in awake birds exhibits a very low firing rate, a model of rebound spiking could approximate some aspects of DLM firing.
We next added a glutamate conductance and adjusted it until the model neuron exhibited an average firing rate similar to the one recorded during singing. At gglutamate = 7 ± 1 nS the model neuron fired at 6.13 Hz, and the spike rate was only moderately affected by removal of the T conductance (rate = 4.4 Hz without T). Under these conditions, the model discharged almost exactly like the recorded thalamic neuron. The p-t and t-t intervals were narrowly distributed, and their average values were 8.3 ms and 6.4 ms (compared with 7.9 ms and 6.7 ms in the recorded neuron) (Fig. 13E). Notably, even at this low average firing rate, the number of observed thalamic spikes in each pallidal ISI was still well described by a threshold-linear dependence on pallidal ISI duration (Eq. 1, Fig. 13F, r = 0.95). We found that the conductance-based model predicted the average number of spikes that discharged in each pallidal ISI significantly better with gglutamate = 7 ± 1 nS than with zero glutamate (Fig. 13G; gglutamate = 7 ± 1 nS: slope = 1.04; gglutamate = 0 nS, slope = 0.50).
Finally, we found that the model DLM neuron exhibited a detailed pattern of spikes that was remarkably similar to that seen in the recorded DLM neuron (Fig. 13D). The timing of spikes in the model neuron were strongly correlated with the timing of DLM spikes actually observed (cc = 0.71, P < 0.001, significantly more correlated than spikes under zero glutamate conditions, Fig. 13B, cc = 0.41; see materials and methods). Together, these findings show that our model, with a glutamate conductance, can also reproduce the firing pattern of a DLM neuron that exhibits a firing pattern reminiscent of the classic “gating” behavior. More generally, it suggests that our model can capture the spiking behavior of DLM neurons across a wide, naturally occurring, range of parameters.
Dynamic changes in p-t and t-t intervals during singing may be explained by excitatory inputs.
Because RA neurons that project to DLM generate high-frequency bursts at specific times in the song (Goldberg and Fee 2012), DLM neurons are likely exposed to a dynamically changing glutamatergic drive during singing. How does time-varying excitatory input affect DLM spiking? In model simulations, we found that the average duration of the p-t and t-t intervals decreased with higher glutamate conductance (Fig. 14, A and B). In addition, these average intervals covaried as a function of gglutamate (Fig. 14C) in a manner very similar to the covariation of p-t and t-t intervals across pairs in different conditions (Fig. 6C). Importantly, increasing the pallidal firing rate while holding the average gglutamate constant had no effect on the p-t or t-t intervals (Fig. 14D), even though it produced the expected decrease in thalamic firing rate (Fig. 14D, inset). Together these findings suggest that p-t and t-t intervals could be controlled dynamically by gglutamate during singing, while being unaffected by pallidal firing rates.
We set out to determine whether there is any relation between changes in p-t and t-t intervals and variations in glutamatergic inputs to DLM, as inferred from the firing rates of RA neurons that project to DLM (RADLM neurons). These cortical neurons exhibit increased firing rates during singing compared with nonsinging, and this transition occurs in the hundreds of milliseconds prior to the onset of a song bout (Fig. 14E) (Goldberg and Fee 2012). We computed p-t and t-t intervals in 50-ms time bins relative to the onset of song bouts in pairs recorded long enough to resolve p-t (n = 4/6 pairs) and t-t (n = 3/6 pairs) intervals in all time bins. Bout-onset-aligned average values for the p-t and t-t intervals exhibited pronounced decrease prior to song onset (Fig. 14, F and G). These changes were significantly anticorrelated with the firing rate increase observed in the RADLM neurons at song onsets (p-t: r = −0.84 ± 0.05, n = 6; t-t: r = −0.57 ± 0.08, n = 4, P < 0.001). Furthermore, changes in p-t and t-t intervals were significantly correlated with each other (r = 0.64 ± 0.14, P < 0.01, n = 4 pairs). Notably, even though the reductions in p-t and t-t intervals prior to song bouts were in the submillisecond range, they were associated with a substantial thalamic firing rate increase (Fig. 14H). These data are consistent with the hypothesis that increased glutamatergic input to DLM drives an increase in thalamic firing rate by reducing the p-t and t-t intervals during the transition from nonsinging to singing.
DLM neurons and their inputs from RA also exhibit fast firing rate modulations during singing, including rate peaks prior to syllable onsets (Fig. 14I) and rate dips prior to offsets (Goldberg and Fee 2012), raising the possibility that p-t and t-t intervals are also dynamically controlled on a fast timescale during singing. In one pair recorded long enough during babbling to make precise estimates of average p-t and t-t intervals in 10-ms bins, both p-t and t-t intervals exhibited a significant decrease at syllable onsets (Fig. 14, J and K; P < 0.01; see materials and methods), exactly at the same time that RADLM and DLM neurons exhibit a rate increase (Fig. 14, I and L). The time courses of syllable-onset-aligned p-t and t-t intervals were each significantly anticorrelated with the time course of RADLM firing rates (p-t: r = −0.73; t-t: r = −0.41) and were significantly correlated with each other (±200-ms window, r = 0.51, P < 0.001).
These results suggest that excitatory inputs to the thalamus can, in principle, dynamically modulate thalamic firing rates even in the absence of pallidal rate modulations. To test this possibility, we used our conductance-based model to predict the thalamic response to a simulated “syllable-modulated” glutamatergic input that had transient increases at syllable onsets and transient decreases at syllable offsets (Fig. 15, A–E; see materials and methods). The pallidal firing rate was held constant. We found that the model thalamic neuron exhibited firing rate increases and decreases at syllable onsets and offsets, respectively (Fig. 15, F and G), just as observed in DLM neurons during singing (Fig. 14L).
We wondered whether the effect of these dynamic changes in glutamatergic input (at syllable onsets and offsets and between singing and nonsinging), and the corresponding changes in the p-t and t-t intervals, could be detected in the threshold-linear dependence of thalamic spiking on pallidal ISI duration. This relation was plotted, for the model neuron, separately for pallidal ISIs that occurred at syllable onset and at syllable offset and for nonsinging (Fig. 15H). As expected, the thalamic neuron generated fewer spikes in pallidal ISIs at syllable offsets than at syllable onsets, and fewer still in the nonsinging state. These differences were largely reflected in a change in the slope of the linear dependence but also in the threshold ISI duration. A similar pattern was also apparent in one pair recorded in subsong for which there were sufficient data to carry out this analysis (Fig. 15I). Notably, in the model results, the slope of the relation between thalamic spike count and pallidal ISI duration was linearly dependent on the glutamate conductance (Fig. 15J; see materials and methods). Together, these findings show that glutamatergic activation allows thalamic neurons to generate more spikes within pallidal ISIs of a given duration, and that the threshold-linear dependence of thalamic spiking on pallidal ISI duration undergoes a conceptually simple modification with changes in glutamatergic activation.
Pallidal inputs alone cannot explain singing-related thalamic firing patterns.
It has been observed in anesthetized birds that DLM neurons can be activated, in the absence of glutamatergic inputs, by pallidal rate modulations alone via a postinhibitory rebound mechanism (Kojima and Doupe 2009; Leblois et al. 2009; Person and Perkel 2005, 2007). This led us to wonder how our model DLM neuron would respond, in the absence of glutamatergic inputs, to singing-related pallidal inputs. Like RADLM neurons, pallidal inputs to DLM exhibit an increased firing rate during singing and a peak in firing rate prior to syllable onset (Fig. 15K, red line), as well as a dip in firing rate at syllable offset (Goldberg and Fee 2012). The threshold-linear description of pallidothalamic transmission (Eq. 1, Fig. 9A) predicts that pallidal rate increases (and thus shorter pallidal ISIs) should, in the absence of changes of glutamatergic drive, produce a decrease in thalamic spiking at bout and syllable onsets (cf. Supplemental Fig. 8B in Goldberg and Fee 2012).
We wondered whether the conductance-based model also supports this prediction. With glutamate conductance held constant (gglutamate = 17 ± 2 nS, as in Fig. 12), we simulated the model DLM neuron response to six different pallidal spike trains recorded in subsong birds. In all cases, the model neuron produced a firing rate dip prior to syllable onsets (Fig. 15K, dashed line), consistent with the threshold-linear description (Eq. 1). This model result is also consistent with a previous cross correlation analysis of recorded pallidal and thalamic spike trains demonstrating that increases in pallidal firing rate are associated with decreased thalamic firing rates (cf. Fig. 2 in Goldberg and Fee 2012).
In contrast to the firing rate decrease at syllable onset that would be produced by pallidal inputs alone, all DLM neurons recorded during singing exhibited a rate peak at this time (Fig. 15K, solid black line), coincident with increased glutamatergic drive from cortical inputs (Fig. 14I). In addition, these firing rate peaks persisted after lesions of area X, the source of these pallidal inputs (Goldberg and Fee 2012). Thus, in contrast to descriptions of thalamic spiking in anesthetized animals and in slices, our experimental and theoretical observations support the view that in awake animals pallidal rate increases act only to suppress thalamic spiking, and that syllable-locked modulations of thalamic firing are driven by glutamatergic inputs, even in the face of opposing inhibitory pallidal inputs.
DISCUSSION
A striking feature of the songbird pallidothalamic synapse in DLM is the ability to record simultaneously from synaptically connected pairs, providing a unique opportunity to examine in detail how thalamic neurons integrate inhibitory pallidal inputs from the BG and excitatory inputs from cortex (Kojima and Doupe 2009; Leblois et al. 2009; Person and Perkel 2007). We have previously performed paired recordings in singing birds and found that thalamic neurons fired at high rates (>100 Hz) even in the presence of high rates of pallidal inhibition (>300 Hz), and that thalamic spikes were entrained to pallidal inputs with submillisecond temporal precision (Goldberg and Fee 2012). Here we analyze in detail how the thalamic activity is shaped by BG output. Our findings suggest a novel mode of pallidothalamic transmission, which we refer to as high-frequency entrainment (HFE).
HFE is notably different from previous descriptions of pallidothalamic interaction, such as gating or rebound bursting (Chevalier and Deniau 1990; Person and Perkel 2005). Here we compare HFE with these other descriptions and discuss how all known modes of interaction may be unified by a single model of thalamic neurons. We suggest that the nature of the pallidothalamic interaction depends fundamentally on the excitability of the thalamic neuron.
Rebound, gating, and entrainment: three modes of pallidothalamic interaction.
In conditions where thalamic neurons receive little or no excitation, such as during anesthesia and sleep, thalamic neurons tend to exhibit burst-mode firing (Franks 2008; Llinas and Steriade 2006; McCormick and Bal 1997). Bursts are generated when low-threshold calcium channels are activated from a hyperpolarized state, and can be triggered directly by the release from hyperpolarization (Jahnsen and Llinas 1984). In DLM in brain slices, it was recently shown that a brief pallidal rate increase followed by a pallidal pause could directly trigger such rebound bursts in the absence of glutamatergic drive (Person and Perkel 2005). Further support for pallidal triggering of rebound bursts was observed in anesthetized birds, where DLM spiking was preceded by acceleration-deceleration sequences in pallidal firing (Kojima and Doupe 2009; Leblois et al. 2009; Person and Perkel 2007).
Our findings in the awake bird differ qualitatively from these previous studies. First, in anesthetized birds, DLM neurons exhibited low average rates (<10 Hz) (Kojima and Doupe 2009; Leblois et al. 2009). In contrast, in behaving birds DLM neurons discharged at high rates (∼100 Hz), and HTD events exceeding 500 Hz were generated from a high background firing rate (>100 Hz) and did not exhibit refractory periods (Fig. 2) (Goldberg and Fee 2012). Second, rebound spiking in the anesthetized bird depends strongly on the history of pallidal activity, presumably because of the time dependence of T-channel inactivation and deinactivation. In the singing bird, however, the p-t interval, the t-t interval, and the number of thalamic spikes in a pallidal ISI were notably independent of the number of recent pallidal spikes on either a short (5 ms) or long (100 ms) timescale (Tables 3–5). Finally, glutamatergic inputs play little or no role in driving rebound spikes (Leblois et al. 2009; Person and Perkel 2007). In contrast, our DLM neuron biophysical model could not reasonably support the roughly 100-Hz thalamic firing rates observed in singing birds unless a strong excitatory conductance was incorporated into the model (Fig. 12). Under these conditions, model thalamic spiking was not dependent on T channels, suggesting that the excitatory conductance was the primary driver of spiking.
Another view of pallidothalamic integration is described by the “gating” model (Chevalier and Deniau 1990). In this view, it is proposed that tonic pallidal input suppresses thalamic spiking (gate closed) until transient reductions—or “pauses”—in pallidal firing disinhibit thalamic neurons (gate open), enabling their activation by excitatory inputs (Deniau and Chevalier 1985; Hikosaka 2007). Of the eight DLM pairs we recorded in awake birds, only one exhibited behavior for which this description seems apt (Fig. 13). In this pair, the high tonic firing of the pallidal neurons completely suppressed thalamic activity except for a few events per song bout in which the pallidal firing rate dropped, allowing the thalamic neurons to fire at high rates. Our model was able to reproduce this behavior with a decreased level of glutamatergic excitation. The reduced glutamatergic drive resulted in a p-t interval much longer than the duration of most pallidal ISIs, with the result that the thalamic neuron failed to spike unless the pallidal ISI was very long.
In most of our data set (n = 7/8 pairs and 28/29 DLM neurons), however, the DLM neurons fired continuously at high rates. This pattern of activity appears qualitatively different from the rebound and gating views described above, and we refer to this mode of thalamic spiking as “entrainment.” In all these pairs, the p-t interval was short—comparable to the average pallidal ISI—such that the DLM neuron spiked in about a third of pallidal ISIs. While thalamic spikes tended to occur more often in longer pallidal intervals than shorter ones, disinhibition by pallidal “pauses” was not necessary to allow thalamic spiking.
Note that our model DLM neuron was capable of generating all three modes of thalamic spiking described here—“rebound,” “gating,” and “entrainment”—depending on the excitability of the DLM neuron. In our model, we have controlled the excitability by the addition of an excitatory glutamatergic synaptic input hypothesized to arise from a cortical projection. When synaptic excitation was low [corresponding to thalamic burst mode (McCormick and Bal 1997)], the model exhibited postinhibitory rebound spiking following strong hyperpolarization. In the presence of moderate excitability [thalamic “tonic” mode (Sherman 2001)], the average duration of thalamic spike suppression (p-t interval) was much longer than the average duration of pallidal ISIs, such that the thalamic neuron was gated-off for extended periods of time, but was allowed to spike during very long pallidal ISIs (Fig. 13). Finally, if thalamic excitability was increased by higher excitatory conductance to a point where the average p-t interval closely matched, or was less than, the mean pallidal ISI duration, then pallidal pauses were not required to permit thalamic activity, and thalamic spikes occurred during a large fraction of pallidal ISIs. In this mode, glutamatergic inputs could exert continuous control over thalamic spiking by dynamically modulating p-t and t-t intervals. For example, syllable onset-locked peaks in DLM firing rate appear to be driven by cortical inputs through a temporally precise reduction of p-t and t-t intervals (Figs. 14 and 15). Thus our biophysical model suggests that the wide range of different behaviors observed in different experimental conditions may depend on the intrinsic or synaptically driven excitability of the thalamic neuron.
A simple conceptual view of the response of DLM neurons to the combined pallidal and thalamic inputs is based on the dependence of the number of thalamic spikes that discharge within each pallidal ISI on the duration of that ISI (Fig. 9, Fig. 13F, Fig. 15, H and I). In both the entrainment and gating modes, the pallidothalamic interaction is captured by a very simple threshold-linear relationship. The “threshold” is the pallidal ISI duration above which the thalamic neuron can spike, and is set by the quantity τpt that determines the p-t interval. At the same time, the number of spikes that occur in a pallidal ISI is set by the quantity τtt that determines the t-t interval, and thus the slope of the linear relation. Importantly, in our model simulations, we found that both τpt and τtt could be controlled by glutamatergic inputs by a well-defined monotonic relation and were unaffected by pallidal firing rates (Fig. 14D). Thus we can think of glutamatergic input and pallidal ISI as independent factors that control thalamic spiking. Interestingly, the effect of glutamatergic input on τtt was such that the slope of the dependence of thalamic spiking on pallidal ISI duration changed linearly (Fig. 15J), and we can thus think of glutamatergic inputs as having a roughly multiplicative effect on the thalamic response. For this reason, we refer to this description of the combined effects of pallidal and excitatory inputs on DLM spiking as the “threshold-linear-multiplicative” model. In the songbird, τpt and τtt appear to be dynamically controlled by cortical inputs (Fig. 14), although it should be noted that these parameters would be affected by any other factors that alter thalamic excitability, such as neuromodulation (Bezdudnaya et al. 2006; McCormick 1992).
Despite this advance in understanding the nature of thalamic integration of its inputs, the significance of the signals being transmitted to or from nucleus DLM is not yet known. One clue may be recent evidence that LMAN, the cortical target of DLM, can drive temporally precise premotor fluctuations that can drive song away from perceived vocal errors (Andalman and Fee 2009; Fee and Goldberg 2011; Fee 2012; Warren et al. 2011). Because DLM is the only known glutamatergic input to LMAN and is required for LMAN-dependent premotor function (Goldberg and Fee 2011), DLM may confer to LMAN song-timing information necessary to implement premotor bias during learning. DLM neurons exhibit firing rate modulations correlated to song timing, a possible neural signature of premotor bias (Goldberg and Fee 2012). It has also recently been suggested that cortical inputs to DLM may carry an efference copy of variability signals that can be used for learning (Charlesworth et al. 2012).
Our recordings in DLM suggest several possible mechanisms by which DLM could influence LMAN activity. First, LMAN neurons may simply sum the firing rates of the DLM inputs. In this case, convergent pallidal and cortical inputs would simply exert dual, opposing control over LMAN by virtue of their effects on DLM firing rate. Another possibility is that LMAN neurons may respond selectively to the HTD of DLM neurons. In this case, longer-than-average pallidal ISIs would have a strong influence on LMAN because they tend to cause HTD events.
Another interesting possibility is suggested by the precise temporal locking of thalamic spikes to pallidal spikes. In particular, LMAN, like other thalamorecipient cortical areas (Bruno and Sakmann 2006), may be tuned to synchrony in thalamic inputs. A synchronized increase in the ISI duration of a population of pallidal neurons could produce synchronized spiking in a population of DLM neurons, which could in turn powerfully drive LMAN activity. In this view, a single spike in a striatal medium spiny neuron (Goldberg and Fee 2010) could powerfully activate LMAN via a brief synchronized inhibition of a small population of pallidal neurons (Leblois et al. 2009).
BG circuitry is highly conserved within the vertebrate brain (Jarvis 2007; Reiner 2009; Reiner et al. 2004b, 2005; Stephenson-Jones et al. 2012). It would be interesting to determine whether mammalian thalamic neurons also exhibit entrainment to pallidal inputs. In the songbird, the short duration of pallidal inhibition may be due to strong excitatory inputs and to the specialized calyceal synapse, which provides many sites for neurotransmitter release and reuptake (Leblois et al. 2009). In mammals, each pallidal terminal forms a dense plexus of multisite boutons on proximal dendrites and somata of thalamic neurons (Bodor et al. 2008; Parent et al. 2001), and single electrical stimulation of BG outputs has been observed to cause thalamic spike suppression lasting only ∼10 ms (Tanibuchi et al. 2009). Studies of pallidothalamic transmission during behavior in mammals are needed to determine whether thalamic entrainment to pallidal inputs is a general phenomenon. It will be important to determine whether the nature of the thalamic integration of pallidal and cortical signals observed in the songbird applies more broadly to mammals as well.
GRANTS
Funding to M. S. Fee was provided by National Institutes of Health (NIH) Grant R01 DC-009183, to J. H. Goldberg by NIH Grant K99 NS-067062 and the Charles King Trust and Damon Runyon Research Foundation postdoctoral fellowships, and to M. A. Farries by NIH Grant NS-047085.
DISCLOSURES
No conflicts of interest, financial or otherwise, are declared by the author(s).
AUTHOR CONTRIBUTIONS
Author contributions: J.H.G. and M.S.F. conception and design of research; J.H.G. performed experiments; J.H.G., M.A.F., and M.S.F. analyzed data; J.H.G., M.A.F., and M.S.F. interpreted results of experiments; J.H.G., M.A.F., and M.S.F. prepared figures; J.H.G., M.A.F., and M.S.F. drafted manuscript; J.H.G., M.A.F., and M.S.F. edited and revised manuscript; J.H.G., M.A.F., and M.S.F. approved final version of manuscript.
ENDNOTE
At the request of the author(s), readers are herein alerted to the fact that additional materials related to this manuscript may be found at the institutional website of one of the authors, which at the time of publication they indicate is: http://senselab.med.yale.edu/ModelDB/ShowModel.asp?model=144572 (the full DLM biophysical model).
ACKNOWLEDGMENTS
We thank Michael Long and Najib Majaj for helpful comments on previous versions of the manuscript.
REFERENCES
- Albin RL, Young AB, Penney JB. The functional anatomy of basal ganglia disorders. Trends Neurosci 12: 366–375, 1989 [DOI] [PubMed] [Google Scholar]
- Alexander GE, Crutcher MD, DeLong MR. Basal ganglia-thalamocortical circuits: parallel substrates for motor, oculomotor, “prefrontal” and “limbic” functions. Prog Brain Res 85: 119–146, 1990 [PubMed] [Google Scholar]
- Andalman AS, Fee MS. A basal ganglia-forebrain circuit in the songbird biases motor output to avoid vocal errors. Proc Natl Acad Sci USA 106: 12518–12523, 2009 [DOI] [PMC free article] [PubMed] [Google Scholar]
- Anderson ME, Turner RS. Activity of neurons in cerebellar-receiving and pallidal-receiving areas of the thalamus of the behaving monkey. J Neurophysiol 66: 879–893, 1991 [DOI] [PubMed] [Google Scholar]
- Asanuma C, Thach WT, Jones EG. Distribution of cerebellar terminations and their relation to other afferent terminations in the ventral lateral thalamic region of the monkey. Brain Res 286: 237–265, 1983 [DOI] [PubMed] [Google Scholar]
- Bar-Gad I, Morris G, Bergman H. Information processing, dimensionality reduction and reinforcement learning in the basal ganglia. Prog Neurobiol 71: 439–473, 2003 [DOI] [PubMed] [Google Scholar]
- Beam KG, Donaldson PL. A quantitative study of potassium channel kinetics in rat skeletal muscle from 1 to 37 degrees C. J Gen Physiol 81: 485–512, 1983 [DOI] [PMC free article] [PubMed] [Google Scholar]
- Bezdudnaya T, Cano M, Bereshpolova Y, Stoelzel CR, Alonso JM, Swadlow HA. Thalamic burst mode and inattention in the awake LGNd. Neuron 49: 421–432, 2006 [DOI] [PubMed] [Google Scholar]
- Bodor AL, Giber K, Rovo Z, Ulbert I, Acsady L. Structural correlates of efficient GABAergic transmission in the basal ganglia-thalamus pathway. J Neurosci 28: 3090–3102, 2008 [DOI] [PMC free article] [PubMed] [Google Scholar]
- Bruno RM, Sakmann B. Cortex is driven by weak but synchronously active thalamocortical synapses. Science 312: 1622–1627, 2006 [DOI] [PubMed] [Google Scholar]
- Budde T, Mager R, Pape HC. Different types of potassium outward current in relay neurons acutely isolated from the rat lateral geniculate nucleus. Eur J Neurosci 4: 708–722, 1992 [DOI] [PubMed] [Google Scholar]
- Buee J, Deniau JM, Chevalier G. Nigral modulation of cerebello-thalamo-cortical transmission in the ventral medial thalamic nucleus. Exp Brain Res 65: 241–244, 1986 [DOI] [PubMed] [Google Scholar]
- Buford JA, Inase M, Anderson ME. Contrasting locations of pallidal-receiving neurons and microexcitable zones in primate thalamus. J Neurophysiol 75: 1105–1116, 1996 [DOI] [PubMed] [Google Scholar]
- Carrillo GD, Doupe AJ. Is the songbird Area X striatal, pallidal, or both? An anatomical study. J Comp Neurol 473: 415–437, 2004 [DOI] [PubMed] [Google Scholar]
- Charlesworth JD, Warren TL, Brainard MS. Covert skill learning in a cortical-basal ganglia circuit. Nature 485: 2012 [DOI] [PMC free article] [PubMed] [Google Scholar]
- Chevalier G, Deniau JM. Disinhibition as a basic process in the expression of striatal functions. Trends Neurosci 13: 277–280, 1990 [DOI] [PubMed] [Google Scholar]
- Coulter DA, Huguenard JR, Prince DA. Calcium currents in rat thalamocortical relay neurones: kinetic properties of the transient, low-threshold current. J Physiol 414: 587–604, 1989 [DOI] [PMC free article] [PubMed] [Google Scholar]
- DeLong MR. Primate models of movement disorders of basal ganglia origin. Trends Neurosci 13: 281–285, 1990 [DOI] [PubMed] [Google Scholar]
- Deniau JM, Chevalier G. Disinhibition as a basic process in the expression of striatal functions. II. The striato-nigral influence on thalamocortical cells of the ventromedial thalamic nucleus. Brain Res 334: 227–233, 1985 [DOI] [PubMed] [Google Scholar]
- Deniau JM, Lackner D, Feger J. Effect of substantia nigra stimulation on identified neurons in the VL-VA thalamic complex: comparison between intact and chronically decorticated cats. Brain Res 145: 27–35, 1978 [DOI] [PubMed] [Google Scholar]
- Doupe AJ, Perkel DJ, Reiner A, Stern EA. Birdbrains could teach basal ganglia research a new song. Trends Neurosci 28: 353–363, 2005 [DOI] [PubMed] [Google Scholar]
- Farries MA, Ding L, Perkel DJ. Evidence for “direct” and “indirect” pathways through the song system basal ganglia. J Comp Neurol 484: 93–104, 2005 [DOI] [PubMed] [Google Scholar]
- Farries MA, Perkel DJ. A telencephalic nucleus essential for song learning contains neurons with physiological characteristics of both striatum and globus pallidus. J Neurosci 22: 3776–3787, 2002 [DOI] [PMC free article] [PubMed] [Google Scholar]
- Fee MS. Oculomotor learning revisited: a model of reinforcement learning in the basal ganglia incorporating an efference copy of motor actions. Front Neural Circuits 6: 38, 2012 [DOI] [PMC free article] [PubMed] [Google Scholar]
- Fee MS, Goldberg JH. A hypothesis for basal ganglia-dependent reinforcement learning in the songbird. Neuroscience 198: 152–170, 2011 [DOI] [PMC free article] [PubMed] [Google Scholar]
- Fee MS, Leonardo A. Miniature motorized microdrive and commutator system for chronic neural recording in small animals. J Neurosci Methods 112: 83–94, 2001 [DOI] [PubMed] [Google Scholar]
- Franks NP. General anaesthesia: from molecular targets to neuronal pathways of sleep and arousal. Nat Rev Neurosci 9: 370–386, 2008 [DOI] [PubMed] [Google Scholar]
- Gale SD, Perkel DJ. Anatomy of a songbird basal ganglia circuit essential for vocal learning and plasticity. J Chem Neuroanat 39: 124–131, 2010 [DOI] [PMC free article] [PubMed] [Google Scholar]
- Goldberg JH, Adler A, Bergman H, Fee MS. Singing-related neural activity distinguishes two putative pallidal cell types in the songbird basal ganglia: comparison to the primate internal and external pallidal segments. J Neurosci 30: 7088–7098, 2010 [DOI] [PMC free article] [PubMed] [Google Scholar]
- Goldberg JH, Fee MS. A cortical motor nucleus drives the basal ganglia-recipient thalamus in singing birds. Nat Neurosci 15: 620–627, 2012 [DOI] [PMC free article] [PubMed] [Google Scholar]
- Goldberg JH, Fee MS. Singing-related neural activity distinguishes four classes of putative striatal neurons in the songbird basal ganglia. J Neurophysiol 103: 2002–2014, 2010 [DOI] [PMC free article] [PubMed] [Google Scholar]
- Goldberg JH, Fee MS. Vocal babbling in songbirds requires the basal ganglia-recipient motor thalamus but not the basal ganglia. J Neurophysiol 105: 2729–2739, 2011 [DOI] [PMC free article] [PubMed] [Google Scholar]
- Guo Y, Rubin JE, McIntyre CC, Vitek JL, Terman D. Thalamocortical relay fidelity varies across subthalamic nucleus deep brain stimulation protocols in a data-driven computational model. J Neurophysiol 99: 1477–1492, 2008 [DOI] [PubMed] [Google Scholar]
- Haber S, McFarland NR. The place of the thalamus in frontal cortical-basal ganglia circuits. Neuroscientist 7: 315–324, 2001 [DOI] [PubMed] [Google Scholar]
- Hessler NA, Doupe AJ. Singing-related neural activity in a dorsal forebrain-basal ganglia circuit of adult zebra finches. J Neurosci 19: 10461–10481, 1999 [DOI] [PMC free article] [PubMed] [Google Scholar]
- Hikosaka O. GABAergic output of the basal ganglia. Prog Brain Res 160: 209–226, 2007 [DOI] [PubMed] [Google Scholar]
- Horak FB, Anderson ME. Influence of globus pallidus on arm movements in monkeys. II. Effects of stimulation. J Neurophysiol 52: 305–322, 1984 [DOI] [PubMed] [Google Scholar]
- Huguenard JR, Prince DA. Slow inactivation of a TEA-sensitive K current in acutely isolated rat thalamic relay neurons. J Neurophysiol 66: 1316–1328, 1991 [DOI] [PubMed] [Google Scholar]
- Ilinsky IA, Kultas-Ilinsky K. An autoradiographic study of topographical relationships between pallidal and cerebellar projections to the cat thalamus. Exp Brain Res 54: 95–106, 1984 [DOI] [PubMed] [Google Scholar]
- Jahnsen H, Llinas R. Voltage-dependent burst-to-tonic switching of thalamic cell activity: an in vitro study. Arch Ital Biol 122: 73–82, 1984 [PubMed] [Google Scholar]
- Jarvis ED. Learned birdsong and the neurobiology of human language. Ann NY Acad Sci 1016: 749–777, 2004 [DOI] [PMC free article] [PubMed] [Google Scholar]
- Jarvis ED. Neural systems for vocal learning in birds and humans: a synopsis. J Ornithol 148: 35–44, 2007 [DOI] [PMC free article] [PubMed] [Google Scholar]
- Kanyshkova T, Broicher T, Meuth SG, Pape HC, Budde T. A-type K+ currents in intralaminar thalamocortical relay neurons. Pflügers Arch 461: 545–556, 2011 [DOI] [PubMed] [Google Scholar]
- Kao MH, Wright BD, Doupe AJ. Neurons in a forebrain nucleus required for vocal plasticity rapidly switch between precise firing and variable bursting depending on social context. J Neurosci 28: 13232–13247, 2008 [DOI] [PMC free article] [PubMed] [Google Scholar]
- Kojima S, Doupe AJ. Activity propagation in an avian basal ganglia-thalamocortical circuit essential for vocal learning. J Neurosci 29: 4782–4793, 2009 [DOI] [PMC free article] [PubMed] [Google Scholar]
- Kubikova L, Turner EA, Jarvis ED. The pallial basal ganglia pathway modulates the behaviorally driven gene expression of the motor pathway. Eur J Neurosci 25: 2145–2160, 2007 [DOI] [PMC free article] [PubMed] [Google Scholar]
- Kubikova L, Wada K, Jarvis ED. Dopamine receptors in a songbird brain. J Comp Neurol 518: 741–769, 2010 [DOI] [PMC free article] [PubMed] [Google Scholar]
- Kultas-Ilinsky K, Ilinsky IA, Massopust LC, Young PA, Smith KR. Nigrothalamic pathway in the cat demonstrated by autoradiography and electron microscopy. Exp Brain Res 33: 481–492, 1978 [DOI] [PubMed] [Google Scholar]
- Kultas-Ilinsky K, Sivan-Loukianova E, Ilinsky IA. Reevaluation of the primary motor cortex connections with the thalamus in primates. J Comp Neurol 457: 133–158, 2003 [DOI] [PubMed] [Google Scholar]
- Kunzle H. Thalamic projections from the precentral motor cortex in Macaca fascicularis. Brain Res 105: 253–267, 1976 [DOI] [PubMed] [Google Scholar]
- Leblois A, Bodor AL, Person AL, Perkel DJ. Millisecond timescale disinhibition mediates fast information transmission through an avian basal ganglia loop. J Neurosci 29: 15420–15433, 2009 [DOI] [PMC free article] [PubMed] [Google Scholar]
- Llinas RR, Steriade M. Bursting of thalamic neurons and states of vigilance. J Neurophysiol 95: 3297–3308, 2006 [DOI] [PubMed] [Google Scholar]
- Luo M, Perkel DJ. A GABAergic, strongly inhibitory projection to a thalamic nucleus in the zebra finch song system. J Neurosci 19: 6700–6711, 1999a [DOI] [PMC free article] [PubMed] [Google Scholar]
- Luo M, Perkel DJ. Intrinsic and synaptic properties of neurons in an avian thalamic nucleus during song learning. J Neurophysiol 88: 1903–1914, 2002 [DOI] [PubMed] [Google Scholar]
- Luo M, Perkel DJ. Long-range GABAergic projection in a circuit essential for vocal learning. J Comp Neurol 403: 68–84, 1999b [PubMed] [Google Scholar]
- MacLeod NK, James TA. Regulation of cerebello-cortical transmission in the rat ventromedial thalamic nucleus. Exp Brain Res 55: 535–552, 1984 [DOI] [PubMed] [Google Scholar]
- MacLeod NK, James TA, Kilpatrick IC, Starr MS. Evidence for a GABAergic nigrothalamic pathway in the rat. II. Electrophysiological studies. Exp Brain Res 40: 55–61, 1980 [DOI] [PubMed] [Google Scholar]
- Marsden CD, Obeso JA. Functions of the basal ganglia—reply. Brain 118: 822, 1995. 7600098 [Google Scholar]
- McCormick DA. Cellular mechanisms underlying cholinergic and noradrenergic modulation of neuronal firing mode in the cat and guinea pig dorsal lateral geniculate nucleus. J Neurosci 12: 278–289, 1992 [DOI] [PMC free article] [PubMed] [Google Scholar]
- McCormick DA, Bal T. Sleep and arousal: thalamocortical mechanisms. Annu Rev Neurosci 20: 185–215, 1997 [DOI] [PubMed] [Google Scholar]
- McFarland NR, Haber SN. Thalamic relay nuclei of the basal ganglia form both reciprocal and nonreciprocal cortical connections, linking multiple frontal cortical areas. J Neurosci 22: 8117–8132, 2002 [DOI] [PMC free article] [PubMed] [Google Scholar]
- Mink JW. The basal ganglia: focused selection and inhibition of competing motor programs. Prog Neurobiol 50: 381–425, 1996 [DOI] [PubMed] [Google Scholar]
- Olveczky BP, Andalman AS, Fee MS. Vocal experimentation in the juvenile songbird requires a basal ganglia circuit. PLoS Biol 3: e153, 2005 [DOI] [PMC free article] [PubMed] [Google Scholar]
- Otis TS, Mody I. Modulation of decay kinetics and frequency of GABAA receptor-mediated spontaneous inhibitory postsynaptic currents in hippocampal neurons. Neuroscience 49: 13–32, 1992 [DOI] [PubMed] [Google Scholar]
- Pare D, Curro'Dossi R, Steriade M. Neuronal basis of the parkinsonian resting tremor: a hypothesis and its implications for treatment. Neuroscience 35: 217–226, 1990 [DOI] [PubMed] [Google Scholar]
- Parent M, Levesque M, Parent A. Two types of projection neurons in the internal pallidum of primates: single-axon tracing and three-dimensional reconstruction. J Comp Neurol 439: 162–175, 2001 [DOI] [PubMed] [Google Scholar]
- Person AL, Perkel DJ. Pallidal neuron activity increases during sensory relay through thalamus in a songbird circuit essential for learning. J Neurosci 27: 8687–8698, 2007 [DOI] [PMC free article] [PubMed] [Google Scholar]
- Person AL, Perkel DJ. Unitary IPSPs drive precise thalamic spiking in a circuit required for learning. Neuron 46: 129–140, 2005 [DOI] [PubMed] [Google Scholar]
- Person AL, Raman IM. Purkinje neuron synchrony elicits time-locked spiking in the cerebellar nuclei. Nature 481: 502–505, 2012 [DOI] [PMC free article] [PubMed] [Google Scholar]
- Reiner A. You cannot have a vertebrate brain without a basal ganglia. In: The Basal Ganglia IX. New York: Springer, 2009, p. 3–24 [Google Scholar]
- Reiner A, Laverghetta AV, Meade CA, Cuthbertson SL, Bottjer SW. An immunohistochemical and pathway tracing study of the striatopallidal organization of area X in the male zebra finch. J Comp Neurol 469: 239–261, 2004a [DOI] [PubMed] [Google Scholar]
- Reiner A, Perkel DJ, Bruce LL, Butler AB, Csillag A, Kuenzel W, Medina L, Paxinos G, Shimizu T, Striedter G, Wild M, Ball GF, Durand S, Guturkun O, Lee DW, Mello CV, Powers A, White SA, Hough G, Kubikova L, Smulders TV, Wada K, Dugas-Ford J, Husband S, Yamamoto K, Yu J, Siang C, Jarvis ED. The Avian Brain Nomenclature Forum: terminology for a new century in comparative neuroanatomy. J Comp Neurol 473: E1–E6, 2004b [DOI] [PMC free article] [PubMed] [Google Scholar]
- Reiner A, Yamamoto K, Karten HJ. Organization and evolution of the avian forebrain. Anat Rec A Discov Mol Cell Evol Biol 287: 1080–1102, 2005 [DOI] [PubMed] [Google Scholar]
- Rouiller EM, Liang F, Babalian A, Moret V, Wiesendanger M. Cerebellothalamocortical and pallidothalamocortical projections to the primary and supplementary motor cortical areas: a multiple tracing study in macaque monkeys. J Comp Neurol 345: 185–213, 1994 [DOI] [PubMed] [Google Scholar]
- Schell GR, Strick PL. The origin of thalamic inputs to the arcuate premotor and supplementary motor areas. J Neurosci 4: 539–560, 1984 [DOI] [PMC free article] [PubMed] [Google Scholar]
- Schwarz JR. The effect of temperature on Na currents in rat myelinated nerve fibres. Pflügers Arch 406: 397–404, 1986 [DOI] [PubMed] [Google Scholar]
- Sherman SM. Tonic and burst firing: dual modes of thalamocortical relay. Trends Neurosci 24: 122–126, 2001 [DOI] [PubMed] [Google Scholar]
- Sherman SM, Guillery RW. Exploring the Thalamus and Its Role In Cortical Function. Cambridge, MA: MIT Press, 2006 [Google Scholar]
- Stephenson-Jones M, Ericsson J, Robertson B, Grillner S. Evolution of the basal ganglia; dual output pathways conserved throughout vertebrate phylogeny. J Comp Neurol. (February 20, 2012). doi:10.1002/cne.23087 [DOI] [PubMed] [Google Scholar]
- Steriade M. Thalamus. In: Encyclopedia of Life Sciences. New York: Wiley, 2001 [Google Scholar]
- Strick PL. Activity of ventrolateral thalamic neurons during arm movement. J Neurophysiol 39: 1032–1044, 1976 [DOI] [PubMed] [Google Scholar]
- Tanibuchi I, Kitano H, Jinnai K. Substantia nigra output to prefrontal cortex via thalamus in monkeys. I. Electrophysiological identification of thalamic relay neurons. J Neurophysiol 102: 2933–2945, 2009 [DOI] [PubMed] [Google Scholar]
- Tracey DJ, Asanuma C, Jones EG, Porter R. Thalamic relay to motor cortex: afferent pathways from brain stem, cerebellum, and spinal cord in monkeys. J Neurophysiol 44: 532–554, 1980 [DOI] [PubMed] [Google Scholar]
- Vates GE, Vicario DS, Nottebohm F. Reafferent thalamo-“cortical” loops in the song system of oscine songbirds. J Comp Neurol 380: 275–290, 1997 [PubMed] [Google Scholar]
- Wada K, Sakaguchi H, Jarvis ED, Hagiwara M. Differential expression of glutamate receptors in avian neural pathways for learned vocalization. J Comp Neurol 476: 44–64, 2004 [DOI] [PMC free article] [PubMed] [Google Scholar]
- Warren TL, Tumer EC, Charlesworth JD, Brainard MS. Mechanisms and time course of vocal learning and consolidation in the adult songbird. J Neurophysiol 106: 1806–1821, 2011 [DOI] [PMC free article] [PubMed] [Google Scholar]
- Wild JM. Descending projections of the songbird nucleus robustus archistriatalis. J Comp Neurol 338: 225–241, 1993 [DOI] [PubMed] [Google Scholar]
- Zweig RM. Functions of the basal ganglia. Brain 118: 822, 1995 [DOI] [PubMed] [Google Scholar]