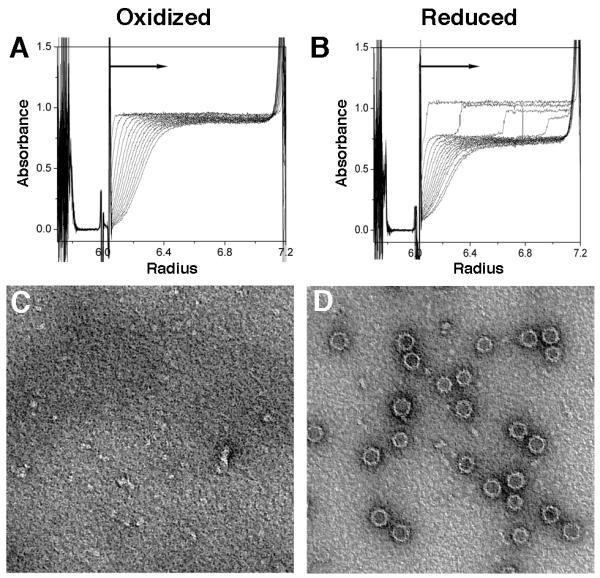
Figure 3. Centrifugation and electron microscopy experiments on HBeAg in reduced and oxidized forms.

(A, B) Sedimentation velocity analyses performed on (A) oxidized and (B) reduced HBeAg using a Beckman Optima XL-I analytical ultracentrifuge, absorption optics, an An-60 Ti rotor, and standard double-sector centerpiece cells. Measurements at 20 °C were taken at 45,000 rpm for 3 hours with data collection at 10 minute intervals. The profiles show protein absorbance at 280 nm as a function of radial distance.
(C, D) Negative-staining EM of assembly products of (C) oxidized and (D) reduced HBeAg. Both samples, in PBS +/− DTT, were buffer-exchanged into TBS to avoid precipitation. Both images are at the same magnification; capsids are ~32 nm in diameter.
