

Abstract
Several mutations in α4 or β2 nicotinic receptor subunits are linked to autosomal dominant nocturnal frontal lobe epilepsy (ADNFLE). One such missense mutation in the gene encoding the β2 neuronal nicotinic acetylcholine receptor (nAChR) subunit (CHRNB2) is a valine-to-leucine substitution in the second transmembrane domain at position 287 (β2VL). Previous studies indicated that the β2VL mutation in mice alters circadian rhythm consistent with sleep alterations observed in ADNFLE patients (Xu et al., 2011). The current study investigates changes in nicotinic receptor function and expression that may explain the behavioral phenotype of β2VL mice. No differences in β2 mRNA expression were found between wild-type (WT) and heterozygous (HT) or homozygous mutant (MT) mice. However, antibody and ligand binding indicated that the mutation resulted in a reduction in receptor protein. Functional consequences of the β2VL mutation were assessed biochemically using crude synaptosomes. A gene-dose dependent increase in sensitivity to activation by acetylcholine and decrease in maximal nAChR-mediated [3H]-dopamine release and 86Rb efflux were observed. Maximal nAChR-mediated [3H]-GABA release in the cortex was also decreased in the MT, but maximal [3H]-GABA release was retained in the hippocampus. Behaviorally both HT and MT mice demonstrated increased sensitivity to nicotine-induced hypolocomotion and hypothermia. Furthermore, WT mice display only a tonic-clonic seizure (EEG recordable) 3 min after injection of a high dose of nicotine, while MT mice also display a dystonic arousal complex (non-EEG recordable) event 30 s after nicotine injection. Data indicate decreases in maximal response for certain measures are larger than expected given the decrease in receptor expression.
Keywords: nicotinic acetylcholine receptor, autosomal dominant nocturnal frontal lobe epilepsy, nicotine, autoradiography, knock-in mouse, synaptosomes
1. Introduction
Autosomal dominant nocturnal frontal lobe epilepsy (ADNFLE) is a form of familial monogenic epilepsy marked by partial seizures that include rhythmic and repetitive limb movements, dystonic posturing, and rapid uncoordinated movements during phase II of non-REM sleep (Steinlein, 2010). Some ADNFLE patients carry mutations in the CHRNA4, CHRNB2 or CHRNA2 genes, which encode the nicotinic acetylcholine receptor (nAChR) α4, β2, and α2 subunits respectively (Aridon et al., 2006; Bertrand et al., 2005; De Fusco et al., 2000; Hirose et al., 1999; Phillips et al., 2001; Steinlein et al., 1997; Steinlein et al., 1995). The clinical phenotypes appear indistinguishable among patients with different mutations (Combi et al., 2004). The human mutations have quite high penetrance for ADNFLE (De Fusco et al., 2000; Phillips et al., 1995)
Several mutations have been elucidated in the α4β2*-nAChR of ADNFLE patients (* indicates possible presence of additional subunits). Several are in the channel-lining second transmembrane (M2) domain of the α4 subunit (S247F, S252L, and 776ins3); while other mutations are located in the M2 domain of the β2 subunit, including V287L and V287M (Bertrand et al., 2005; Combi et al., 2004; De Fusco et al., 2000; Oldani et al., 1998; Phillips et al., 2001; Steinlein et al., 1997). ADNFLE mutations in α4β2*-nAChR result in increased sensitivity to acetylcholine, leading to a receptor gain-of-function. This increase agonist sensitivity has been postulated to contribute to a lowered seizure threshold consistent with an epilepsy phenotype (Bertrand et al., 2002; Fonck et al., 2005; Klaassen et al., 2006). Furthermore, genetic deletions of the α4 or β2 subunits in mice do not result in spontaneous seizures or any form of nicotine-induced phenotype typical of ADNFLE (McCallum et al., 2006; Picciotto et al., 1998; Tritto et al., 2004).
The β2V287L (β2VL) mutation was first identified in a family in which all eight affected members had the mutant gene (DeFusco et al., 2000), However, the mutation showed incomplete penetrance as four unaffected members also carried the β2VL mutation. In vitro studies in oocytes or cell lines transfected with the subunits of interest have demonstrated the impact of this mutation on receptor function. HEK293 cells transfected with α4β2-nAChR harboring the β2VL missense mutation displayed a considerably slower rate of desensitization as compared to wild-type α4β2 receptors (De Fusco et al., 2000). The same β2VL mutation reduced the Ca2+ dependent potentiation of the acetylcholine response in α4β2-nAChR (Rodrigues-Pinguet et al., 2003).
Two different mouse models of ADNFLE have been generated using the β2VL mutant gene. One was made by transgene insertion resulting in three lines with varying copy number (Manfredi et al., 2009). Mice with higher copy number display an epileptic phenotype, as measured by continuous 24 hour EEG; more seizures were seen in the higher copy number lines while the line with low expression did not have seizures. Consistent with ADNFLE in humans, the seizures occurred predominately during the sleep phase and mostly during periods of increased delta wave activity. However, numbers of receptors did not change with expression of the mutation. Another model of the β2VL mutation is a knock-in mouse, which has an altered activity-rest cycle, as well alterations in anxiety behaviors (Xu et al., 2011). These mice are also more sensitive to nicotine-induced convulsions, especially the milder signs including Straub tail (Xu et al., 2011). Spontaneous seizures were rarely observed, but mutant mice did have a higher mortality rate, possibly because of unobserved seizures.
This knock-in mouse provides a model to investigate whether this mutation alters expression or function of β2*-nAChRs in an animal, and whether these alterations result in behavioral changes. In the current study, β2VL knock-in mice were studied for the effects of this mutation on behavioral and physiological traits affected by nicotine in wild-type mice. In addition, the effects of the β2VL mutation on β2 mRNA expression, nAChR numbers and nAChR-mediated synaptosomal function were assessed in multiple brain regions.
2. Methods
2.1. Materials
The radioisotopes [3H]-dopamine (7,8-3H at 30–50 Ci/mmol), [3H]-GABA (2,3-3H at 35 Ci/mmol), α[35S]-UTP (1250 Ci/mmol), [125I]-epibatidine (2200 Ci/mmol), and carrier-free 86RbCl (initial specific activity 13.6–18.5 Ci/μg)were purchased from Perkin Elmer (Waltham, MA). α-Conotoxin MII (α-CtxMII) and [125I]-α-CtxMII were prepared as described previously (Cartier et al., 1996; Whiteaker et al., 2000b). NaCl, KCl, CaCl2, MgSO4, glucose, sucrose, HEPES, tetrodotoxin, (−) nicotine bitartrate, (−)-nicotine free base, acetylcholine iodide (ACh), diisopropyl fluorophosphate (DFP), polyethelenimine, bovine serum albumin (BSA), and cytisine were purchased from Sigma Chemical Co (St. Louis, MO). Normal rat serum and protease free bovine serum albumin were purchased from Jackson ImmunoResearch (West Grove, PA).
2.2. β2VL Mice
Knock-in mice were generated using a mixed BALB6/C57B6 background (Xu et al., 2011) and were obtained from Dr. Stephen Heinemann at the Salk Institute. Mice were bred at the Institute for Behavioral Genetics, Boulder, CO. Lights were maintained on a 12 h light/dark cycle with lights on at 7am. Animal care and experimental procedures were performed in accordance with the guidelines and with the approval of the Animal Care and Utilization Committee at the University of Colorado, Boulder. Upon weaning, tail clippings were obtained for genotyping as described (Xu et al., 2011). Mice were housed with like-sexed littermates and allowed access to food and water ad libitum. Wildtype β2VL mice (β2 287VV, WT), heterozygous (β2 287VL, HT), and mutant (β2 287LL, MT) mice were assessed.
2.3. Tissue preparation for autoradiographic ligand binding and in situ hybridization
Following cervical dislocation and decapitation, whole brains were rapidly frozen in isopentane (−35°C, 10 s) and stored at −70°C until sectioning. Coronal sections (14 μM each) were obtained using an IEC (International Equipment Corp, Needham Heights, MA) or Leica CM 1850 cryostat/microtome (Nusslock, Germany) and thaw mounted onto SuperFrost slides (Fisher Scientific, Pittsburgh, PA). Nine sets of serial sections were obtained so that ligand binding and in situ hybridization could be performed in each mouse. Sections were desiccated and stored at −70°C until use.
2.4. In situ hybridation for β2 subunit mRNA
The distribution of β2 mRNA expression was determined using in situ hybridization with radiolabeled riboprobes as previously described (Marks et al., 1992). The β2 subunit probe was synthesized from HindIII linearized pSP65-49 using Sp6 RNA polymerase with α [35S]-UTP as the sole source of UTP. Tissue was fixed by immersion in 4% paraformaldehyde in phosphate buffered saline for 15 min, washed, acylated by incubation with acetic anhydride and dehydrated with an ethanol series before air drying and vacuum storage. β2 nAChR subunit probe (100 μL, 5 × 10⁶ cpm/ml) in hybridization solution (50% formamide, 10% dextran sulphate, 300mM NaCl, 10mM Tris, 1mM EDTA, 500 μg/mL yeast tRNA, 10mM DTT, 1X Denhardt’s solution, pH 8.0) was applied to each slide. Hybridization was performed at 58°C for 18 hrs. Following the hybridization, sections were washed 4 times in 4X SSC (1X SSC, NaCl, 150 mM: sodium citrate, 6 mM; pH = 7.0) incubated for 30 min with RNase A (20μg/mL), washed with 2X SSC/1mM DTT (three times), 1X SSC/1mM DTT and 0.5X SSC/1mM DTT to desalt the samples. Slides were then subjected to a high stringency wash with 0.1X SSC/1mM DTT at 60°C for 30 min. Following dehydration with an ethanol series, samples were exposed for 5 days Kodak BioMax film.
2.5. [125I]-mAb 270 Labeling
125I-mAb autoradiography was performed as previously detailed (Whiteaker et al., 2006). Sections were allowed to equilibrate to room temperature and then rehydrated for 15 min in PBS buffer (100mM NaCl and 10 mM NaPO4, pH 7.5). Sections were then incubated in humidified chambers at 4°C for 48 hours with 0.3 nM 125I-mAb 270 in PBS with 10 mM NaN3, 10% (v/v) normal rat serum, and 5% (w/v) protease-free bovine serum albumin. Sections were then washed 4 times in PBS for 30 min each at 22°C, air dried and desiccated overnight under vacuum prior to exposure to Kodak Biomax film for 5 days.
2.6. [125I]-Epibatidine autoradiography
[125I]-Epibatidine binding was conducted as previously described (Whiteaker et al., 2000a). Coronal sections were incubated in binding buffer (NaCl, 140 mM; KCl, 1.5 mM; CaCl2, 2 mM; MgSO4, 1 mM; bovine serum albumin, 1g/L; HEPES buffer, pH 7.5, 25 mM) containing 500 pM [125I]-epibatidine for 2 h at 22° C. Final specific activity of 110 Ci/mmol was obtained by diluting [125I]-epibatidine (2200 Ci/mmol) with unlabeled 6I-epibatidine. As [125I]-epibatidine binds with high affinity to multiple nAChR, differential inhibition with cytisine (50 nM) was used to distinguish between cytisine-sensitive and cytisine-resistant binding sites. Non-specific binding was determined using 100 μM (−) nicotine bitartrate. Following wash with ice-cold solutions twice with binding buffer (15 s each), twice with 0.1xbinding buffer (5 s each) and twice with 25 mM HEPES, pH=7.5 (5 s each)], sections were air dried and desiccated overnight under vacuum and subsequently exposed to Kodak BioMax for 5 days.
2.7. [125I]-α-CtxMII autoradiography
[125I]-α-CtxMII binding was performed as previously described (Whiteaker et al., 2000b). Sections were incubated in binding buffer for 10 min (as described in [125I]-epibatidine autoradiography) with minor modifications (the addition of 1 mM phenylmethylsulfonyl fluoride (PMSF) and deletion of bovine serum albumin). Sections were then incubated in 0.5 nM [125I]-α-CtxMII in binding buffer with the addition of the protease inhibitors leupeptin, pepstatin, and aprotinin (10 μg/ml each) for 2 h at 22° C. Slides were subsequently washed in ice-cold protein free binding buffer twice for 30 s followed by two 10 s washes in 0.1x protein free binding buffer. Final rinses (2 × 5 s each) were conducted in ice-cold 5 mM HEPES, pH 7.5. Sections were subsequently air dried and desiccated overnight prior to exposure to Kodak MR film for 5 days.
2.8. Quantitation of autoradiography
Following exposure to the Kodak BioMax film, each set of samples was exposed to Super Resolution Phosphor storage screens, Type SR (Perkin Elmer Life Sciences) for 2–4 days. Images were collected using a Packard Cyclone Phosphor Imaging system (Perkin Elmer Life Sciences). Tissue paste samples containing measured amounts of either 125I or 35S were included with each set of samples to establish standard curves. Signal intensity was quantified using OptiQuant software. A minimum of five measurements were recorded for each brain region analyzed for each animal and the mean of all measures for each region was used for further analysis. Nonspecific hybridization or binding was determined using sections from β2 knockout mice, which do not exhibit any detectable, specific radioactive signal. Regions were identified with reference to a mouse brain atlas (Franklin Keith B. J. and Paxinos, 1997).
2.9. Agonist-stimulated 86Rb+ efflux
Agonist-stimulated 86Rb+ efflux from crude preparations of thalamic and cortical synaptosomes of wildtype (WT), heterozygous (HT) and homozygous mutant (MT) mice were measured as previously described (Marks et al., 1999). Adult mice were killed by cervical dislocation and thalamus (Th) (excluding medial habenula) and cortex (Cx) were dissected on an ice-cold platform. Tissue was homogenized in 1 ml of ice cold 0.32 M sucrose solution buffered to pH 7.5 using 5 mM HEPES with a glass/Teflon tissue grinder. A crude synaptosomal pellet was obtained following centrifugation at 10,000 × g for 20 min at 4°C. Cortical and thalamic crude synaptosomal pellets were resuspended in 0.8 ml and 0.35 ml load buffer (in mM; 140 NaCl, 1.5 KCl, 2 CaCl2, 1 MgSO4, 25 HEPES, and 22 glucose, pH = 7.5), respectively, and maintained on ice until incubation with 86Rb+. Synaptosomes were incubated with 4 μCi 86Rb+ for 30 min at ambient temperature. To inhibit acetylcholinesterase activity, 10 μM diisopropyl fluorophosphate was added during the final 5 min of uptake. Uptake was terminated by filtration of the sample onto a 6 mm diameter glass fiber filter (Type AE; Pall Life Sciences, Port Washington, NY) under gentle vacuum (0.8 atmospheres) followed by one wash of 0.5 ml load buffer.
Filters containing the crude synaptosomes loaded with 86Rb+ were transferred to a polypropylene stage and superfused with buffer (in mM; 135 NaCl, 1.5 KCl, 5 CsCl, 2 CaCl2, 1 MgSO4, 25 HEPES, 22 glucose, 50 nM tetrodotoxin, 1 μM atropine, and 0.1% bovine serum albumin) via a peristaltic pump at a flow rate of 2 ml/min. A second peristaltic pump set at a 3 ml/min flow rate (to prevent pooling of buffer on the stages) pumped superfusate through a Cherenkov cell and into a β-Ram detector (Lab Logic, Brandon, FL). Radioactivity was evaluated for 3 min with a 3 s detection window for each superfusion. Crude synaptosomes were exposed to acetylcholine or nicotine for 5 sec to elicit nAChR mediated 86Rb+ efflux. Concentration effect curves were generated by varying the agonist concentrations.
To evaluate the effect of previous nicotine exposure (steady-state desensitization) on ACh-stimulated 86Rb+ efflux, thalamic and cortical samples were superfused for 8 min with buffer containing nicotine prior to a 5 s stimulation with ACh. WT crude synaptosomes were exposed to 0, 1, 3, 10, 30, or 100 nM nicotine. HT and MT samples were treated with 0, 0.1, 0.3, 1, 3, or 30 nM nicotine. After nicotine pre-exposure, all crude synaptosomes were exposed to 10 μM ACh for 5 s.
2.10. [125I]-Epibatidine binding to membrane fragments
Besides measuring receptor expression in intact mouse brain sections using [125I]-epibatidine binding, we also used [125I]-epibatidine binding to measure nAChR expression in the synaptosomal membranes. [125I]-Epibatidine binding followed previously published methods (Whiteaker et al., 2000a). Frozen, washed pellets were resuspended in hypotonic buffer and centrifuged at 20,000 × g for 20 min. The resulting pellets were then resuspended in ice-cold water, with volume adjusted such that <10% of the [125I]-epibatidine was bound to the protein at the highest ligand concentration. Samples were incubated for 3 h at ambient temperature in 96-well polystyrene plates at a final volume of 30 μl of binding buffer containing 400 pM 125I-epibatidine. Following incubation, samples were diluted with 200 μl ice-cold wash buffer. The diluted samples were then filtered through glass fiber filters (top-MFS type B; bottom- Gelman A/E) treated with 0.5% polyethelenimine under 0.2-atmosphere vacuum using a Inotech Cell Harvester (Inotech Systems, Rockville, MD) and washed with ice-cold buffer five times. Sample radioactivity was measured at 80% efficiency by a Packard Cobra Auto Gamma Counter (Packard Instruments, Downers Grove, IL). Total protein concentration was determined using the method of Lowry utilizing bovine serum albumin standards (Lowry et al., 1951).
2.11. [3H]-Dopamine uptake and release
[3H]-Dopamine release was measured as previously described (Salminen et al., 2007; Salminen et al., 2004). For uptake of [3H]-dopamine, crude synaptosomes were incubated at 37° in uptake buffer (containing the following, in mM, 128 NaCl, 2.4 KCl, 3.2 CaCl2, 1.2 KH2PO4, 1.2 MgSO4, 25 HEPES, pH 7.5, 10 glucose, 1 ascorbic acid, and 0.01 pargyline) for 10 min before addition of 100 nM [3H]-dopamine (1 μCi for every 0.2 ml of synaptosomes) and diisopropyl fluorophosphate (10 μM), and the suspension was incubated for an additional 5 min. Aliquots of crude synaptosomes (80 μl) were distributed onto filters and superfused with buffer (uptake buffer containing 0.1% bovine serum albumin, 1 μM nomifensine and 1 μM atropine) at 0.7 ml/min for 10 min. For experiments using α-conotoxin MII (α-CtxMII) to inhibit the α6β2*-nAChR, crude synaptosomes were exposed to α-CtxMII (50 nM) for the last 5 min of the 10 min buffer superfusion. This concentration of α-CtxMII inhibits all α6β2*-nAChR subtypes present in the mouse striatum (Salminen et al., 2007). After buffer and/or α-CtxMII superfusion, crude synaptosomes were exposed to ACh for 20s. Basal and ACh-stimulated release was determined by collecting 23 10-s fractions into 96-well plates.
2.12. [3H]-GABA uptake and release
Uptake is similar to [3H]-dopamine, as described above, with modifications (Lu et al., 1998; McClure-Begley et al., 2009). Ascorbate and pargyline were omitted from the uptake buffer and 1.25 mM aminooxyacetic acid was added. A 16 s exposure to ACh or 20 mM K+ followed incubation with [3H]-GABA (8 μCi in 0.8 ml). Superfusion buffer without nomifensine and containing NO-711 (100 nM) was used. Samples were processed as described in DA release above.
2.13. Evaluation of nicotine sensitivity in β2VL mice
All nicotine doses are expressed as free base. Behavioral test measures were selected based on previous studies (Marks et al., 1985; Tritto et al., 2004). Mice were habituated to the experimental room for one h prior to testing. Following the acclimation period, mice received a single intraperitoneal injection of nicotine (WT 0.0, 0.25, 0.50, 1.0, or 1.5 mg/kg; HT and MT 0.0, 0.125, 0.25, 0.50 or 1.0 mg/kg). Mice were placed in a Y-maze apparatus 3 min after nicotine injection and assessed thereafter for 3 min. Immediately following Y-maze assessment, mice were placed in a bright light open field and assessed for 5 min. Following completion of the open field test, mice were singly-housed in a cage until temperature was measured fifteen min post injection.
2.14. Electroencephalographic (EEG) recordings
Electrode-implant surgeries and EEG recordings were performed as described (Fonck et al., 2005). Mice were implanted with cortical screw electrodes seven days before the start of experiments. General anesthesia was induced with a ketamine (98 mg/kg)/xylazine (10 mg/kg) mixture delivered intraperitoneally. Bilateral screw electrodes were stereotactically inserted in the parietal cortex or the primary motor cortex, with a third electrode serving as ground. Stereotactic coordinates are expressed in millimeters, with the first number indicating anterior-posterior placement from Bregma and the second number representing lateral placement from midline: 2 ± 1.7 for primary motor cortex M1 and 0.8 ± 1.2 for primary somatosensory cortex. Simultaneous video and EEG recordings started 15 min before and continued for 15 min after a single nicotine injection (5 mg/kg, i.p.). Data were acquired with a differential amplifier (Brownlee Precision, San Jose, CA), with a 1 kHz sampling rate and band-pass filtered a 1–200 Hz. EEG data were analyzed with Clampfit 8.2 software (Molecular Devices, Sunnyvale, CA). All EEG traces were examined for evidence of spike-wave, interictal spikes, or other wave forms demonstrating ictal activity.
2.15. Dystonic arousal complex (DAC) assay
Mice were moved into the test room and weighed 24 h prior to the experiment. To test for DAC-related behaviors, β2VL MT and WT mice were injected with 2 mg/kg of nicotine (i.p.). After the injections, the mice were placed in an elevated rectangular platform (30 × 43 cm, 1.3 m above the floor) covered with white countertop paper and video recorded for 5 min. Nineteen homozygous β2VL MT mice and an equal number of WT littermates were used. The mice were age-matched, 2–5 month-old males. The DAC encompasses a number of stereotypic behaviors including (1) jerky, darting head and body movements, (2) forelimb dystonia (tonic forelimb extension and tonic digit splaying), and (3) diagonal retrograde tail (Straub tail) (Teper et al., 2007). In the current study, WT and β2VL MT mice were scored for diagonal retrograde tail, tonic forelimb extension, tonic splaying of the forelimb digits, as well as for forelimb clonus. Diagonal retrograde tail was defined as a bending of the tail > 135° from its natural horizontal position (Teper et al., 2007). The mice were not scored for jerky, darting movements because this behavior was less well defined than the other behaviors. All scoring was done by an observer blinded to genotype.
2.16. Data analysis
The SPSS statistical package was used for all ANOVAs. The non-linear least squares curve fitting program in SigmaPlot was used to fit dose-response relations for behavioral data or concentration-effect relations for biochemical data. The Fisher exact test was used to test DAC data for significant differences between the occurrence of the behaviors in MT and WT mice.
Autoradiographic data were initially measured as signal density (pixels/mm2) from images collected using the Packard Cyclone Storage Phosphor Screen analyzer and subsequently converted to cpm/mg tissue using the standard curves for either 125I or 35S included on each phosphor screen. For ligands with known specific activity, signals densities were converted to fmol/mg tissue. Results were subsequently analyzed by two-way ANOVA with genotype and brain region as the independent variables. The effect of genotype on signal intensity within each brain region was subsequently examined by one-way ANOVA. Where appropriate, Dunnett’s post hoc test was applied.
The effect of genotype on concentration-response relations measured by 86Rb+ efflux was evaluated by curve-fitting data to a model with two Michaelis-Menten equations to calculate the components with higher sensitivity (HS) and lower sensitivity (LS) to activation by ACh as follows:
where V is the total 86Rb+ efflux measured at each [ACh], Vmax,HS and Vmax,LS are the estimated maximal responses elicited by the HS and LS components, respectively, with EC50 values ([ACh] eliciting half maximal efflux) of EC50,HS and EC50,LS, for the HS and LS components, respectively. Kinetic parameters were subsequently analyzed using one-way ANOVA followed by Dunnett’s post hoc test.
The concentration-response relations for ACh-stimulated neurotransmitter release ([3H]dopamine and [3H]GABA) and nicotine-stimulated 86Rb+ efflux were adequately fit using the Michaelis-Menten equation:
Where V is the agonist-stimulated neurotransmitter release at each [Ag], Vmax is the estimated maximal release and EC50 the concentration of ACh eliciting half-maximal response. The effects of genotype on Vmax and EC50 were subsequently analyzed using one-way ANOVA followed by Dunnett’s post hoc test.
The effects of the β2VL genotype on ACh-stimulated response were analyzed two ways: 1) Two-way ANOVAs examining the effect of ACh concentration and β2 genotype and 2) least squares curve fitting of the data to calculate the Emax and EC50.
The parameters for the curves for the steady-state desensitization of ACh-stimulated 86Rb+ efflux by prior exposure to nicotine were calculated using the following equation:
where Vnic is the efflux measured after exposure to each nicotine concentration, [nic], Vinh is the maximum efflux inhibited by exposure to nicotine, DC50 is the apparent concentration of nicotine eliciting 50% desensitization, and Vrem is the efflux insensitive to inhibition.
The locomotor activity and body temperature data were analyzed using two-way ANOVA with genotype and nicotine dose as the independent variables. Subsequently one-way ANOVA was used to compare the responses of mice varying in β2 genotype at each nicotine dose. Results of the locomotor activity and hypothermia measures were also subjected to least squares curve fitting using the following general equation to provide an estimate of the effect of genotype on the EC50 for nicotine:
where the behavioral response is either the activity or temperature measured at each nicotine dose, (nic), and the ED50 is the nicotine dose eliciting a 50% reduction in response. The baseline response was measured following saline injection. For hypothermia, this equation was modified to include a residual value for the calculation of ED−2° (dose to elicit a temperature decrease of 2°C) to reflect the fact that a maximal temperature of 6° C is achieved for HT and MT mice and of 4°C for WT mice.
3. Results and Discussion
3.1. Autoradiographic analysis of the expression of β2 mRNA, β2 protein, and ligand binding sites
3.1.1. Autoradiographic illustration of the results of the β2VL mutation
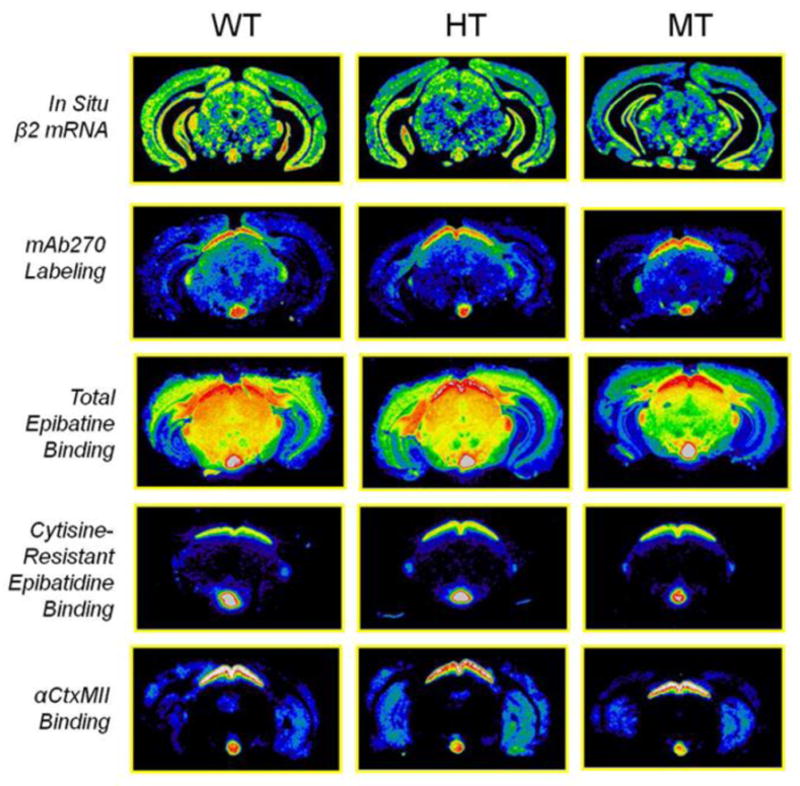
The autoradiograms shown in Figure 1 (for rows one through four, at the level of the thalamus, approximately −2.1 Bregma; for the fifth row, at the level of the striatum, approximately +0.02 Bregma) and Figure 2 (at the level of the IPN, approximately −3.3 Bregma) compare the in situ hybridization for 35S labeled β2 mRNA (first row in each figure), [125I]-mAb270 labeling for β2 protein (second row), total binding for [125I]-epibatidine (third row), cytisine-resistant [125I]-epibatidine binding (fourth row), and [125I]-αCtxMII binding (fifth and final row) for WT, HT and MT β2VL mice.
Figure 1. Genotype comparisons of the expression and agonist binding of receptors at the level of the thalamus or striatum.

Representative pseudocolor images for WT, HT and MT compare the effect of the β2VL mutation at the level of the thalamus (approximately −1.6 mm Bregma) on mRNA levels of β2 (row 1), mAb 270 labeling (row 2), total epibatidine binding sites (row 3), and cytisine-resistant epibatidine binding (row 4), as well as on α-CtxMII binding in the level of the striatum (approximately +1.0 mm Bregma) (row 5).
Figure 2. Genotype comparisons of the expression and agonist binding of receptors at the level of the IPN.
Representative pseudocolor images for WT, HT and MT mice compare the effect of the β2VL mutation at the level of the superior colliculus (approximately −3.5 mm Bregma) on mRNA levels of β2 (row 1), mAb 270 labeling (row 2), total epibatidine binding (row 3), cytisine-resistant epibatidine binding (row 4), and α-CtxMII binding (row 5.)
3.1.2. No significant changes in β2 mRNA expression were observed as a result of the β2VL mutation
3.1.2a. β2 mRNA expression-Results
We measured expression of β2 mRNA by in situ hybridization with quantitative autoradiography. Fifteen brain regions were quantitated from 4 mice of each genotype. Signal intensity is summarized in Table 1. The expression of β2 mRNA differed among the brain regions (F14,135 = 77.2, p<0.001). Very high signal was noted in medial habenula, with relatively high signals observed in the interpeduncular nucleus, thalamus and dorsolateral geniculate nucleus. Cortical regions, olfactory tubercles and striatum displayed lower hybridization. No significant differences were seen across genotype (F2,135 = 1.81, p>0.05) for β2 subunit mRNA: average signal intensity was 107% of control for HT mice and 99% of control for MT mice (Figure 3a).
Table 1.
In situ hybridization for β2 mRNA by brain region and genotype
| Brain Region | WT cpm/mg wet wt | HT cpm/mg wet wt | MT cpm/mg wet wt | ANOVA Results |
|---|---|---|---|---|
| Cortex | 1081 ± 30 | 1168 ± 23 | 1105 ± 102 | F2,9= 0.51, p=0.62 |
| Frontal cortex | 932 ± 44 | 1067 ± 24 | 1002 ± 40 | F2,9= 3.33, p=0.08 |
| Olfactory bulbs | 1262 ± 65 | 1569 ± 98 | 1255 ± 735 | F2,9=0.17, p=0.84 |
| Interpeduncular nucleus | 2097 ± 149 | 2136 ± 86 | 2008 ± 449 | F2,9= 0.05, p=0.94 |
| Medial habenula | 7654 ± 1012 | 6764 ± 712 | 6015 ± 735 | F2,9= 0.97, p=0.41 |
| Olfactory tubercles | 805 ± 42 | 937 ± 44 | 1004 ± 64 | F2,9= 3.94, p=0.06 |
| Striatum | 692 ± 44 | 756 ± 29 | 784 ± 60 | F2,9=1.05, p=0.39 |
| Dorsolateral geniculate | 2406 ± 350 | 2737 ± 110 | 2374 ± 221 | F2,9= 0.66, p=0.54 |
| Medial geniculate | 1871 ± 179 | 2065 ± 66 | 1671 ± 164 | F2,9=1.84, p=0.21 |
| Superior colliculus | 1535 ± 174 | 1707 ± 39 | 1710 ± 234 | F2,9= 0.34, p=0.72 |
| Inferior colliculus, dorsal cortex | 1717 ± 81 | 1625 ± 58 | 1547 ± 176 | F2,9= 0.53, p=0.61 |
| Thalamus | 2079 ± 149 | 2376 ± 104 | 1882 ± 197 | F2,9=2.58, p=0.13 |
| Thalamus, anteroventral nucleus | 2571 ± 156 | 2733 ± 118 | 2445 ± 303 | F2,9= 0.48, p=0.63 |
| Ventral tegmental area | 2209 ± 116 | 2208 ± 45 | 2465 ± 368 | F2,9= 0.44, p=0.66 |
| Substantia nigra | 1781 ± 46 | 1707 ± 138 | 1397 ± 108 | F2,9=3.79, p=0.06 |
Data show in situ hybridization for [35S] β2 cRNA in mouse brain regions of all three β2VL genotypes. Hybridization was performed as described in the methods section. Specific hybridization was quantitated utilizing standards of known activity and is represented in terms of cpm/mg wet wt. Values are the mean ± SEM measured in four different mice.
Figure 3. Summary of changes in autoradiography data.
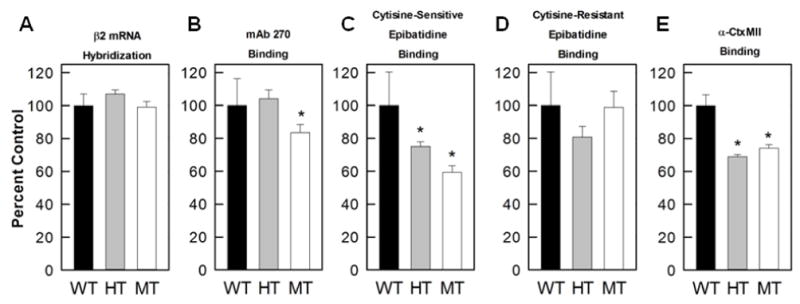
Histograms present the overall effect of the β2VL mutation. Results have been normalized to the binding measured for WT mice in each region (set to 100% for the individual regions) and represent the mean ± SEM of the data for all brain regions listed in Tables 1–5. The mutation did not alter β2 mRNA levels a), β2 protein levels measured by mAb270 were significantly decreased in MT mice b), cytisine-sensitive epibatidine binding was significantly decreased in both HT and MT mice (primarily representative of α4β2*-nAChR) c), cytisine-resistant epibatidine binding was not significantly altered by the mutation d), and α-CtxMII binding was significantly decreased in both HT and MT mice e).
3.1.2b. β2 mRNA expression-Discussion
The β2VL mutation did not affect mRNA encoding the β2 subunit measured by in situ hybridization. Our observation is consistent with the lack of effect of this mutation on β2 mRNA expression measured with rtPCR (Xu et al., 2011) Retention of mRNA expression for this single-point contrasts with the gene-dose dependent decrease in expression that occurs following deletion of the β2 nAChR gene (Picciotto et al., 1995; Whiteaker et al., 2006). β2 mRNA expression is also altered by the introduction of multiple copies of the β2VL gene in transgenic mice, in which differential expression of the mutant transgene was observed among the three lines that were generated (Manfredi et al., 2009). These observations indicate that number of copies of a gene can change mRNA expression, but single-point mutations within the gene do not.
3.1.3. Overall [125I]-mAb270 binding is decreased as a result of the β2VL mutation
3.1.3a. [125I]-mAb270 binding-Results
We then measured β2*-nAChR subunit protein by binding of the β2-selective monoclonal antibody, [125I]-mAb 270 (Whiteaker et al., 2006; Whiting and Lindstrom, 1987) autoradiographically (Swanson et al., 1987; Whiteaker et al., 2006). The effects of the β2VL mutation on sixteen regions were quantitated from 4 mice of each genotype. Binding of [125I]-mAb 270 varied significantly among brain regions (F15,144=41.44, p<0.001). IPN had the highest level of [125I]-mAb 270 binding. High binding was also measured in the geniculate nuclei, superior colliculus and thalamus. Relatively lower binding was observed in olfactory bulbs, cortex, olfactory tubercles, and inferior colliculus. An overall significant main effect of genotype on [125I]-mAb 270 binding was also detected (F2,144=7.12, p<0.01): the β2VL mutation decreased β2 receptor protein levels. Overall the decrease was confined to MT mice (Figure 3b, average binding 84% of control) with no change observed for HT mice (104% of control). Subsequent one-way ANOVA analysis was performed on 16 regions, the results of which are shown in Table 2. While genotype had a significant effect overall, when analyzed by region [125I]-mAb 270 binding levels were decreased only in MT medial geniculate as compared to WT mice (F2,9=5.088, p<0.05).
Table 2.
β2 protein expression by region and genotype using mAb 270
| Brain Region | WT fmol/mg wet wt | HT fmol/mg wet wt | MT fmol/mg wet wt | ANOVA Results |
|---|---|---|---|---|
| Cortex | 1.02 ± 0.29 | 0.78 ± 0.18 | 0.56 ± 0.31 | F2,9=0.75. p=0.50 |
| Frontal cortex | 1.38 ± 0.20 | 1.05 ± 0.20 | 0.86 ± 0.26 | F2,9=1.47, p=0.28 |
| Olfactory bulbs | 0.66 ± 0.16 | 0.43 ± 0.16 | 0.49 ± 0.08 | F2,9=0.74, p=0.50 |
| Interpeduncular nucleus | 4.56 ± 0.69 | 4.80 ± 0.33 | 4.07 ± 0.78 | F2,9=0.35, p=0.72 |
| Olfactory tubercles | 0.76 ± 0.20 | 0.78 ± 0.20 | 0.46 ± 0.12 | F2,9=1.02, p=0.40 |
| Striatum | 1.65 ± 0.23 | 1.50 ± 0.20 | 1.27 ± 0.21 | F2,9=0.80, p=0.48 |
| Medial geniculate | 2.82 ± 0.18 | 3.40 ± 0.22 | 2.32 ± 0.30 | F2,9=5.09, p=0.03* |
| Dorsolateral geniculate | 4.77 ± 0.59 | 4.63 ± 0.33 | 3.50 ± 0.61 | F2,9=1.76, p=0.23 |
| Ventrolateral geniculate | 3.72 ± 0.22 | 4.15 ± 0.33 | 3.24 ± 0.33 | F2,9=2.36, p=0.15 |
| Superior colliculus, optic nerve layer | 3.00 ± 0.46 | 3.84 ± 0.39 | 3.42 ± 0.68 | F2,9=0.10, p=0.90 |
| Superior colliculus, superficial gray | 3.72 ± 0.54 | 4.90 ± 0.54 | 4.32 ± 0.78 | F2,9=0.88, p=0.45 |
| Inferior colliculus, dorsal cortex | 1.11 ± 0.15 | 1.56 ± 0.32 | 1.37 ± 0.46 | F2,9=0.43, p=0.67 |
| Thalamus | 2.49 ± 0.36 | 2.93 ± 0.21 | 2.29 ± 0.33 | F2,9=1.20, p=0.35 |
| Thalamus, anteroventral nucleus | 2.82 ± 0.26 | 2.95 ± 0.12 | 2.06 ± 0.37 | F2,9=3.17, p=0.09 |
| Trigeminal nucleus | 1.91 ± 0.45 | 1.75 ± 0.12 | 1.45 ± 0.23 | F2,9=0.60, p=0.57 |
| Medial ventricular nucleus | 1.03 ± 0.25 | 1.07 ± 0.20 | 0.87 ± 0.15 | F2,9=0.27, p=0.77 |
β2 nAChR subunit protein levels were measured with binding of [125I]-mAb 270 as described in Methods. Binding was quantitated using [125I]-standards of known activity and expressed as fmol/mg wet wt based on specific activity of the [125I]-mAb 270. Results are the mean ± SEM from four individual mice per genotype. Regions with significant differences by one-way ANOVA are shown in bold type.
3.1.3b. [125I]-mAb270 binding-Discussion
This modest decrease in subunit expression as a consequence of the β2VL mutation contrasts with the gene-dose dependent decrease observed following deletion of the β2 subunit (Picciotto et al., 1995; Whiteaker et al., 2006). However, β2 nAChR subunit protein levels were higher in mice expressing multiple copies of the β2 V289L transgene and this increase in protein reflected the increase in mRNA among the lines (Manfredi et al., 2009). However, the increase in β2 nAChR subunit protein was not accompanied by a parallel increase in α4 nAChR subunit protein, indicating that the elevated expression of β2 nAChR protein does not markedly affect expression of the primary partner for the assembly of nAChR in the brain.
3.1.4. Overall [125I]-epibatidine binding is decreased as a result of the β2VL mutation
3.1.4a. Cytisine-sensitive [125I]-epibatidine binding-Results
We then assessed [125I]-epibatidine binding autoradiographically to evaluate the effects of the β2VL mutation on ligand binding to nAChR. We measured total high-affinity [125I]-epibatidine binding and [125I]-epibatidine binding in the presence of 50 nM cytisine (cytisine-resistant). This concentration of cytisine has been previously shown to inhibit radiolabeled epibatidine binding primarily to α4β2*-nAChR sites (Baddick and Marks, 2011; Champtiaux et al., 2002; Marks et al., 2007) Therefore, cytisine-sensitive binding is a measure primarily of α4β2*-nAChR, and is either the total binding in regions with no measurable cytisine-resistant binding (discussed below), or the difference between total and cytisine-resistant binding (non-α4β2*-nAChR including α6β2*-, α3β2*- and α3β4*-nAChR).
We quantitated 21 regions from 4 mice of each genotype for cytisine-sensitive binding (Table 3). Cytisine-sensitive [125I]-epibatidine binding varied significantly among the brain regions (F20,180 =23.84, p<0.001). Similar to the pattern observed for [125I]-mAb 270 binding, IPN had the highest level of cytisine-sensitive [125I]-epibatidine binding with high binding also measured in the geniculate nuclei, superior colliculus and thalamus. Binding was relatively lower in cortex, olfactory tubercles, striatum, inferior colliculus and hippocampus. A significant main effect of genotype was also noted (F2,189 = 9.63, p<0.001). As shown in Figure 3c, overall (excluding IPN and medial habenula) binding in HT mice was 77% of control and in MT mice was 53% of control. Although [125I]-epibatidine binding in HT and MT mice tends to be lower than binding in WT, only four regions, two thalamic areas, the ventral tegmental nucleus, and the hypothalamus were statistically different from WT by one-way ANOVA.
Table 3.
Cytisine-sensitive [125I]-epibatidine binding by region and genotype
| Brain Region | WT fmol/mg wet wt | HT fmol/mg wet wt | MT fmol/mg wet wt | ANOVA Results |
|---|---|---|---|---|
| Cortex, inner layers | 28.30 ± 4.77 | 23.40 ± 2.79 | 17.60 ± 3.62 | F2,9= 1.96, p= 0.20 |
| Cortex, outer layers | 14.23 ± 4.20 | 10.15 ± 1.10 | 10.40 ± 3.40 | F2,9= 0.52, p= 0.61 |
| Frontal cortex | 29.19 ± 4.93 | 24.62 ± 3.64 | 18.77 ± 4.91 | F2,9= 1.32, p= 0.31 |
| Interpeduncular nucleus | 165.80 ± 17.30 | 198.90 ± 72.90 | 199.90 ± 3.50 | F2,9= 0.20, p=0.82 |
| Medial habenula | 88.90 ± 11.40 | 136.20 ± 23.9 | 85.00 ± 35.2 | F2,9=1.26, p=0.33 |
| Olfactory tubercles | 21.80 ± 5.30 | 14.20 ± 1.40 | 20.50 ± 7.40 | F2,9= 0.58, p=0.58 |
| Striatum | 33.19 ± 6.50 | 27.40 ± 3.60 | 26.20 ± 6.40 | F2,9=0.44, p=0.66 |
| Dorsolateral geniculate | 133.57 ± 32.52 | 90.30 ± 9.04 | 90.12 ± 23.00 | F2,9=1.14, p=0.36 |
| Ventrolateral geniculate | 119.00 ± 25.10 | 107.00 ± 24.30 | 91.20 ± 19.40 | F2,9=0.37, p=0.70 |
| Superior colliculus, optic nerve layer | 75.00 ± 11.50 | 64.60 ± 12.40 | 53.60 ± 6.60 | F2,9=1.04, p=0.39 |
| Superior colliculus, superficial gray | 97.07 ± 22.71 | 67.15 ± 13.25 | 52.70 ± 8.27 | F2,9=2.05, p=0.18 |
| Inferior colliculus, dorsal cortex | 32.80 ± 4.40 | 28.20 ± 6.70 | 20.30 ± 7.70 | F2,9= 0.97, p= 0.42 |
| Thalamus, ventroposterior nucleus | 88.95 ± 10.18 | 75.87 ± 9.01 | 40.33 ± 6.99 | F2,9= 8.12, p=0.01 ** |
| Thalamus, anteroventral nucleus | 129.13 ± 42.51 | 66.80 ± 9.74 | 35.76 ± 3.06 | F2,9=3.57, p=0.07 |
| Thalamus, lateroposterior nucleus | 104.87 ± 15.52 | 77.75 ± 7.39 | 49.88 ± 5.38 | F2,9= 7.00, p=0.01 ** |
| Ventral tegmental area | 54.10 ± 8.70 | 52.90 ± 8.10 | 42.20 ± 8.40 | F2,9=0.61, p=0.57 |
| Substantia nigra | 50.00 ± 9.70 | 39.00 ± 4.90 | 33.80 ± 6.30 | F2,9=1.30, p=0.32 |
| Hypothalamus | 18.70 ± 3.80 | 12.50 ± 1.90 | 6.90 ± 0.90 | F2,9= 5.54, p=0.03 * |
| Globus pallidus | 30.40 ± 9.20 | 18.70 ± 4.60 | 11.30 ± 2.70 | F2,9=2.46, p=0.14 |
| Hippocampus | 17.40 ± 5.70 | 10.60 ± 3.60 | 7.70 ± 3.90 | F2,9=1.23, p=0.34 |
| Ventral tegmental geniculate | 43.33 ± 9.40 | 28.73 ± 4.62 | 17.00 ± 2.94 | F2,9=4.42, p= 0.05* |
Cytisine-sensitive [125I] epibatidine binding (as a measure of α4β2-nAChR sites) was quantitated using [125I]-standards of known activity and expressed as fmol/mg wet wt based on specific activity of the [125I]-epibatidine. Results are the mean ± SEM of binding from four individual mice per genotype. Regions with significant differences by one-way ANOVA are shown in bold type.
3.1.4b. Cytisine-sensitive [125I]-epibatidine binding-Discussion
Reduction in binding site density following introduction of gain of function mutations has also been noted for mice harboring the nAChR α4L9’S (Fonck et al., 2003), α4L9’A (Fonck et al., 2005) and α4S248F (Teper et al., 2007) mutations. This pattern of steady-state receptor expression is consistent with a downregulation in response to constant activation by low levels of endogenous ACh that serves to reduce the impact of hyperactive receptors. The reduction in ligand binding could also have resulted in the death of neurons harboring the mutation. However, the observations that the MT mice expressed normal levels of β2 mRNA and showed no obvious anatomical changes indicate that extensive cell death is unlikely.
3.1.4c. Cytisine-resistant [125I]-epibatidine binding-Results
Cytisine-resistant [125I]-epibatidine binding was measured in nine regions (Table 4). In the presence of cytisine, a diverse set of [125I]-epibatidine binding sites is labeled (Baddick and Marks, 2011). This population in the IPN, medial habenula and inferior colliculus contains primarily α3β4*-nAChR sites, while in the remaining regions a fraction of this binding is due to α6β2*-nAChR sites. Binding in interpeduncular nucleus and medial habenula is much higher than that in any other region and this is reflected by the significant main effect of brain region (F6,63 = 27.19, p<0.001). No overall effect of genotype was detected (F2,63 = 1.28, p>0.05). As shown in Figure 3d, in the three regions where the α3β4*-nAChR subtype is predominant, binding in the HT mice was 93% of control and that of MT mice was 117% of control. No individual brain region displayed significantly changed cytisine-resistant [125I]-epibatidine binding as a result of the β2VL mutation (One-way ANOVA).
Table 4.
Cytisine-resistant [125I]-epibatidine binding by region and genotype
| Brain Region | WT fmol/mg wet wt | HT fmol/mg wet wt | MT fmol/mg wet wt | ANOVA Results |
|---|---|---|---|---|
| Interpeduncular nucleus | 268.00 ± 55.00 | 242.00 ± 29.00 | 251.00 ± 82.00 | F2,9=0.05, p= 0.95 |
| Medial hahenula | 275.00 ± 38.00 | 248.00 ± 25.00 | 322.00 ± 66.00 | F2,9= 0.65, p=0.54 |
| Striatum | 1.76 ± 0.55 | 1.45 ± 0.22 | 1.36 ± 0.60 | F2,9=0.19, p=0.83 |
| Dorsolateral geniculate | 18.00 ± 5.30 | 12.50 ± 2.10 | 11.90 ± 2.40 | F2,9=0.89, p= 0.45 |
| Superior colliculus, optic nerve layer | 16.22 ± 5.30 | 9.42 ± 0.98 | 9.95 ± 1.95 | F2,9=1.30, p=0.32 |
| Superior colliculus, superficial gray | 18.28 ± 1.98 | 21.00 ± 3.00 | 25.70 ± 4.20 | F2,9= 1.38, p= 0.30 |
| Inferior colliculus, dorsal cortex | 13.40 ± 1.20 | 13.20 ± 1.40 | 18.80 ± 4.70 | F2,9= 1.19, p= 0.35 |
| Ventral tegmental area | 3.90 ± 0.60 | 2.50 ± 0.70 | 3.80 ± 1.20 | F2,9= 0.80, p= 0.48 |
| Substantia nigra | 3.90 ± 0.80 | 2.30 ± 1.00 | 3.80 ± 0.70 | F2,9=1.13, p= 0.36 |
Cytisine-resistant [125I] epibatadine binding (primarily α3β4*-nAChR sites) was quantitated using [125I]-standards of known activity and expressed as fmol/mg wet wt based on specific activity of the [125I]-epibatidine. Results are the mean ± SEM of binding from four individual mice per genotype.
3.1.4d. Cytisine-resistant [125I]-epibatidine binding-Discussion
As cytisine-resistant [125I]-epibatidine binding primarily measures α3β4*-nAChR sites, (Baddick and Marks, 2011; Marubio et al., 1999; Zoli et al., 1998) it is not surprising this measure was unaffected by the β2VL mutation.
3.1.5. [125I]-α-CtxMII binding is decreased as a result of the β2VL mutation
We also assessed the effect of the β2VL mutation on α6β2*-nAChR and α3β2*-nAChR sites autoradiographically by measuring [125I]-α-CtxMII binding (Champtiaux et al., 2002; Whiteaker et al., 2002).
3.1.5a. [125I]-α-CtxMII binding-Results
Eleven regions were quantitated, with data shown in Table 5. There was a significant main effect of brain region (F10,99 = 444.7, p<0.001) reflecting the 5-fold difference in binding among the brain regions. Dorsolateral and ventrolateral geniculate nuclei and superior colliculus had the highest binding site density, while olfactory tubercles, ventral tegmental area and substantia nigra had the lowest density. It should be noted that, while [125I]-α-CtxMII binding sites are primarily α6β2*-nAChR, binding in IPN and medial habenula corresponds largely to α3β2*-nAChR sites (Whiteaker et al., 2002). Variation in the β2VL genotype significantly affected the number of [125I]-α-CtxMII binding sites revealed by the highly significant main effect of genotype (F2,99 =250.5, p<0.001). The genotype effect was noted for regions in which the α6β2*-nAChR sites predominate (Figure 3e, binding for HT mice was 69% of control and for MT mice was 75% of control) as well as for the regions in which the α3β2*-nAChR sites predominate (binding for HT mice was 74% of control and for MT mice was 71% of control). However, the significant brain region by genotype interaction (F20,99 = 7.28, p<0.001) indicates that the effect of β2VL genotype differed among the brain regions. Subsequent one-way ANOVAs revealed that binding in the VTA and SN did not significantly differ among the genotypes, while that in OT and onl of SC just failed to achieve significance. The remaining seven regions showed statistically significant decreases in [125I]-α-CtxMII binding sites.
Table 5.
Quantitation of α-CtxMII-sensitive binding in eleven brain regions.
| Brain Region | WT fmol/mg wet wt | HT fmol/mg wet wt | MT fmol/mg wet wt | ANOVA Results |
|---|---|---|---|---|
| Nucleus Accumbens | 2.11 ± 0.08 | 1.34 ± 0.12 | 1.64 ± 0.03 | F2,8=23.94, p=0.000*** |
| Olfactory tubercles | 0.98 ± 0.09 | 0.63 ± 0.09 | 0.67 ± 0.08 | F2,7=4.38, p=0.06 |
| Striatum | 1.72 ± 0.07 | 1.12 ± 0.09 | 1.26 ± 0.05 | F2,8=22.34, p=0.001*** |
| Interpeduncular nucleus | 2.69 ± 0.11 | 2.14 ± 0.15 | 1.86 ± 0.25 | F2,7=6.78, p=0.02* |
| Medial habenula | 2.35 ± 0.21 | 1.59 ± 0.17 | 1.69 ± 0.12 | F2,8=5.97, p=0.03* |
| Dorsolateral geniculate | 4.11 ± 0.27 | 2.82 ± 0.18 | 2.77 ± 0.16 | F2,8=13.05, p=0.003** |
| Ventrolateral geniculate | 4.13 ± 0.33 | 2.97 ± 0.17 | 2.91 ± 0.15 | F2,8=8.38, p=0.011* |
| Superior colliculus, optic nerve layer | 2.94 ± 0.28 | 2.01 ± 0.23 | 2.16 ± 0.21 | F2,8=3.99, p=0.06 |
| Superior colliculus, superficial gray | 3.95 ± 0.17 | 2.98 ± 0.37 | 2.99 ± 0.05 | F2,8=7.966, p=0.01* |
| Ventral tegmental area | 0.97 ± 0.08 | 0.64 ± 0.07 | 0.78 ± 0.11 | F2,8=2.82, p=0.12 |
| Substantia nigra | 0.78 ± 0.04 | 0.56 ± 0.03 | 0.67 ± 0.09 | F2,8=2.73, p=0.13 |
The effect of the β2VL mutation on α6β2*-nAChR and α3β2*-nAChR sites was measured autoradiographically using [125I]-α-CtxMII binding which was quantitated using [125I]-standards of known activity and expressed as fmol/mg wet wt based on specific activity of the [125I]-α-CtxMII. Results are the mean ± SEM of binding levels from four individual mice per genotype. Regions with significant differences by one-way ANOVA are shown in bold type.
3.1.5b. [125I]-α-CtxMII binding-Discussion
Introduction of the β2VL mutation caused widespread reduction in [125I]-α-CtxMII binding. However, in contrast to the gene-dose dependent reduction of binding observed for cytisine-sensitive [125I]-epibatidine binding, the [125I]-α-CtxMII binding in MT mice (25% reduction) was comparable to that in HT mice (31% reduction). This pattern was observed for the α3β2*-nAChR sites in medial habenula and interpeduncular nucleus as well as the α6β2*-nAChR sites in the rest of the brain (visual pathways and catecholaminergic sites). Although mRNA encoding the α6* subunit is densely expressed in DA neuronal soma regions in the ventral tegmental area and substantia nigra pars compacta, the density of α6*-nAChR in these regions is relatively small. More α6*-nAChR are found in the DA terminal regions, including the nucleus accumbens and striatum, which may explain why differences are detected in the nucleus accumbens but not in the ventral tegmental area or substantia nigra (Champtiaux et al., 2003). It should be noted that the α6β2*-nAChR binding sites are complex and include α6α4(β2)2β3-, (α6)2(β2)2β3- and perhaps some (α6)2(β2)3-nAChR subtypes (Gotti et al., 2005; Grady et al., 2007). The effects of the β2VL mutation on these diverse subtypes, individually, are unknown.
3.2. Effect of β2VL genotype on nAChR-mediated functional assays
Differences in β2VL genotype on nAChR function were assessed with several assays using crude synaptosomal preparations. These assays measure presynaptic function of nAChRs by either agonist-stimulated efflux of 86Rb+ (Gotti et al., 2008; Marks et al., 1999), release of [3H]-GABA (McClure-Begley et al., 2009) or [3H]-dopamine (Grady et al., 1992; Salminen et al., 2004).
3.2.1. The β2VL mutation decreased function measured by 86Rb+ Efflux
3.2.1a. ACh-stimulated 86Rb+ efflux-Results
86Rb+ efflux experiments using synaptosomes prepared from either cortex or thalamus of the mice differing in β2VL genotype are illustrated in Figure 4. Agonist stimulated 86Rb+ efflux in both of these regions are mediated predominantly by α4β2*-nAChR (Gotti et al., 2008; Marks et al., 2007; Marks et al., 2000; Marks et al., 1999). The component of ACh-stimulated 86Rb+ efflux with high sensitivity to stimulation by ACh (HS) activity in this assay is a result of activation of the (α4β2)2(β2) and/or (α4β2)2(α5) stoichiometric forms of α4β2*-nAChR and the component of ACh-stimulated 86Rb+ efflux with low sensitivity (LS) activity is mediated by activation of the (α4β2)2(α4) form (Gotti et al., 2008). This determination is consistent with the properties of α4β2-nAChR differing in subunit stoichiometry using heterologous expression systems (Carbone et al., 2009; Moroni et al., 2006; Nelson et al., 2003; Zhou et al., 2003; Zwart and Vijverberg, 1998).
Figure 4. Decreased function of mutant α4β2* receptors in presynaptic nerve terminals, assessed by 86Rb efflux in synaptosomes.

ACh-stimulated 86Rb+ efflux was measured in crude synaptosomes prepared from cortex and thalamus. The panels in the figures present: a) Concentration-response curves for 86Rb efflux in thalamus. b) Maximal ACh stimulated 86Rb efflux for the higher ACh sensitivity (HS, left) and lower ACh sensitivity components (LS, right) in thalamus c) EC50 values for both HS and LS from thalamic synaptosomes of WT, HT and MT mice. d) Concentration-response curves for 86Rb efflux in cortex. e) Maximal ACh stimulated 86Rb efflux for the higher ACh sensitivity (left) and lower ACh sensitivity components (right) in the cortex, and f) EC50 values for synaptosomes prepared from the cortex. (*, significantly different from WT, p<0.05; +, significantly different from HT, p<0.05; n=4–9 per genotype and concentration).
The concentration effect curves for ACh stimulated 86Rb+ efflux were markedly different for both thalamic and cortical samples prepared from WT, HT and MT mice (Figure 4a and 4d). The two-way ANOVA in thalamus (Figure 4a), revealed significant main effects of genotype (F2,142=101.9, p<0.001) and ACh concentration (F6,142=16.59, p<0.001) as well as a significant interaction of genotype with concentration (F12,142=3.64, p<0.001), confirming the concentration dependence of the response, identifying a difference among the genotypes and indicating genotype-determined change in the concentration effect curves. These results were verified by the subsequent analysis of the effects of β2VL genotype on the parameters for ACh-stimulated 86Rb+ efflux (maximum efflux Vmax and EC50). Both HS and LS Vmax activity were significantly decreased in both HT and MT mice (Figure 4b, Vmax thalamus HS, F2,6=14.95, p<0.01; Vmax thalamus LS, F2,6=20.63, p<0.01). EC50 values were also significantly decreased in MT mice in both the HS and LS components (Figure 4c, EC50 thalamus HS, F2,6=10.59, p<0.01; EC50 thalamus LS, F2,6=5.80, p<0.05).
Similarly in the cortex (Figure 4d), there was a significant main effect of genotype (F2,176=12.81, p<0.001) and concentration (F7,176=20.61, p<0.001), as well as a significant genotype by dose interaction (F14,176=3.61, p<0.001). Subsequent analysis of the effects of the β2VL mutation in cortex on HS and LS components of ACh stimulated 86Rb+ efflux revealed a gene-dose dependent decrease in maximum efflux and EC50 for ACh for the LS activity only (Figure 4e, Vmax cortex LS, F2,6=124.04, p=<0.001; Figure 4f, EC50cortex LS, F2,6=18.63, p<0.01). The trend towards decreased HS activity was not statistically significant.
3.2.1b
Cytisine-sensitive [125I]-epibatidine binding in thalamus and cortex measures predominantly the density of α4β2*-nAChR binding sites (Marks et al., 2007; Marks et al., 2000). Thus, a direct comparison of the effect of the β2VL mutation on these sites in the same samples of thalamus and cortex used for the functional assays could be made and compared to the results determined autoradiographically. No significant differences in binding Kd for [125I]-epibatidine were noted among mice differing in β2VL genotype for these two regions. In cortex, WT mice had a Kd of 0.15±0.03 nM, HT values were 0.12±0.02 nM, and MT values were 0.13±0.02 nM. In the thalamus, Kd values were 0.15±0.06 nM for WT mice, 0.08±0.01 nM for HT mice, and 0.11±0.03 nM for MT mice. Consistent with the autoradiographic results, there was a tendency for Bmax values to decrease modestly as a consequence of the β2VL mutation. In the cortex, WT Bmax was 33.1±2.9 fmol/mg protein, HT was 32.7±1.7 fmol/mg protein and MT mice were 30.1±1.4 fmol/mg protein. Thalamus Bmax values were 96.1±12.2 fmol/mg protein for WT, 87.5±5.4 fmol/mg protein for HT, and 81.4±9.6 fmol/mg protein for MT mice.
3.2.1c. ACh-stimulated 86Rb+ efflux-Discussion
Overall, these data show that the β2VL mutation increases the ACh sensitivity of α4β2*-nAChR mediated 86Rb+ efflux in the thalamus and cortex of adult mice. However, it does not produce a significant gain in the agonist response at any concentration. In fact, the mutation significantly reduces ACh-stimulated efflux over a wide range of concentrations in thalamus and at concentrations near the peak of concentration-response relation in the cortex. The reduced function does not appear to result from a loss of receptor expression because there was no significant reduction in maximum cytisine-sensitive [125I]-epibatadine binding. The observation of a decreased response and higher sensitivity to agonists has been observed in several other nAChR mice harboring subunits that display a gain of function in heterologous expression systems, including α4 L9’S (Fonck et al., 2003), α4 L9’A (Fonck et al., 2005) and the ADNFLE α4 S248F (Teper et al., 2007) mutants. This pattern of reduced function following the introduction of mutations conferring increased sensitivity for agonist activation may be the result of modification of receptor function to dampen down the effects of the high activity receptors. Perhaps the mutation elicits a loss of surface receptor function, alters subunit stoichiometry or causes retention of the receptors in the endoplasmic reticulum.
3.2.2. The β2VL mutation for steady-state decreased EC50 for activation of and DC50 desensitization of 86Rb+ efflux by nicotine
3.2.2a. Nicotine-stimulated 86Rb+ efflux-Results
The β2VL mutation slows desensitization of the nicotine response of α4β2- nAChRs expressed in HEK cells (De Fusco et al., 2000). Therefore, we also measured stimulation of 86Rb+ efflux by nicotine and nicotine-induced desensitization of ACh-stimulated 86Rb+ efflux (Figure 5). The effect of the β2VL mutation on nicotine simulated 86Rb+ efflux is illustrated in Panels 5a and 5e. As desensitization data is a percent of control value, the remaining panels in Figure 5 also illustrate nicotine activation as percent of control.
Figure 5. β2VL mutation alters nicotine activation and steady-state desensitization, as assessed in synaptosomes.

Nicotine-stimulated 86Rb+ efflux and nicotine desensitization of ACh-stimulated 86Rb+ efflux were measured in crude thalamic and cortical synaptosomes. Concentration-response curves comparing nicotine-stimulated 86Rb+ efflux for WT, HT and MT are shown for thalamus a) and cortex e). Curves illustrating nicotine desensitization of ACh-stimulated 86Rb+ efflux were compared to the curves for nicotine-stimulated 86Rb+ efflux and are shown for WT thalamus b), cortex f), HT thalamus c), cortex g) and MT thalamus d), cortex h). These curves have been normalized to maximal response in WT (15.84±0.66) b), HT (13.44±0.31) c) or MT (5.82±0.32) d) thalamic synaptosomes. Dotted lines in c) and d) show WT values for comparison. Desensitization and activation curves normalized to maximal response in cortex for WT (7.70±1.22) f), HT (5.76±0.67) g) or MT (4.25±0.35) h) cortical synaptosomes. Dotted lines in g) and h) show WT values for comparison. (Data are mean ± SEM; n=2–9 mice per genotype and concentration).
Within the concentration range of nicotine used in this study, the concentration effect curves for nicotine stimulated 86Rb+ efflux are adequately described as simple Michaelis-Menten curves for both thalamus and cortex for all three β2VL genotypes. Analysis of the nicotine-stimulated 86Rb+ efflux from thalamic synaptosomes (Figure 5a) by two-way ANOVA revealed main effects of nicotine concentration (F7,72=121.48, p<0.001) and β2VL genotype (F2,72=35.10, p<0.001), as well as a significant concentration by genotype interaction (F14,72=8.50, p<0.01), results consistent with the increased efflux with increasing nicotine concentration, differences among the genotypes and a difference in the concentration effect curves among the genotypes. These results were confirmed by analysis of the fitted parameters of the concentration effect curves. This analysis showed a significant decrease in maximal efflux between (F2,6=129.5, p<0.001) Significant differences between β2VL genotypes were observed for Vmax (15.84±0.66 for WT, 13.44±0.31 for HT and 5.82±0.32 for MT; F2,6=129.5, p<0.001)and EC50 (1.63±0.37 μM for WT, 0.68±0.19 μM for HT and 0.25±0.04 μM for MT; F2,6=27.70, p<0.001).
Analysis of the nicotine-stimulated 86Rb+ efflux from cortical synaptosomes (Figure 5e) by two-way ANOVA was similar to that obtained for thalamus with significant main effects of nicotine concentration (F7,72=44.54, p<0.001) and β2VL genotype (F2,72=3.84, p<0.05), as well as a significant concentration by genotype interaction (F14,72=2.09, p<0.05). Analysis of the concentration-response relations showed significantly decreased Vmax as a function of genotype (8.38±0.77 for WT, 6.54±0.44 for HT and 4.44±0.35 for MT; F2,6=38.48, p<0.001), and significantly decreased EC50 (2.45±0.82 μM for WT, 0.58±0.18 μM for HT and 0.38±0.15 μM for MT; F2,6=16.13, p<0.01). Note that the responses for nicotine-stimulated 86Rb+ efflux are generally similar to those for ACh-stimulated 86Rb+ efflux presented above: a shift to the left in EC50 values and a decrease in maximum 86Rb+ efflux proceeding from WT to HT to MT.
3.2.2b. Desensitization of 86Rb+ efflux by nicotine-Results
We also used the 86Rb+ efflux assay with cortical and thalamic synaptosomes to determine whether the β2VL mutation alters steady-state desensitization of β2* nAChRs (Figure 5). Actual nicotine activation curves are shown for thalamus (5a) and cortex (5e). The normalized activation and desensitization curves calculated for WT mice are included in the panels for HT and MT mice for direct comparison.
A nicotine concentration dependent decrease in ACh-stimulated 86Rb+ efflux was observed for crude thalamic and cortical synaptosomes prepared from mice of all three genotypes. Data shown are percent of control ACh-stimulated 86Rb+ efflux, with control values in the thalamus 14.12±2.15 in WT, 6.08±0.96 in HT, and 4.29±0.52 in MT and control cortical values 5.64±1.43 in WT, 3.35±0.47 in HT, and 3.19±0.37 in MT. Because of these differences in control response, the two-way ANOVAs to evaluate the effects of genotype and nicotine concentration were conducted on data normalized to control response. The two-way ANOVA for thalamus revealed a main effect of nicotine concentration (F6,100=64.93, p<0.001) and genotype (F2,100=5.95, p<0.01), but the concentration by genotype interaction was not significant. Subsequent calculation of the DC50 concentrations in thalamus gave values of 3.22±0.73 nM, 2.06±0.26 nM, and 1.14±0.30 nM for WT (Figure 5b), HT (5c), and MT (5d) respectively. This significant gene dose dependent decrease in DC50 was confirmed by subsequent one-way ANOVA (F2,6=14.3, p<0.01). Thus, the DC50 for HT was 1.6 fold lower and the DC50 for MT was 2.8-fold lower than the DC50 for WT. The two-way ANOVA for cortex revealed a significant main effect of nicotine concentration (F6,100=70.57, p<0.001) but neither a main effect of genotype or a genotype by concentration interaction was noted. In the cortex, the DC50 values were 4.84±1.35 nM, 2.61±0.92 nM, and 1.76±0.71 nM for WT (5e), HT (5f), and MT (5g) mice respectively. Analysis of the effect of genotype on DC50 values by one-way ANOVA indicated a significant gene-dose dependent decrease (F2,6=7.18, p<0.05) with DC50 for HT 1.8 fold lower and the DC50 for MT 2.6-fold lower than the DC50 for WT.
3.2.2c. Nicotine effects on 86Rb+ efflux-Discussion
Exposure of nAChR to low concentrations of agonists desensitizes receptors (Katz and Thesleff, 1957; Marks et al., 2010; Marks et al., 1996; Quick and Lester, 2002). Overall, the β2VL mutation resulted in a progressive decrease in the DC50 for desensitization of ACh-stimulated 86Rb+ efflux by exposure to low concentrations of nicotine. Similar gene-dose dependent leftward shifts in both DC50 and EC50 for nicotine have been observed for α4β2*-nAChR harboring the α4L9’A mutation when measured either for receptors heterologously expressed in Xenopus oocytes by electrophysiological methods or for thalamic and cortical synaptosomes measured with 86Rb+ efflux (Fonck et al., 2005). Thus, introduction of either an α4 or a β2 gain of function mutation not only renders the resulting α4β2*-nAChR more sensitive to agonist activation (decrease in EC50) but also more sensitive to steady-state desensitization by exposure to sub-activating concentrations of agonists such as nicotine (lower DC50). For the β2VL knock-in mouse model studied here, the tendency of the mutation to have a greater effect on EC50 introduces a shift to the left for the area generating a larger concentration range of smoldering activity (analogous to “window-current”)(Hoda et al., 2008; Kuryatov et al., 2011) to a greater extent and at lower concentrations than for the WT.
3.2.3. The 2VL mutation altered ACh-stimulated [3H]-dopamine release
Dopamine release is mediated by two subclasses of β2*-nAChRs, those with α6 subunits and those without α6 subunits (Azam and McIntosh, 2005; Champtiaux et al., 2002; Drenan et al., 2008; Quik et al., 2011). The α6β2*-nAChRs are inhibited by low concentrations of α–CtxMII. α-CtxMII inhibition was used here to separate the activity mediated by α4β2*-nAChR (α–CtxMII-resistant dose-concentration curves, Figure 6a) and α4β2*-nAChR (α–CtxMII-sensitive dose-concentration curves, Figure 6b).
Figure 6. β2VL mutation alters ACh-mediated DA release from synaptosomes.
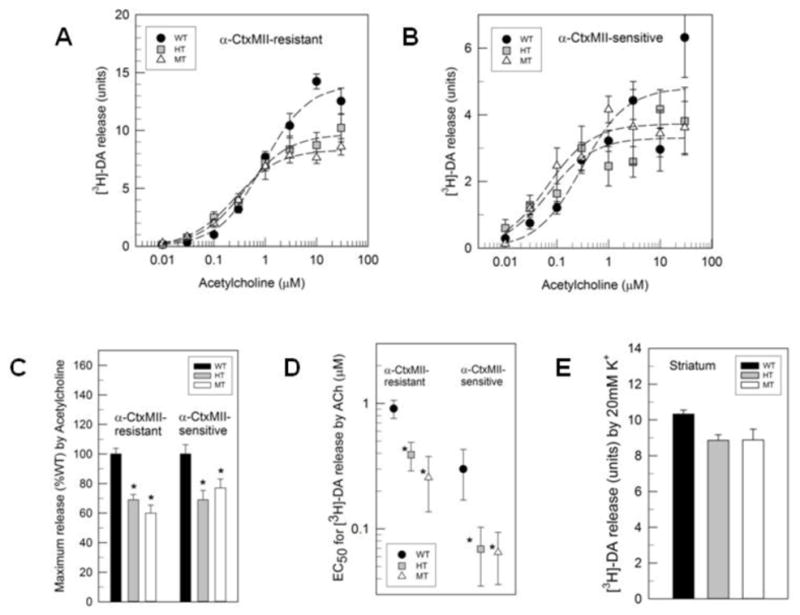
Striatal synaptosomes from WT, HT, and MT β2VL mice were assayed for α-CtxMII-resistant (α4β2*-nAChR-mediated) and -sensitive (α6β2*-nAChR-mediated) DA release using ACh (0.01–30 μM). a) Concentration-response curve for DA release in striatal synaptosomes that were α-CtxMII-resistant (non-α6β2*-containing) using ACh (0.01–30 μM). b) Concentration-response curve for DA release in a population of striatal synaptosomes that were α-CtxMII-sensitive (α6β2*-containing) using ACh (0.01–30 μM). c) Percent of WT maximum DA release for α-CtxMII-resistant (left) and α-CtxMII-sensitive (right). d) EC50 values release for α-CtxMII-resistant (left) and α-CtxMII-sensitive (right) populations from striatal synaptosomes e) K+-stimulated DA release in striatal synaptosomes. Data are mean ± SEM,*, significantly different from WT, p<0.05; n=4 per mice per genotype and concentration.
3.2.3a. [3H]-Dopamine release-Results
The two-way ANOVA for α–CtxMII-resistant DA release revealed significant main effects of genotype (F2,168=9.31, p<0.001) and ACh concentration (F7,168=119.70, p<0.001) as well as a significant genotype by concentration of ACh interaction (F14,168=4.57, p<0.001). Subsequent analysis of the ACh concentration response curves for the three genotypes demonstrated that the HT and MT had significantly decreased α-CtxMII-resistant maximal release (Figure 6c, 14.03±0.53 for WT, 9.70±0.51 for HT and 8.35±0.76 for MT; F2,21=23.62, p<0.001), as well as lower EC50 values (Figure 6d, 0.91±0.15 μM for WT, 0.39±0.03 μM for HT and 0.26±0.12 μM for MT; F2,6=15.98, p<0.01). The two-way ANOVA for α–CtxMII-sensitive DA release revealed a significant main effect of ACh concentration (F7,168=18.06, p<0.001), but not of genotype (F(2,168)=0.52, p>0.05); however, a significant interaction of genotype by concentration of ACh was noted (F14,168=1.94, p<0.05). Subsequent analysis of the ACh concentration response curves for the three genotypes demonstrated that the HT and MT had significantly decreased α-CtxMII-sensitive maximal release (Figure 6c, 4.82±0.30 for WT, 3.31±0.30 for HT and 3.73±0.29 for MT; F2,21=6.90, p<0.01) as well as lower EC50 values (Figure 6d, 0.30±0.13 μM for WT, 0.069±0.034 μM for HT and 0.065±0.029 μM for MT; F2,6=9.28, p<0.05). The concentration response curves for ACh indicate a small gain-of-function at low ACh concentrations for both subclasses of receptor with a decrease in release at higher concentrations. K+-stimulated release (Figure 6e) was unaffected by the β2VL mutation (F(2,9)=4.09, p>0.05).
3.2.3b. [3H]-Dopamine release-Discussion
Synaptosomal nAChR-evoked [3H]-dopamine release is mediated by a diverse set of receptor subtypes, which can be generally classified as those that are sensitive to inhibition by α-CtxMII (incorporating the α6 and β2 subunits: (α6β2)(α4β2)β3, (α6β2)2β3 and possibly (α6β2)2(β2) and those that are resistant to inhibition by α-Ctx MII (incorporating the α4 and β2 subunits: (α4β2)2(β2) and (α4β2)2(α5) (Grady et al., 2007; Meyer et al., 2008; Salminen et al., 2007; Salminen et al., 2004)). Both the α-CtxMII-sensitive and -resistant ACh-stimulated [3H]-dopamine release from striatal synaptosomes are altered by the β2VL mutation. The response is somewhat similar to that observed for 86Rb+ efflux: reduction of maximal response with a shift to the left of the concentration-effect curves. However, the reduction in maximal response is not gene-dose dependent in that the change observed for the MT is comparable to that for the HT for both the α-CtxMII-sensitive and –resistant components. Perhaps the fact that a significant fraction of both the α-CtxMII sensitive and the α-CtxMII-resistant activity is mediated by nAChR that include auxiliary subunits (β3 subunit or α5 subunit, respectively) limits the extent of the functional decrease elicited by the β2VL mutation (Grady et al., 2007; Salminen et al., 2004). The decrease in the α-CtxMII sensitive [3H]-dopamine release (31% decrease in HT and 23% decrease in MT) is virtually identical to the decrease in [125I]-α-CtxMII binding (31% decrease in HT and 25% decrease in MT), indicating that the functional change arises predominantly from a decrease in the number of α6β2*-nAChR. The effect of the β2VL substitution on the α-CtxMII-sensitive and -resistant components of nAChR mediated [3H]-dopamine release differs from the effect of the α4S248F substitution on these components (Teper et al., 2007). While the β2VL mutation reduced both the α-CtxMII-sensitive and –resistant components of ACh stimulated [3H]-dopamine release, only α-CtxMII-resistant release was affected by the α4S248F substitution (with both a decrease in maximal release and a leftward shift of the concentration-response curve). The fact that both α-CtxMII-sensitive and -resistant components of ACh-stimulated [3H]-dopamine release require the β2 subunit, while only a subset of the α-CtxMII-sensitive component requires the α4 subunit (α4β2)(α6β2)β3-nAChR) may explain the difference in the effect of these two mutations (Grady et al., 2007; Salminen et al., 2004).
3.2.4. The β2VL mutation alters [3H]-GABA release
nAChR mediated ACh stimulated [3H]-GABA release is mediated by α4β2*-nAChRs (McClure-Begley et al., 2009). We chose to investigate the effects of the β2VL mutation on [3H]-GABA release in cortex and hippocampus.
3.2.4a. [3H]-GABA release-Results
The results of the two-way ANOVA in the hippocampus (Figure 7a) revealed a significant main effect of genotype (F2,133=7.73, p<0.001) and a significant main effect of ACh concentration (F6,133=26.33, p<0.001), as well a significant genotype by ACh concentration interaction (F12,133=1.893, p<0.05). Subsequent analysis revealed that maximum ACh-stimulated [3H]-GABA release was not significantly altered by genotype in hippocampus (Figure 7c, 1.96±0.17 for WT, 2.25±0.16 for HT and 2.11±0.14 for MT; F(2,6)=2.55, p>0.05), but significant differences in EC50 values were observed (Figure 7d,1.22±0.45 μM for WT, 0.50±0.17 for HT and 0.16±0.05 for MT; F2,6=24.47, p<0.001).
Figure 7. β2VL mutation alters ACh-mediated GABA release from synaptosomes.

Hippocampal and cortical synaptosomes from WT, HT, and MT β2VL mice were assayed for ACh-mediated GABA release (0.03–30 μM ACh). a) Concentration-response curves for hippocampal synaptosomes from WT, HT, and MT β2VL mice were assayed for ACh-mediated GABA release (0.03–30 μM ACh). b) Concentration-response curves for cortical synaptosomes from WT, HT, and MT β2VL mice were assayed for ACh-mediated GABA release (0.03–30 μM ACh). c) Percent of WT maximum GABA release from hippocampal and cortical synaptosomes d) EC50 values from hippocampal and cortical synaptosomes. e) K+-stimulated GABA release in hippocampal and cortical synaptosomes. Data are mean ± SEM, *, significantly different from WT, p<0.05; +, significantly different from HT, p<0.05; n=6–8 per mice per genotype and concentration.
In cortex, (Figure 7b), there was a significant main effect of genotype (F2,133=14.44, p<0.001) and of ACh concentration (F6,133=57.59, p<0.001), as well as a significant genotype by ACh concentration interaction (F12,133=3.32, p<0.001). Subsequent analysis revealed that maximum ACh-stimulated [3H]-GABA release, in contrast to hippocampus, was significantly decreased in the cortex of MT mice (Figure 7c, 3.31±0.24 for WT, 3.69±0.19 for HT and 2.64±0.13 for MT; F(2,6)=22.99, p<0.01). A significant decrease in EC50 values was observed (Figure 7d, 1.03±0.32 μM for WT, 0.39±0.12 for HT and 0.12±0.03 for MT; F2,6=41.84, p<0.001) by genotype in the cortex. There were no significant differences among the genotypes in K+-stimulated GABA release (Figure 7e, hippocampus F(2,18)=1.67, p>0.05; cortex F(2,20)=0.78, p>0.05).
The concentration response curves demonstrate that, at lower concentrations of ACh (below 1 μM in cortex and below 10 μM in hippocampus), as a result of the significant decreases in EC50 values and modest changes in maximal responses, the β2VL mutation does produce a considerable gain-of-function in hippocampus while at higher concentrations a mild functional decrease is seen in cortex.
3.2.4b. [3H]-GABA release-Discussion
Much less reduction in maximal ACh-stimulated [3H]-GABA release was seen (0% in hippocampus and 20% in cortex), in comparison to 86Rb+ efflux and [3H]-dopamine release. In addition, the β2VL mutation resulted in a decrease in EC50 of approximately 10-fold for the MT compared to WT. Consequently, distinct gain of function is observed for both HT and MT [3H]-GABA release upon stimulation with ACh concentrations of 1 μM or lower. The retention of maximal nAChR [3H]-GABA release in the HT and MT mice may be an adaptive consequence of increased activity of the mutant receptors on excitatory neurons such that retained GABAergic responses serve to dampen hyperexcitability. However, this retention of easily activated nAChRs on presynaptic GABAergic terminals may also contribute to the hypersensitivity of the HT and MT mice to nicotine-induced behaviors (Xu et al., 2011) through the introduction of synchronization of inhibitory/excitatory neurons (Klaassen et al., 2006; Mann and Mody, 2008; Steinlein, 2010; Zhang et al., 2012).
In contrast with the β2VL mutation (at the 22′ position of the M2 domain), the α4S248F mutation (at the 6′ position of the M2 domain) resulted in significant decreases in maximal ACh-stimulated [3H]-GABA release in HT (60% decrease) and MT (80% decrease), with a 30-fold decrease in EC50 (Teper et al., 2007). Even though a decrease in maximal release was observed, the α4S248F HT and MT exhibited somewhat higher ACh-stimulated [3H]-GABA release than WT at ACh concentrations below 1 μM. The fact that the mutations were in different subunits (α4 versus β2) could be a cause of this differential response. Alternatively, this difference in response to the mutations could reflect the fact that a mutation at the 6′ position (further into the channel) has a greater impact on maximal receptor function than a substitution at the 22′ position (near the opening of the channel). Possibly, the change from the polar amino acid serine to a non-polar and bulkier phenylalanine in the α4S248F mutation may have more impact on receptor function than the more subtle change from valine to leucine in the β2VL mouse. It is possible that a combination of the mutated subunit, the location of the mutation and the extent of structural change of the substituted amino acid may influence whether GABA release exhibits an overall gain of function, as with the β2VL mutation; or an overall loss of function, as with the α4S248F mutation.
3.3. Behavioral assessment of the effect of nicotine treatment on β2VL mice
Acute injection of nicotine elicits a dose-dependent decrease in locomotor activity and an induction of hypothermia in WT mice (Marks et al., 1985). β2 knock-out mice demonstrate reduced sensitivity to the acute injections of nicotine on these measures (Tritto et al., 2004). Mice expressing a gain of function mutation in the α4 nAChR subunit (α4L9’A) are more sensitive to nicotine-induced hypothermia (Tapper et al., 2004). Furthermore, nicotine can induce two types of seizures, both partial and generalized, in α4L9’A knock-in mice, but only generalized seizures in WT animals (Fonck et al., 2005). Results from the synaptosomal functional assays showed increased sensitivity to ACh and nicotine (decreases in EC50 values) associated with the β2VL genotype. We utilized open field and Y-maze to assess locomotor activity to further characterize nicotine sensitivity in β2VL mice. Doses used for the activity/temperature measurements, as based on previous studies, did not produce generalized seizures even in the MT mice (McCallum et al., 2006; Tritto et al., 2004). We also evaluated the effects of higher nicotine doses on seizure activity and DAC related behaviors.
3.3.1a. β2VL HT and MT mice are more sensitive to nicotine-induced locomotor depression
Basal open field activity following saline injection was significantly higher in MT compared to WT mice (inset, Figure 8a, F2,25=4.20, p<0.05). Subsequently, the effect of nicotine treatment on locomotor activity is shown in Figure 8a as a percent of each genotype’s saline-exposed control. Acute nicotine administration elicited dose-dependent decreases in distance traveled in the open field for all three genotypes indicated by the significant main effect of dose (F3,86=13.03, p<0.001). ED50 values were significantly lower for the HT (0.53±0.15 mg/kg) and MT mice (0.43±0.14 mg/kg) compared to the WT (1.13±0.37 mg/kg) (F2,6=7.15, p<0.05).
Figure 8. Increased sensitivity to nicotine-induced behaviors in β2VL HT and MT mice.

Mice from all three genotypes were injected with a single dose of nicotine (WT, 0, 0.5, 1.0 or 1.5 mg/kg; HT and MT 0, 0.125, 0.25, 0.5 or 1.0 mg/kg). Three min following injection, mice were placed in the Y-maze and assessed for 3 minutes followed immediately thereafter by a 5 min assessment in the open field to measure nicotine-induced locomotor activity. At 15 min post injection, rectal temperature was taken. In WT (black filled circles), HT (grey filled circles) or MT mice (open circles), the effects of nicotine on measures of locomotion measured in distance in the open field a), crosses b) and rears c) in the Y-maze test. d) Effects of nicotine injection on body temperature, assessed 15 min after injection. Insets in upper right corner of each panel show ED50 values for all three strain. By one-way ANOVA, ED50 values were significantly decreased compared to WT values (data are mean ± SEM, *, p<0.05; **, p<0.01; n=4–9 per group).
No differences in basal Y-maze crosses were noted, so untransformed data were analyzed. The effects of acute nicotine administration on Y-maze crosses showed significant main effects of dose (F3,86=42.31, p<0.001) and genotype (F2,86=11.85, p<0.001), as well as a significant interaction between dose and genotype (F6,86=2.23, p=0.05, Figure 8b). ED50 values for the HT (0.08±0.02 mg/kg) and MT (0.11±0.05 mg/kg) mice were significantly lower than that for WT mice (0.34±0.09 mg/kg) (F2,6 = 18.85, p<0.01).
No differences in basal Y-maze rears following saline injection were noted, so untransformed data were analyzed. The effects of acute nicotine treatment on Y-maze rears showed significant main effects of dose (F3,86=29.50, p<0.001) and genotype; (F2,86=11.83, p<0.001) (Figure 8c). ED50 values for the HT (0.07±0.03 mg/kg) and MT (0.06±0.02 mg/kg) mice were significantly lower than that for WT mice (0.19±0.08 mg/kg (F2,6 = 7.25, p<0.05).
3.3.1b. β2VL mice are more sensitive to nicotine-induced hypothermia
Mice differing in β2VL genotype were also tested to determine if the mutation altered thermoregulation in response to nicotine. We found that HT and MT mice were markedly more susceptible to nicotine-induced hypothermia than WT mice (Figure 8d). Significant main effects of nicotine on body temperature were noted for nicotine dose (F3,86=33.52, p<0.001) and genotype (F2,86=34.30, p<0.001), as well as a significant dose by genotype interaction (F6,86=3.94, p<0.01). Greater maximal temperature decreases were observed for both HT and MT mice. The nicotine dose that elicited a temperature decrease of 2° C was significantly lower for both HT (0.16±0.03 mg/kg) and MT (0.19±0.04 mg/kg) mice than for WT mice (0.78±0.10 mg/kg) (F2,106 = 6.46, p<0.01).
3.3.1c. Nicotine effects on locomotion and body temperature-Discussion
Both HT and MT mice were 2- to 4- fold more sensitive to acute nicotine administration measured by depression of activity (Y-maze crosses and rears, and open field activity) and body temperature. In WT mice, these responses are inhibited by mecamylamine, which indicates that the behaviors are a consequence of nAChR activation, rather than desensitization (Collins et al., 1986; Zambrano et al., 2009). No differences among the genotypes on baseline (saline-injected) Y-maze crosses and rears and body temperature were noted. However, saline-injected MT mice were significantly more active in the open field, an observation that may reflect the higher home cage activity reported previously for MT mice (Xu et al., 2011). The increased sensitivity to nicotine in the HT and MT mice contrasts with decreased sensitivity measured for β2 knockout mice (Tritto et al., 2004) and further confirms a role for β2*-nAChR as modulators of nicotine’s effects on these measures. It is worth noting that although the magnitude differs, the leftward shift in behavioral sensitivity (a 2.5- to 4.2-fold decrease in ED50), is similar to the leftward shift in the concentration-response curves for nicotine-stimulated 86Rb+ efflux (6.5- to 10-fold). The increased sensitivity may also arise from the increased smoldering functional activity reflecting a balance of activation and desensitization of the α4β2*-nAChR. Thus, even though there appears to be a tendency for loss of function of some β2*-nAChR, the heightened agonist sensitivity of the remaining receptors may render the HT and MT mice more sensitive to an acute agonist, in this case nicotine, challenge. The enhanced agonist sensitivity may also reflect the retention of hyperactive GABAergic activity exhibited by HT and MT mice. Another gain of function mutant (α4L9’A MT mice) is also much more sensitive to nicotine-induced hypothermia demonstrating approximately a 20-fold shift in ED50 (Tapper et al., 2007), indicating that insertion of a nAChR subunit with enhanced affinity for nicotine increases sensitivity to nicotine mediated behaviors.
3.3.2a. β2VL MT mice demonstrate a unique phenotype prior to EEG-detectable nicotine-induced seizures
Cortical EEG recordings were performed to determine whether nicotine-induced convulsion-like behaviors in β2VL mice were ictal (true seizure) in nature. We observed distinct EEG/behavior patterns between β2VL MT and WT littermates in response to nicotine. A single high dose (5mg/kg, i.p.) nicotine injection in WT mice (n=4) led to a single tonic-clonic convulsion 3~4 min post-injection, simultaneous with EEG spike-wave discharges (Figure 9a). When MT mice (n=5) were injected with 5mg/kg nicotine, we observed two temporally separated convulsions: an initial convulsion ~30 s after injection with forelimb clonus and loss of the righting response, described further in DAC behavior described below, but with no EEG changes. A second convulsion began 3–4 min after injection, was tonic-clonic, and had EEG spike-wave activity, indicative of generalized seizure activity (Figure 9b).
Figure 9. Seizure and DAC sensitivity in β2VL mice.
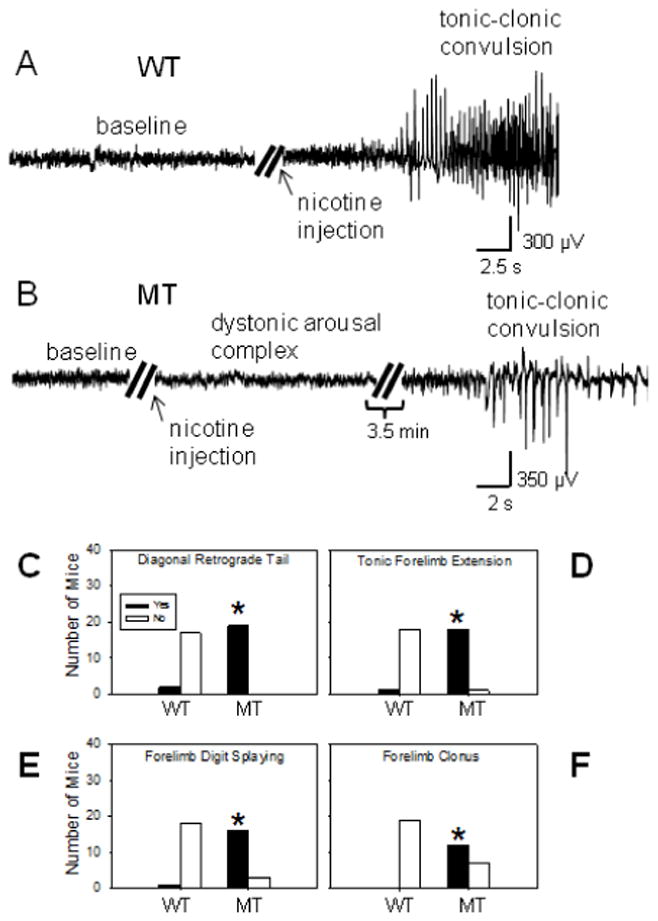
a–b, Example EEG traces from WT and MT mice before and after a single nicotine injection of 5 mg/kg, i.p.. Baseline EEG recordings were unremarkable in all mice tested. a) WT mice dosed with 5 mg/kg nicotine (n=4) displayed spike-wave seizures (high amplitude activity on EEG trace) that were accompanied by tonic-clonic convulsions. b) MT mice dosed with 5 mg/kg nicotine (n=5) displayed two distinct sets of behaviors: the first set starting with Straub tail, forelimb clonus, and loss of righting response lasting 10 to 30 s, collectively termed here as Dystonic Arousal Complex (DAC), which did not result in EEG abnormalities, followed by, 2–3 min later, spike-wave seizure accompanied by tonic-clonic convulsions. c–f, Nicotine-induced DAC behaviors following 2 mg/kg (i.p.) injections including c) diagonal retrograde tail, d) tonic forelimb extension, e) forelimb digit splaying, and f) forelimb clonus (c–f, data are mean ± SEM; n=12–18 mice).
3.3.2b. Nicotine induces DAC-related behaviors in mutant β2VL mice
Knock-in mice bearing the α4S248F ADNFLE mutation display a novel behavioral response called the dystonic arousal complex (DAC) following administration of 2 mg/kg nicotine (Teper et al., 2007). The DAC response includes diagonal retrograde (Straub) tail, tonic forelimb extension, tonic digit splaying, and occasionally forelimb clonus. Both the α4S28F (Tepper and Lee, 2007) and β2VL ADNFLE mice display nicotine-induced, DAC-related behaviors, which may be a manifestation of a phenotype exhibited by human ADNFLE patients. We injected MT β2VL mice with 2 mg/kg nicotine to determine whether they displayed responses similar to the α4S248F mice (Fig. 9c–f). Similar to the α4S248F mice, nicotine (2 mg/kg) reliably elicited diagonal retrograde tail, tonic forelimb extension, and tonic forelimb digit splaying in MT mice but not WT littermates (Fig. 9c–f). All the MT mice displayed diagonal retrograde tail (19/19 mice), almost all, tonic forelimb extension (18/19), and most, tonic forelimb digit splaying (16/19). Most also exhibited forelimb clonus (12/19). In contrast, only two WT mice displayed diagonal retrograde tail (2/19), a single WT mouse displayed tonic forelimb extension and digit splaying (1/19), and none displayed forelimb clonus (0/19). The typical sequence of these behaviors in the MT mice was diagonal retrograde tail, followed by nearly simultaneous tonic forelimb extension and digit splaying, and finally forelimb clonus. However, there were exceptions to this pattern. Some MT mice displayed clonic forelimb movements that were interspersed with tonic limb extension and occasionally preceded limb extension. The post-injection latencies for the onset of diagonal retrograde tail, tonic forelimb extension, tonic digit splaying, and forelimb clonus in the mutant mice were 31 ± 8 s (mean ± SEM, n = 19 mice), 57 ± 5 s (n = 17), 59 ± 6 s (n = 16), and 59 ± 7 s (n = 12), respectively. Thus, the DAC response is a common feature of α4S248F and β2VL mice.
3.3.2c. Nicotine effects on seizures and DAC-Discussion
Mice expressing the β2VL mutation are not only more sensitive to the effects of nicotine, but at higher nicotine doses (5 mg/kg), display behaviors not seen in WT mice reminiscent of human ADNFLE. For example, MT mice receiving higher dose nicotine displayed forelimb clonus and loss of righting response, reminiscent of repetitive jerky arm movements and asymmetrical posturing seen in ADNFLE patients (Scheffer et al., 1995). Furthermore, during DAC behaviors, the EEGs of β2VL mice are normal, which is also consistent with the observation that a majority of ADNFLE patients present non-diagnostic EEGs (Combi et al., 2004; Oldani et al., 1998; Rozycka and Trzeciak, 2003; Scheffer et al., 1995). Nicotine-induced behavioral and electrographic patterns in β2VL mice are remarkably similar to other mutant mice expressing ADNLFE mutations (Teper et al., 2007) or other gain-of-function mutations in α4 or β2 nicotinic receptors, (Fonck et al., 2005) which taken together provide further support to the hypothesis that ADNFLE is a disease of increased sensitivity of α4 or β2 nAChRs. The absence of EEG changes either in nicotine-treated β2VL mice and in ADNFLE patients experiencing convulsive behaviors may still represent partial or focal seizures which are typically undetectable with cortical electrodes. Temporal separation of behavioral patterns elicited by 5 mg/kg nicotine suggests the activation of distinct neuronal circuits in β2VL mice, with DAC behaviors likely mediated by the activation of mutated hypersensitive β2 -containing receptors.
Dopaminergic agonists such as apomorphine elicit Straub tail in mice (Zarrindast et al., 1993). The β2VL mutation significantly enhances ACh-induced, a-CtxMII-resistant dopamine release from striatal synaptosomes at 100 nM ACh (Figure 6a). Thus, an increase in nicotine-induced dopamine release may contribute to the enhanced Straub tail response displayed by β2VL MT mice. Tonic limb extension (posturing) and digit splaying are associated with frontal lobe epilepsy in human patients and can be caused by ictal activity in the supplementary motor cortex (Jobst and Williamson, 2005). These behavioral signs also occur during human ADNFLE seizures (see Fig. 4b in (Scheffer et al., 1995)). Rodents do not have a supplementary motor area (SMA) per se but the rostral forelimb area is thought to be the anatomical equivalent of the SMA in the rodent cortex (Rouiller et al., 1993). Thus, nicotine-induced activity in this area may underlie the tonic limb extension and digit splaying observed in β2VL MT mice. In human frontal lobe epilepsy, limb clonus is typically ascribed to ictal activity in the motor cortex (Jobst and Williamson, 2005). At present, we do not know whether ADNFLE seizures are caused by a nAChR-mediated process during early CNS development (Manfredi et al., 2009), acute activation of the ADNFLE mutant nAChRs in the mature CNS, or a combination of both. However, the appearance of behaviors such as tonic limb extension and digit splaying in nicotine-injected ADNFLE mice suggests that acute activation of the mutant nAChRs could play a role in the semiology of adult ADNFLE seizures.
4. Summary Discussion
Mouse models for ADNFLE clearly display “phenotypic differences” (Steinlein 2010). We have provided further characterization for the β2 valine 287 leucine (β2VL) knock-in mouse engineered by Xu et al (2011). Results support hypotheses of hyperactivity of GABAergic neurons as a possible trigger for seizure-related activity (Klaassen et al, 2006; Mann and Mody, 2008; Steinlein 2010). While the β2VL knock-in mouse model does not show the typical seizures of ADNFLE seen in the transgene mouse model (Manfredi et al, 2009), the behavioral phenotype does include sleep-wake disturbances (Xu et al, 2011), DAC activity and increased sensitivity to nicotine (the latter two presented here). This regulation may have a developmental component given that silencing transgene expression in the overexpressing transgenic β2VL mouse during development prevents presentation of the seizure phenotype (Manfredi et al., 2009).
This characterization of biochemical changes suggests some regulation of β2*-nAChR expression and function occurs to reduce overstimulation in mice harboring the mutation.
The β2VL knock-in mutation elicits no change in mRNA expression, mild decreases in mutant subunit protein, and somewhat larger decreases in receptor binding sites. Gene-dose dependent decreases in EC50 values were noted for each of the functional assays. Any gain-of-function seen at low agonist concentrations is likely attributable to a decrease in EC50. However, a down regulation (decrease) in maximum activity was seen for a number of nAChR responses measured biochemically. It could be postulated that these functional decreases arise from the overstimulation of mutant nAChR and are an adaptive response to that overstimulation, perhaps a consequence of negative feedback. The actual mechanisms for the selective decreases in expression and function remain to be determined. Potential mechanisms could include enhanced receptor retention in the endoplasmic reticulum, changes in subunit stoichiometry, and decreased receptor functionality (Srinivasan et al., 2011;Son et al., 2009;Gentry and Lukas, 2002). Unlike the effects of other M2 mutations in mice, the nAChR mediated [3H]-GABA release does not appear to be down regulated in the β2VL mice.
The behavioral changes in the β2VL HT and MT mice are similar: the mice harboring the mutation are more sensitive to acute nicotine administration than are WT mice. Although the heightened sensitivity to nicotine seems inconsistent with a decrease in α4β2*–nAChR function, the relative change in ED50 measured in vivo is similar to the change in EC50 measured in vitro. These data, in combination with similar assays for other gain-of-function mutations, may lead to a better understanding of how such mutations in humans can result in ADNFLE. It should be noted that significant changes were noted in the HT mice, which more closely approximates human ADNFLE.
Highlights.
Mice with a leu to val mutation in the β2 nicotinic receptor subunit were evaluated
The mutation reduced β2 nicotinic receptor expression but not mRNA levels
Mutant receptors were activated by lower concentrations of ACh or nicotine in vitro
The mutation had varying effects on maximal response
Mutant and heterozygous mice were more sensitive to nicotine than wild-type mice
Acknowledgments
The authors thank Jian Xu and Steve Heinemann at the Salk Institute, LaJolla, CA for initially supplying the β2VL mutant mice. This work was supported by grants R01 DA003194, R01 DA012242, P30 DA015663 and U19 DA019375.
Abbreviations
- α-CtxMII
α-conotoxin MII
- CX
Cortex
- CX
il, Cortex, inner layers
- CX
ol, Cortex, outer layers
- DLG
Dorsolateral geniculate
- GP
Globus pallidus
- HP
Hippocampus
- IC
Inferior colliculus
- IC
dc, Inferior colliculus, dorsal cortex
- IPN
Interpeduncular nucleus
- MHb
Medial habenula
- NAcc
Nucleus accumbens
- OB
Olfactory bulb
- OT
Olfactory tubercle
- SC
onl, Superior colliculus, optic nerve layer
- SC
sg, Superior colliculus, superficial grey
- SN
Substantia nigra
- ST
Striatum
- TH
Thalamus
- TH
av, Thalamus, anterioventral nucleus
- TH
lp, Thalamus, lateroposterior nucleus
- TH
vp, Thalamus, vetroposterior nucleus
- VLG
Ventrolateral geniculate
- VTA
Ventral tegmental area
- nAChR
nicotinic acetylcholine receptor
- ADNFLE
autosomal nocturnal frontal lobe epilepsy
- DAC
Dystonic arousal complex
- EEG
Electroencephalogram
- DFP
Diisopropyfluorophosphate
- SSC
Saline sodium citrate
- β2VL
β2 nAChR subunits harboring a valine or leucine substitution at position 287
- WT
Mice harboring the wild-type amino acid (valine) at position 287) of the β2 nAChR subunit
- HT
Mice harboring one copy of the wild-type (valine) and one copy of the mutant (leucine) at position 287 of the β2 nAChR subunit
- MT
Mice harboring the mutant amino acid (leucine) at position 287 of the β2 nAChR subunit
- rtPCR
reverse transcription polymerase chain reaction
- ED50
Dose eliciting 50% of maximal response in vivo
- EC50
Concentration eliciting 50% of maximal functional response in vitro
- DC50
Concentration eliciting 50% decrease in response by desensitization
- Vmax
Maximal response for functional assays
Footnotes
Publisher's Disclaimer: This is a PDF file of an unedited manuscript that has been accepted for publication. As a service to our customers we are providing this early version of the manuscript. The manuscript will undergo copyediting, typesetting, and review of the resulting proof before it is published in its final citable form. Please note that during the production process errors may be discovered which could affect the content, and all legal disclaimers that apply to the journal pertain.
Contributor Information
Heidi C. O’Neill, Email: HCO-heidi.oneill@colorado.edu.
Duncan C. Laverty, Email: DCL-duncanlaverty@gmail.com.
Natalie E. Patzlaff, Email: NEP-npatzlaff@wisc.edu.
Bruce N. Cohen, Email: BNC-bncohen@caltech.edu.
Sheri McKinney, Email: SMcK-mckinney@caltech.edu.
J. Michael McIntosh, Email: JMM-mcintosh.mike@gmail.com.
Jon M. Lindstrom, Email: JML-jslkk@mail.med.upenn.edu.
Henry A. Lester, Email: HAL-lester@caltech.edu.
Sharon R. Grady, Email: SRG-sharon.grady@colorado.edu.
Michael J. Marks, Email: MJM-michael.marks@colorado.edu.
References
- Aridon P, Marini C, Di Resta C, Brilli E, De Fusco M, Politi F, Parrini E, Manfredi I, Pisano T, Pruna D, Curia G, Cianchetti C, Pasqualetti M, Becchetti A, Guerrini R, Casari G. Increased sensitivity of the neuronal nicotinic receptor alpha 2 subunit causes familial epilepsy with nocturnal wandering and ictal fear. Am J Hum Genet. 2006;79:342–350. doi: 10.1086/506459. [DOI] [PMC free article] [PubMed] [Google Scholar]
- Azam L, McIntosh JM. Effect of novel alpha-conotoxins on nicotine-stimulated [3H]dopamine release from rat striatal synaptosomes. J Pharmacol Exp Ther. 2005;312:231–237. doi: 10.1124/jpet.104.071456. [DOI] [PubMed] [Google Scholar]
- Baddick CG, Marks MJ. An autoradiographic survey of mouse brain nicotinic acetylcholine receptors defined by null mutants. Biochem Pharmacol. 2011;82:828–841. doi: 10.1016/j.bcp.2011.04.019. [DOI] [PMC free article] [PubMed] [Google Scholar]
- Bertrand D, Elmslie F, Hughes E, Trounce J, Sander T, Bertrand S, Steinlein OK. The CHRNB2 mutation I312M is associated with epilepsy and distinct memory deficits. Neurobiol Dis. 2005;20:799–804. doi: 10.1016/j.nbd.2005.05.013. [DOI] [PubMed] [Google Scholar]
- Bertrand D, Picard F, Le Hellard S, Weiland S, Favre I, Phillips H, Bertrand S, Berkovic SF, Malafosse A, Mulley J. How mutations in the nAChRs can cause ADNFLE epilepsy. Epilepsia. 2002;43 (Suppl 5):112–122. doi: 10.1046/j.1528-1157.43.s.5.16.x. [DOI] [PubMed] [Google Scholar]
- Carbone AL, Moroni M, Groot-Kormelink PJ, Bermudez I. Pentameric concatenated (alpha4)(2)(beta2)(3) and (alpha4)(3)(beta2)(2) nicotinic acetylcholine receptors: subunit arrangement determines functional expression. Br J Pharmacol. 2009;156:970–981. doi: 10.1111/j.1476-5381.2008.00104.x. [DOI] [PMC free article] [PubMed] [Google Scholar]
- Cartier GE, Yoshikami D, Gray WR, Luo S, Olivera BM, McIntosh JM. A new alpha-conotoxin which targets alpha3beta2 nicotinic acetylcholine receptors. J Biol Chem. 1996;271:7522–7528. doi: 10.1074/jbc.271.13.7522. [DOI] [PubMed] [Google Scholar]
- Champtiaux N, Gotti C, Cordero-Erausquin M, David DJ, Przybylski C, Lena C, Clementi F, Moretti M, Rossi FM, Le Novere N, McIntosh JM, Gardier AM, Changeux JP. Subunit composition of functional nicotinic receptors in dopaminergic neurons investigated with knockout mice. J Neurosci. 2003;23:7820–7829. doi: 10.1523/JNEUROSCI.23-21-07820.2003. [DOI] [PMC free article] [PubMed] [Google Scholar]
- Champtiaux N, Han ZY, Bessis A, Rossi FM, Zoli M, Marubio L, McIntosh JM, Changeux JP. Distribution and pharmacology of alpha 6-containing nicotinic acetylcholine receptors analyzed with mutant mice. J Neurosci. 2002;22:1208–1217. doi: 10.1523/JNEUROSCI.22-04-01208.2002. [DOI] [PMC free article] [PubMed] [Google Scholar]
- Collins AC, Evans CB, Miner LL, Marks MJ. Mecamylamine blockade of nicotine responses: evidence for two brain nicotinic receptors. Pharmacol Biochem Behav. 1986;24:1767–1773. doi: 10.1016/0091-3057(86)90518-6. [DOI] [PubMed] [Google Scholar]
- Combi R, Dalpra L, Tenchini ML, Ferini-Strambi L. Autosomal dominant nocturnal frontal lobe epilepsy--a critical overview. J Neurol. 2004;251:923–934. doi: 10.1007/s00415-004-0541-x. [DOI] [PubMed] [Google Scholar]
- De Fusco M, Becchetti A, Patrignani A, Annesi G, Gambardella A, Quattrone A, Ballabio A, Wanke E, Casari G. The nicotinic receptor beta 2 subunit is mutant in nocturnal frontal lobe epilepsy. Nat Genet. 2000;26:275–276. doi: 10.1038/81566. [DOI] [PubMed] [Google Scholar]
- Drenan RM, Grady SR, Whiteaker P, McClure-Begley T, McKinney S, Miwa JM, Bupp S, Heintz N, McIntosh JM, Bencherif M, Marks MJ, Lester HA. In vivo activation of midbrain dopamine neurons via sensitized, high-affinity alpha 6 nicotinic acetylcholine receptors. Neuron. 2008;60:123–136. doi: 10.1016/j.neuron.2008.09.009. [DOI] [PMC free article] [PubMed] [Google Scholar]
- Fonck C, Cohen BN, Nashmi R, Whiteaker P, Wagenaar DA, Rodrigues-Pinguet N, Deshpande P, McKinney S, Kwoh S, Munoz J, Labarca C, Collins AC, Marks MJ, Lester HA. Novel seizure phenotype and sleep disruptions in knock-in mice with hypersensitive alpha 4* nicotinic receptors. J Neurosci. 2005;25:11396–11411. doi: 10.1523/JNEUROSCI.3597-05.2005. [DOI] [PMC free article] [PubMed] [Google Scholar]
- Fonck C, Nashmi R, Deshpande P, Damaj MI, Marks MJ, Riedel A, Schwarz J, Collins AC, Labarca C, Lester HA. Increased sensitivity to agonist-induced seizures, straub tail, and hippocampal theta rhythm in knock-in mice carrying hypersensitive alpha 4 nicotinic receptors. J Neurosci. 2003;23:2582–2590. doi: 10.1523/JNEUROSCI.23-07-02582.2003. [DOI] [PMC free article] [PubMed] [Google Scholar]
- Franklin Keith BJ, Paxinos G. The Mouse Brain in Stereotaxic Coordinates. San Diego: Acamdemic Press; 1997. [Google Scholar]
- Gentry CL, Lukas RJ. Regulation of nicotinic acetylcholine receptor numbers and function by chronic nicotine exposure. Curr Drug Targets CNS Neurol Disord. 2002;1:359–385. doi: 10.2174/1568007023339184. [DOI] [PubMed] [Google Scholar]
- Gotti C, Moretti M, Clementi F, Riganti L, McIntosh JM, Collins AC, Marks MJ, Whiteaker P. Expression of nigrostriatal alpha 6-containing nicotinic acetylcholine receptors is selectively reduced, but not eliminated, by beta 3 subunit gene deletion. Mol Pharmacol. 2005;67:2007–2015. doi: 10.1124/mol.105.011940. [DOI] [PubMed] [Google Scholar]
- Gotti C, Moretti M, Meinerz NM, Clementi F, Gaimarri A, Collins AC, Marks MJ. Partial deletion of the nicotinic cholinergic receptor alpha 4 or beta 2 subunit genes changes the acetylcholine sensitivity of receptor-mediated 86Rb+ efflux in cortex and thalamus and alters relative expression of alpha 4 and beta 2 subunits. Mol Pharmacol. 2008;73:1796–1807. doi: 10.1124/mol.108.045203. [DOI] [PubMed] [Google Scholar]
- Grady S, Marks MJ, Wonnacott S, Collins AC. Characterization of nicotinic receptor-mediated [3H]dopamine release from synaptosomes prepared from mouse striatum. J Neurochem. 1992;59:848–856. doi: 10.1111/j.1471-4159.1992.tb08322.x. [DOI] [PubMed] [Google Scholar]
- Grady SR, Salminen O, Laverty DC, Whiteaker P, McIntosh JM, Collins AC, Marks MJ. The subtypes of nicotinic acetylcholine receptors on dopaminergic terminals of mouse striatum. Biochem Pharmacol. 2007;74:1235–1246. doi: 10.1016/j.bcp.2007.07.032. [DOI] [PMC free article] [PubMed] [Google Scholar]
- Hirose S, Iwata H, Akiyoshi H, Kobayashi K, Ito M, Wada K, Kaneko S, Mitsudome A. A novel mutation of CHRNA4 responsible for autosomal dominant nocturnal frontal lobe epilepsy. Neurology. 1999;53:1749–1753. doi: 10.1212/wnl.53.8.1749. [DOI] [PubMed] [Google Scholar]
- Hoda JC, Gu W, Friedli M, Phillips HA, Bertrand S, Antonarakis SE, Goudie D, Roberts R, Scheffer IE, Marini C, Patel J, Berkovic SF, Mulley JC, Steinlein OK, Bertrand D. Human nocturnal frontal lobe epilepsy: pharmocogenomic profiles of pathogenic nicotinic acetylcholine receptor beta-subunit mutations outside the ion channel pore. Mol Pharmacol. 2008;74:379–391. doi: 10.1124/mol.107.044545. [DOI] [PubMed] [Google Scholar]
- Jobst BC, Williamson PD. Frontal lobe seizures. Psychiatr Clin North Am. 2005;28:635–651. 648–639. doi: 10.1016/j.psc.2005.05.012. [DOI] [PubMed] [Google Scholar]
- Katz B, Thesleff S. A study of the desensitization produced by acetylcholine at the motor end-plate. J Physiol. 1957;138:63–80. doi: 10.1113/jphysiol.1957.sp005838. [DOI] [PMC free article] [PubMed] [Google Scholar]
- Klaassen A, Glykys J, Maguire J, Labarca C, Mody I, Boulter J. Seizures and enhanced cortical GABAergic inhibition in two mouse models of human autosomal dominant nocturnal frontal lobe epilepsy. Proc Natl Acad Sci U S A. 2006;103:19152–19157. doi: 10.1073/pnas.0608215103. [DOI] [PMC free article] [PubMed] [Google Scholar]
- Kuryatov A, Berrettini W, Lindstrom J. Acetylcholine receptor (AChR) alpha5 subunit variant associated with risk for nicotine dependence and lung cancer reduces (alpha4beta2)alpha5 AChR function. Mol Pharmacol. 2011;79:119–125. doi: 10.1124/mol.110.066357. [DOI] [PMC free article] [PubMed] [Google Scholar]
- Lowry OH, Rosebrough NJ, Farr AL, Randall RJ. Protein measurement with the Folin phenol reagent. J Biol Chem. 1951;193:265–275. [PubMed] [Google Scholar]
- Lu Y, Grady S, Marks MJ, Picciotto M, Changeux JP, Collins AC. Pharmacological characterization of nicotinic receptor-stimulated GABA release from mouse brain synaptosomes. J Pharmacol Exp Ther. 1998;287:648–657. [PubMed] [Google Scholar]
- Manfredi I, Zani AD, Rampoldi L, Pegorini S, Bernascone I, Moretti M, Gotti C, Croci L, Consalez GG, Ferini-Strambi L, Sala M, Pattini L, Casari G. Expression of mutant beta2 nicotinic receptors during development is crucial for epileptogenesis. Hum Mol Genet. 2009;18:1075–1088. doi: 10.1093/hmg/ddp004. [DOI] [PubMed] [Google Scholar]
- Mann EO, Mody I. The multifaceted role of inhibition in epilepsy: seizure-genesis through excessive GABAergic inhibition in autosomal dominant nocturnal frontal lobe epilepsy. Curr Opin Neurol. 2008;21:155–160. doi: 10.1097/WCO.0b013e3282f52f5f. [DOI] [PubMed] [Google Scholar]
- Marks MJ, Meinerz NM, Brown RW, Collins AC. 86Rb+ efflux mediated by alpha4beta2*-nicotinic acetylcholine receptors with high and low-sensitivity to stimulation by acetylcholine display similar agonist-induced desensitization. Biochem Pharmacol. 2010;80:1238–1251. doi: 10.1016/j.bcp.2010.06.040. [DOI] [PMC free article] [PubMed] [Google Scholar]
- Marks MJ, Meinerz NM, Drago J, Collins AC. Gene targeting demonstrates that alpha4 nicotinic acetylcholine receptor subunits contribute to expression of diverse [3H]epibatidine binding sites and components of biphasic 86Rb+ efflux with high and low sensitivity to stimulation by acetylcholine. Neuropharmacology. 2007;53:390–405. doi: 10.1016/j.neuropharm.2007.05.021. [DOI] [PMC free article] [PubMed] [Google Scholar]
- Marks MJ, Pauly JR, Gross SD, Deneris ES, Hermans-Borgmeyer I, Heinemann SF, Collins AC. Nicotine binding and nicotinic receptor subunit RNA after chronic nicotine treatment. J Neurosci. 1992;12:2765–2784. doi: 10.1523/JNEUROSCI.12-07-02765.1992. [DOI] [PMC free article] [PubMed] [Google Scholar]
- Marks MJ, Robinson SF, Collins AC. Nicotinic agonists differ in activation and desensitization of 86Rb+ efflux from mouse thalamic synaptosomes. J Pharmacol Exp Ther. 1996;277:1383–1396. [PubMed] [Google Scholar]
- Marks MJ, Romm E, Bealer SM, Collins AC. A test battery for measuring nicotine effects in mice. Pharmacol Biochem Behav. 1985;23:325–330. doi: 10.1016/0091-3057(85)90577-5. [DOI] [PubMed] [Google Scholar]
- Marks MJ, Stitzel JA, Grady SR, Picciotto MR, Changeux JP, Collins AC. Nicotinic-agonist stimulated (86)Rb(+) efflux and [(3)H]epibatidine binding of mice differing in beta2 genotype. Neuropharmacology. 2000;39:2632–2645. doi: 10.1016/s0028-3908(00)00115-5. [DOI] [PubMed] [Google Scholar]
- Marks MJ, Whiteaker P, Calcaterra J, Stitzel JA, Bullock AE, Grady SR, Picciotto MR, Changeux JP, Collins AC. Two pharmacologically distinct components of nicotinic receptor-mediated rubidium efflux in mouse brain require the beta2 subunit. J Pharmacol Exp Ther. 1999;289:1090–1103. [PubMed] [Google Scholar]
- Marubio LM, del Mar Arroyo-Jimenez M, Cordero-Erausquin M, Lena C, Le Novere N, de Kerchove d’Exaerde A, Huchet M, Damaj MI, Changeux JP. Reduced antinociception in mice lacking neuronal nicotinic receptor subunits. Nature. 1999;398:805–810. doi: 10.1038/19756. [DOI] [PubMed] [Google Scholar]
- McCallum SE, Collins AC, Paylor R, Marks MJ. Deletion of the beta 2 nicotinic acetylcholine receptor subunit alters development of tolerance to nicotine and eliminates receptor upregulation. Psychopharmacology (Berl) 2006;184:314–327. doi: 10.1007/s00213-005-0076-6. [DOI] [PubMed] [Google Scholar]
- McClure-Begley TD, King NM, Collins AC, Stitzel JA, Wehner JM, Butt CM. Acetylcholine-stimulated [3H]GABA release from mouse brain synaptosomes is modulated by alpha4beta2 and alpha4alpha5beta2 nicotinic receptor subtypes. Mol Pharmacol. 2009;75:918–926. doi: 10.1124/mol.108.052274. [DOI] [PMC free article] [PubMed] [Google Scholar]
- Meyer EL, Yoshikami D, McIntosh JM. The neuronal nicotinic acetylcholine receptors alpha 4* and alpha 6* differentially modulate dopamine release in mouse striatal slices. J Neurochem. 2008;105:1761–1769. doi: 10.1111/j.1471-4159.2008.05266.x. [DOI] [PMC free article] [PubMed] [Google Scholar]
- Moroni M, Zwart R, Sher E, Cassels BK, Bermudez I. alpha4beta2 nicotinic receptors with high and low acetylcholine sensitivity: pharmacology, stoichiometry, and sensitivity to long-term exposure to nicotine. Mol Pharmacol. 2006;70:755–768. doi: 10.1124/mol.106.023044. [DOI] [PubMed] [Google Scholar]
- Nelson ME, Kuryatov A, Choi CH, Zhou Y, Lindstrom J. Alternate stoichiometries of alpha4beta2 nicotinic acetylcholine receptors. Mol Pharmacol. 2003;63:332–341. doi: 10.1124/mol.63.2.332. [DOI] [PubMed] [Google Scholar]
- Oldani A, Zucconi M, Asselta R, Modugno M, Bonati MT, Dalpra L, Malcovati M, Tenchini ML, Smirne S, Ferini-Strambi L. Autosomal dominant nocturnal frontal lobe epilepsy. A video-polysomnographic and genetic appraisal of 40 patients and delineation of the epileptic syndrome. Brain. 1998;121 (Pt 2):205–223. doi: 10.1093/brain/121.2.205. [DOI] [PubMed] [Google Scholar]
- Phillips HA, Favre I, Kirkpatrick M, Zuberi SM, Goudie D, Heron SE, Scheffer IE, Sutherland GR, Berkovic SF, Bertrand D, Mulley JC. CHRNB2 is the second acetylcholine receptor subunit associated with autosomal dominant nocturnal frontal lobe epilepsy. Am J Hum Genet. 2001;68:225–231. doi: 10.1086/316946. [DOI] [PMC free article] [PubMed] [Google Scholar]
- Phillips HA, Scheffer IE, Berkovic SF, Hollway GE, Sutherland GR, Mulley JC. Localization of a gene for autosomal dominant nocturnal frontal lobe epilepsy to chromosome 20q 13. 2. Nat Genet. 1995;10:117–118. doi: 10.1038/ng0595-117. [DOI] [PubMed] [Google Scholar]
- Picciotto MR, Zoli M, Lena C, Bessis A, Lallemand Y, Le Novere N, Vincent P, Pich EM, Brulet P, Changeux JP. Abnormal avoidance learning in mice lacking functional high-affinity nicotine receptor in the brain. Nature. 1995;374:65–67. doi: 10.1038/374065a0. [DOI] [PubMed] [Google Scholar]
- Picciotto MR, Zoli M, Rimondini R, Lena C, Marubio LM, Pich EM, Fuxe K, Changeux JP. Acetylcholine receptors containing the beta2 subunit are involved in the reinforcing properties of nicotine. Nature. 1998;391:173–177. doi: 10.1038/34413. [DOI] [PubMed] [Google Scholar]
- Quick MW, Lester RA. Desensitization of neuronal nicotinic receptors. J Neurobiol. 2002;53:457–478. doi: 10.1002/neu.10109. [DOI] [PubMed] [Google Scholar]
- Quik M, Perez XA, Grady SR. Role of alpha6 nicotinic receptors in CNS dopaminergic function: relevance to addiction and neurological disorders. Biochem Pharmacol. 2011 doi: 10.1016/j.bcp.2011.06.001. [DOI] [PMC free article] [PubMed] [Google Scholar]
- Rodrigues-Pinguet N, Jia L, Li M, Figl A, Klaassen A, Truong A, Lester HA, Cohen BN. Five ADNFLE mutations reduce the Ca2+ dependence of the mammalian alpha4beta2 acetylcholine response. J Physiol. 2003;550:11–26. doi: 10.1113/jphysiol.2003.036681. [DOI] [PMC free article] [PubMed] [Google Scholar]
- Rouiller EM, Moret V, Liang F. Comparison of the connectional properties of the two forelimb areas of the rat sensorimotor cortex: support for the presence of a premotor or supplementary motor cortical area. Somatosens Mot Res. 1993;10:269–289. doi: 10.3109/08990229309028837. [DOI] [PubMed] [Google Scholar]
- Rozycka A, Trzeciak WH. Genetic basis of autosomal dominant nocturnal frontal lobe epilepsy. J Appl Genet. 2003;44:197–207. [PubMed] [Google Scholar]
- Salminen O, Drapeau JA, McIntosh JM, Collins AC, Marks MJ, Grady SR. Pharmacology of alpha-conotoxin MII-sensitive subtypes of nicotinic acetylcholine receptors isolated by breeding of null mutant mice. Mol Pharmacol. 2007;71:1563–1571. doi: 10.1124/mol.106.031492. [DOI] [PubMed] [Google Scholar]
- Salminen O, Murphy KL, McIntosh JM, Drago J, Marks MJ, Collins AC, Grady SR. Subunit composition and pharmacology of two classes of striatal presynaptic nicotinic acetylcholine receptors mediating dopamine release in mice. Mol Pharmacol. 2004;65:1526–1535. doi: 10.1124/mol.65.6.1526. [DOI] [PubMed] [Google Scholar]
- Scheffer IE, Bhatia KP, Lopes-Cendes I, Fish DR, Marsden CD, Andermann E, Andermann F, Desbiens R, Keene D, Cendes F, et al. Autosomal dominant nocturnal frontal lobe epilepsy. A distinctive clinical disorder. Brain. 1995;118 (Pt 1):61–73. doi: 10.1093/brain/118.1.61. [DOI] [PubMed] [Google Scholar]
- Son CD, Moss FJ, Cohen BN, Lester HA. Nicotine normalizes intracellular subunit stoichiometry of nicotinic receptors carrying mutations linked to autosomal dominant nocturnal frontal lobe epilepsy. Mol Pharmacol. 2009;75:1137–1148. doi: 10.1124/mol.108.054494. [DOI] [PMC free article] [PubMed] [Google Scholar]
- Srinivasan R, Pantoja R, Moss FJ, Mackey ED, Son CD, Miwa J, Lester HA. Nicotine up-regulates alpha4beta2 nicotinic receptors and ER exit sites via stoichiometry-dependent chaperoning. J Gen Physiol. 2011;137:59–79. doi: 10.1085/jgp.201010532. [DOI] [PMC free article] [PubMed] [Google Scholar]
- Steinlein OK. Animal models for autosomal dominant frontal lobe epilepsy: on the origin of seizures. Expert Rev Neurother. 2010;10:1859–1867. doi: 10.1586/ern.10.130. [DOI] [PubMed] [Google Scholar]
- Steinlein OK, Magnusson A, Stoodt J, Bertrand S, Weiland S, Berkovic SF, Nakken KO, Propping P, Bertrand D. An insertion mutation of the CHRNA4 gene in a family with autosomal dominant nocturnal frontal lobe epilepsy. Hum Mol Genet. 1997;6:943–947. doi: 10.1093/hmg/6.6.943. [DOI] [PubMed] [Google Scholar]
- Steinlein OK, Mulley JC, Propping P, Wallace RH, Phillips HA, Sutherland GR, Scheffer IE, Berkovic SF. A missense mutation in the neuronal nicotinic acetylcholine receptor alpha 4 subunit is associated with autosomal dominant nocturnal frontal lobe epilepsy. Nat Genet. 1995;11:201–203. doi: 10.1038/ng1095-201. [DOI] [PubMed] [Google Scholar]
- Swanson LW, Simmons DM, Whiting PJ, Lindstrom J. Immunohistochemical localization of neuronal nicotinic receptors in the rodent central nervous system. J Neurosci. 1987;7:3334–3342. doi: 10.1523/JNEUROSCI.07-10-03334.1987. [DOI] [PMC free article] [PubMed] [Google Scholar]
- Tapper AR, McKinney SL, Marks MJ, Lester HA. Nicotine responses in hypersensitive and knockout alpha 4 mice account for tolerance to both hypothermia and locomotor suppression in wild-type mice. Physiol Genomics. 2007;31:422–428. doi: 10.1152/physiolgenomics.00063.2007. [DOI] [PubMed] [Google Scholar]
- Tapper AR, McKinney SL, Nashmi R, Schwarz J, Deshpande P, Labarca C, Whiteaker P, Marks MJ, Collins AC, Lester HA. Nicotine activation of alpha4* receptors: sufficient for reward, tolerance, and sensitization. Science. 2004;306:1029–1032. doi: 10.1126/science.1099420. [DOI] [PubMed] [Google Scholar]
- Teper Y, Whyte D, Cahir E, Lester HA, Grady SR, Marks MJ, Cohen BN, Fonck C, McClure-Begley T, McIntosh JM, Labarca C, Lawrence A, Chen F, Gantois I, Davies PJ, Petrou S, Murphy M, Waddington J, Horne MK, Berkovic SF, Drago J. Nicotine-induced dystonic arousal complex in a mouse line harboring a human autosomal-dominant nocturnal frontal lobe epilepsy mutation. J Neurosci. 2007;27:10128–10142. doi: 10.1523/JNEUROSCI.3042-07.2007. [DOI] [PMC free article] [PubMed] [Google Scholar]
- Tepper JM, Lee CR. GABAergic control of substantia nigra dopaminergic neurons. Prog Brain Res. 2007;160:189–208. doi: 10.1016/S0079-6123(06)60011-3. [DOI] [PubMed] [Google Scholar]
- Tritto T, McCallum SE, Waddle SA, Hutton SR, Paylor R, Collins AC, Marks MJ. Null mutant analysis of responses to nicotine: deletion of beta2 nicotinic acetylcholine receptor subunit but not alpha7 subunit reduces sensitivity to nicotine-induced locomotor depression and hypothermia. Nicotine Tob Res. 2004;6:145–158. doi: 10.1080/14622200310001656966. [DOI] [PubMed] [Google Scholar]
- Whiteaker P, Cooper JF, Salminen O, Marks MJ, McClure-Begley TD, Brown RW, Collins AC, Lindstrom JM. Immunolabeling demonstrates the interdependence of mouse brain alpha4 and beta2 nicotinic acetylcholine receptor subunit expression. J Comp Neurol. 2006;499:1016–1038. doi: 10.1002/cne.21181. [DOI] [PubMed] [Google Scholar]
- Whiteaker P, Jimenez M, McIntosh JM, Collins AC, Marks MJ. Identification of a novel nicotinic binding site in mouse brain using [(125)I]-epibatidine. Br J Pharmacol. 2000a;131:729–739. doi: 10.1038/sj.bjp.0703616. [DOI] [PMC free article] [PubMed] [Google Scholar]
- Whiteaker P, McIntosh JM, Luo S, Collins AC, Marks MJ. 125I-alpha-conotoxin MII identifies a novel nicotinic acetylcholine receptor population in mouse brain. Mol Pharmacol. 2000b;57:913–925. [PubMed] [Google Scholar]
- Whiteaker P, Peterson CG, Xu W, McIntosh JM, Paylor R, Beaudet AL, Collins AC, Marks MJ. Involvement of the alpha3 subunit in central nicotinic binding populations. J Neurosci. 2002;22:2522–2529. doi: 10.1523/JNEUROSCI.22-07-02522.2002. [DOI] [PMC free article] [PubMed] [Google Scholar]
- Whiting P, Lindstrom J. Purification and characterization of a nicotinic acetylcholine receptor from rat brain. Proc Natl Acad Sci U S A. 1987;84:595–599. doi: 10.1073/pnas.84.2.595. [DOI] [PMC free article] [PubMed] [Google Scholar]
- Xu J, Cohen BN, Zhu Y, Dziewczapolski G, Panda S, Lester HA, Heinemann SF, Contractor A. Altered activity-rest patterns in mice with a human autosomal-dominant nocturnal frontal lobe epilepsy mutation in the beta2 nicotinic receptor. Mol Psychiatry. 2011;16:1048–1061. doi: 10.1038/mp.2010.78. [DOI] [PMC free article] [PubMed] [Google Scholar]
- Zambrano CA, Marks MJ, Cassels BK, Maccioni RB. In vivo effects of 3-iodocytisine: pharmacological and genetic analysis of hypothermia and evaluation of chronic treatment on nicotinic binding sites. Neuropharmacology. 2009;57:332–342. doi: 10.1016/j.neuropharm.2009.05.004. [DOI] [PMC free article] [PubMed] [Google Scholar]
- Zarrindast MR, Bayat A, Shafaghi B. Involvement of dopaminergic receptor subtypes in straub tail behaviour in mice. Gen Pharmacol. 1993;24:127–130. doi: 10.1016/0306-3623(93)90022-p. [DOI] [PubMed] [Google Scholar]
- Zhang ZJ, Koifman J, Shin DS, Ye H, Florez CM, Zhang L, Valiante TA, Carlen PL. Transition to Seizure: Ictal Discharge Is Preceded by Exhausted Presynaptic GABA Release in the Hippocampal CA3 Region. J Neurosci. 2012;32:2499–2512. doi: 10.1523/JNEUROSCI.4247-11.2012. [DOI] [PMC free article] [PubMed] [Google Scholar]
- Zhou Y, Nelson ME, Kuryatov A, Choi C, Cooper J, Lindstrom J. Human alpha4beta2 acetylcholine receptors formed from linked subunits. J Neurosci. 2003;23:9004–9015. doi: 10.1523/JNEUROSCI.23-27-09004.2003. [DOI] [PMC free article] [PubMed] [Google Scholar]
- Zoli M, Lena C, Picciotto MR, Changeux JP. Identification of four classes of brain nicotinic receptors using beta2 mutant mice. J Neurosci. 1998;18:4461–4472. doi: 10.1523/JNEUROSCI.18-12-04461.1998. [DOI] [PMC free article] [PubMed] [Google Scholar]
- Zwart R, Vijverberg HP. Four pharmacologically distinct subtypes of alpha4beta2 nicotinic acetylcholine receptor expressed in Xenopus laevis oocytes. Mol Pharmacol. 1998;54:1124–1131. [PubMed] [Google Scholar]