

Abstract
Long-term potentiation (LTP) is often induced experimentally by continuous high-frequency afferent stimulation (HFS), typically at 100 Hz for 1 s. Induction of LTP requires postsynaptic depolarization and voltage-dependent calcium influx. Induction is more effective if the same number of stimuli are given as a series of short bursts rather than as continuous HFS, in part because excitatory postsynaptic potentials (EPSPs) become strongly depressed during HFS, reducing postsynaptic depolarization. In this study, we examined mechanisms of EPSP depression during HFS in area CA1 of rat hippocampal brain slices. We tested for presynaptic terminal vesicle depletion by examining minimal stimulation-evoked excitatory postsynaptic currents (EPSCs) during 100-Hz HFS. While transmission failures increased, consistent with vesicle depletion, EPSC latencies also increased during HFS, suggesting a decrease in afferent excitability. Extracellular recordings of Schaffer collateral fiber volleys confirmed a decrease in afferent excitability, with decreased fiber volley amplitudes and increased latencies during HFS. To determine the mechanism responsible for fiber volley changes, we recorded antidromic action potentials in single CA3 pyramidal neurons evoked by stimulating Schaffer collateral axons. During HFS, individual action potentials decreased in amplitude and increased in latency, and these changes were accompanied by a large increase in the probability of action potential failure. Time derivative and phase-plane analyses indicated decreases in both axon initial segment and somato-dendritic components of CA3 neuron action potentials. Our results indicate that decreased presynaptic axon excitability contributes to depression of excitatory synaptic transmission during HFS at synapses between Schaffer collaterals and CA1 pyramidal neurons.
Keywords: synaptic transmission, action potential conduction, hippocampus, Schaffer collateral
the mechanisms underlying induction of long-term potentiation (LTP) are well known and have been reviewed many times (e.g., Bliss and Collingridge 1993; Blundon and Zakharenko 2008; Lynch 2004). At synapses in hippocampal area CA1, postsynaptic depolarization stimulates Ca2+ influx through N-methyl-d-aspartate (NMDA) receptor channels and, under some conditions, voltage-gated Ca2+ channels, with consequent activation of Ca2+-dependent signaling pathways. High-frequency stimulation (HFS), typically at 100 Hz for 1 s, is commonly used to provide the postsynaptic depolarization required to trigger LTP induction. During 100-Hz HFS, postsynaptic depolarization rapidly increases, because of facilitation and summation of excitatory postsynaptic potentials (EPSPs); however, the depolarization then gradually decreases, with EPSPs becoming strongly depressed within 200–400 ms (Grover et al. 2009). Depression of EPSPs is avoided if the same number of stimuli are grouped into short bursts rather than delivered as a single, continuous tetanus, and this is one reason for the greater efficacy of LTP induction with burst stimulation (Grover et al. 2009; Larson et al. 1986).
Synaptic depression has been studied at many synapses. Depression can be caused by depletion of releasable synaptic vesicles, but other mechanisms are possible (Zucker and Regehr 2002). These mechanisms may include loss of functional release sites, inactivation of presynaptic calcium currents, decreased quantity of transmitter in vesicles, activation of inhibitory autoreceptors, postsynaptic desensitization, and failure of presynaptic action potentials. For Schaffer collateral/commissural synapses onto CA1 pyramidal neurons in acute brain slices, experimental evidence implicates vesicle depletion as a mechanism for synaptic depression (Dobrunz and Stevens 1997; Wesseling and Lo 2002). Most studies of vesicle depletion in the hippocampus have used stimulation frequencies lower than the 100-Hz frequency often used in LTP studies (e.g., 10 Hz in Dobrunz and Stevens 1997, 20–40 Hz in Wesseling and Lo 2002). Although it seems reasonable to assume that vesicle depletion should explain the synaptic depression that occurs during HFS used for LTP induction, to the best of our knowledge there have been no experimental studies testing this assumption.
Our primary objective in this study was to determine the mechanism responsible for the EPSP depression that occurs during 100-Hz HFS. In light of previous studies, we initially assumed that vesicle depletion was the most likely cause of the EPSP depression. Contrary to our expectation, our evidence indicates that synaptic depression during 100-Hz HFS is a consequence of decreased excitability in presynaptic axons. Recordings of antidromically conducted action potentials in Schaffer collateral axons revealed a complex pattern of changes in axon excitability during HFS including delayed action potential conduction, decreased action potential amplitude, and increased action potential failure. Time derivative and phase-plane analyses indicated that these changes affected both axon initial segment as well as somato-dendritic components of antidromically recorded action potentials.
MATERIALS AND METHODS
Slice preparation.
Hippocampal slices were prepared as previously described (Grover et al. 2009; Holmes and Grover 2006). Sprague-Dawley rats (male, 30–60 days old, Hilltop Lab Animals, Scottdale, PA) were sedated by CO2-air inhalation and decapitated. The brain was removed and placed into chilled artificial cerebrospinal fluid (ACSF) composed of (in mM) 124 NaCl, 26 NaHCO3, 3.4 KCl, 1.2 NaH2PO4, 2.0 CaCl2, 2.0 MgSO4, and 10 glucose, pH 7.35, equilibrated with 95% O2-5% CO2. A block of the brain containing both hippocampi was glued to the stage of a vibrating microtome (Campden Instruments, Lafayette, IN), immersed in chilled ACSF, and sectioned into 400-μm-thick slices. Slices containing the hippocampus in transverse orientation were dissected to free the hippocampus from surrounding structures. Hippocampal slices were stored at room temperature (20–22°C) in an interface holding chamber. For electrophysiological recordings, individual slices were transferred to a small volume (∼200 μl) interface recording chamber heated to 35°C, where slices were perfused (1–1.5 ml/min) with oxygenated ACSF. All procedures were approved by the Institutional Animal Care and Use Committee at Marshall University.
Field potential recording.
Extracellular field potentials were recorded through glass micropipettes filled with ACSF (3–5 MΩ) and placed into the stratum radiatum of area CA1. Signals were amplified (gain 100–1,000), filtered (0.05–3,000 Hz or 0.1–10,000 Hz), digitized (10–100 kHz; National Instruments, Austin, TX), and stored on a personal computer with WinWCP or WinEDR software (Strathclyde Electrophysiology Software, John Dempster, University of Strathclyde, Glascow, UK).
Whole cell recording.
Somatic whole cell patch-clamp recordings were obtained from CA1 or CA3 pyramidal neurons by the method of Blanton et al. (1989). For EPSP and action potential recordings, patch electrodes (3–5 MΩ) were filled with 140 mM potassium gluconate, 10 mM sodium HEPES, 3 mM MgCl2, adjusted to 285 mosM, pH 7.2. For excitatory postsynaptic current (EPSC) recordings, cesium gluconate (140 mM) was substituted for potassium gluconate. Recordings were done in the continuous current- or voltage-clamp mode of an Axoclamp 2B (Axon Instruments, Sunnyvale, CA). Signals were amplified (gain 10), low-pass filtered (1–3 kHz), digitized (10–100 kHz; National Instruments), and stored on a personal computer with WinWCP or WinEDR programs. For current-clamp recordings, access resistance (<30 MΩ) was compensated with the Axoclamp bridge circuit; cells were recorded at their resting membrane potentials. For voltage-clamp recordings, access resistance averaged 12.7 ± 2.8 MΩ (mean ± SE) and was not compensated; cells were held at a constant potential (−60 to −80 mV) near their resting membrane potential. Membrane potentials were not corrected for the liquid junction potential.
Evoked synaptic responses and fiber volley potentials.
A stimulating electrode was placed into stratum radiatum in area CA1 ∼500–800 μm from the recording site. In most recordings, a bipolar Teflon-insulated stainless steel stimulating electrode was used. In some recordings, as noted in results, a monopolar glass micropipette (patch pipette) filled with ACSF was used for stimulation. Constant-voltage, biphasic stimuli (duration 0.1 ms) were delivered with an A-M Systems model 2100 stimulator. Stimulus intensity was monitored in some recordings by measuring the voltage drop over a 10,000-Ω resistor placed in series with the stimulating electrode. For field EPSP (fEPSP) recordings, stimulus intensity was chosen as the lowest level of stimulation voltage that evoked a discernible population spike (positive deflection superimposed on the negative field potential). For whole cell current-clamp recordings of EPSPs, stimulus intensity was adjusted to spike threshold (level that produced synaptically evoked action potentials on ∼50% of trials). For whole cell voltage-clamp recordings of EPSCs, a minimal stimulation (Raastad et al. 1992; Turner 1988) protocol was used, with stimulus intensity initially set to a low level that failed to evoke a response (failures on 100% of trials) and then gradually increased to the lowest level where responses became intermixed with failures. For recordings of isolated fiber volleys, the stimulus intensity was adjusted to produce the largest response that could be obtained without contamination of the fiber volley by the stimulus artifact.
Stimulus trains of 80–160 pulses at 10–100 Hz were delivered at the test stimulation intensity, determined as described above. When multiple stimulus trains were delivered during the same recording, LTP was prevented by addition of an NMDA receptor antagonist [50 μM d-2-amino-5-phosphonopentanoic acid (D-AP5) or 5 μM CGP-37849] and nifedipine (20 μM) to the ACSF perfusing the slice and ≥5 min separated stimulus trains to allow any short-term plasticity to decay. fEPSPs were quantified by measuring the slope of the negative-going portion of the waveform, and whole cell EPSPs were quantified by measuring the slope of the positive-going portion of the waveform. Fiber volley amplitudes were measured as the difference between the maximum negativity and the following positivity. Latencies were measured as the time difference between the beginning of the stimulus artifact and the response at 10% of its peak amplitude.
Evoked antidromic action potentials.
Antidromic action potentials recorded in CA3 pyramidal cells were evoked by stimulation in stratum radiatum at the border between area CA3 and area CA1. Synaptically evoked action potentials were prevented by addition of ionotropic glutamate receptor antagonists (30 μM DNQX and 50 μM D-AP5 or 20 μM MK-801) and GABA receptor antagonists (10 μM bicuculline methiodide, 1 μM CGP-55485) to the ACSF. Stimulus intensity was adjusted to a level that produced firing during 100% of trials at low frequency (1 Hz). Amplitude and latency measurements of antidromic action potentials were made during HFS. Amplitude was determined by the difference between membrane potential immediately before each stimulus and membrane potential at the peak of the action potential. Latency was determined as the time difference between the beginning of the stimulus artifact and the action potential at 10% of its peak amplitude.
Reagents.
Drugs were prepared as concentrated stock solutions. Nifedipine (20 mM; Sigma), 6,7-dinitroquinoxaline-2,3-dione (DNQX, 30 mM; Tocris), MK-801 (20 mM; Tocris), and CGP-55845 (10 mM; Tocris) were dissolved in DMSO. Bicuculline methiodide (10 mM; Sigma or Tocris) and CGP-37849 (5 mM; Tocris) were dissolved in distilled water, and D-AP5 (Acros Organics) was dissolved in equimolar NaOH (100 mM) or distilled water (50 mM). Stock solutions were diluted to the final concentration by addition to the ACSF perfusing the tissue. Salts and all other reagents were from Sigma or Fisher.
Data analysis.
Data were collected and initially analyzed with WinWCP or WinEDR software. Additional analysis was performed with Origin (OriginLab), Gnumeric (http://www.gnome.org/projects/gnumeric/), R (http://www.r-project.org/), and custom programs written in the Python language. Values are reported as means ± 1 SE. Statistical comparisons between two groups were made by two-tailed t-tests (paired or unpaired, as appropriate) and, when more than two groups were compared, analysis of variance followed by Tukey's honestly significant difference test. For all tests of statistical significance, P < 0.05 was considered significant.
RESULTS
EPSP depression during HFS.
As we reported previously (Grover et al. 2009), excitatory synaptic transmission was progressively depressed during 100-Hz HFS (see Fig. 1). We examined both single-cell EPSPs recorded by whole cell current clamp (Fig. 1A) and extracellular fEPSPs (Fig. 1B). Both EPSPs (n = 6) and fEPSPs (n = 8) were transiently facilitated at the beginning of HFS but rapidly depressed as HFS continued. After only 200 ms (20 stimuli), EPSPs were significantly reduced to 70.9 ± 6.3% (P < 0.01) of their initial response level and remained depressed through the end of the 800-ms period of HFS (52.4 ± 6.2%, P < 0.001). A similar depression was observed in fEPSPs during HFS: after 200 ms fEPSPs were significantly (P < 0.00001) reduced to 35.8 ± 4.7% of their initial response level and continued to be strongly depressed through the end of 100-Hz HFS (31.0 ± 5.2%, P < 0.00001, at 1,600 ms).
Fig. 1.
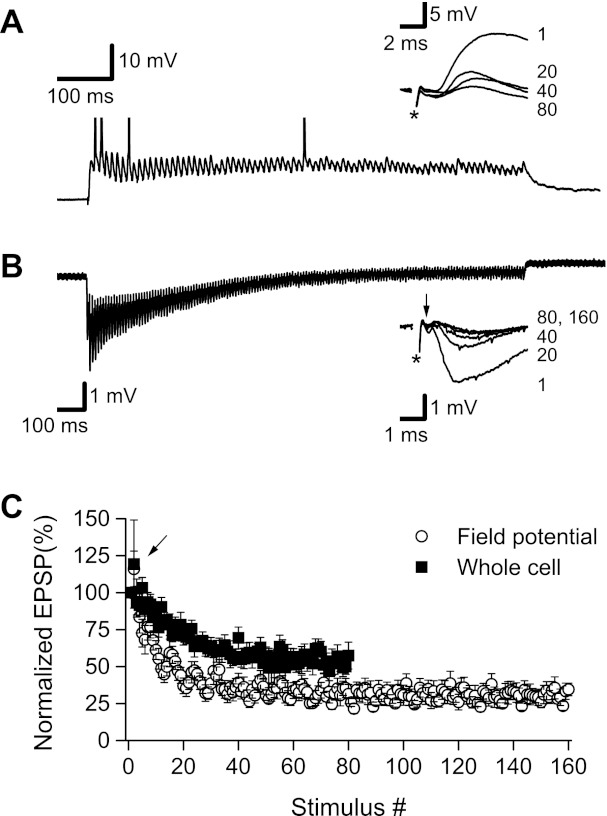
Excitatory synaptic transmission became strongly depressed during 100-Hz high-frequency stimulation (HFS). A: sample whole cell recording showing response to an 800-ms, 100-Hz stimulus train. During the first few stimuli, excitatory postsynaptic potentials (EPSPs) facilitated and summed, depolarizing the membrane above spike threshold and triggering action potentials (peaks clipped); however, as HFS continued, EPSPs became depressed. Inset: superimposed individual EPSPs from stimuli 1, 20, 40, and 80 in the stimulus train. Stimulus artifacts (*) were partially blanked. B: sample field potential recording showing response to a 1,600-ms, 100-Hz stimulus train. Field EPSPs (fEPSPs) initially facilitated and summed but quickly became depressed as HFS was continued. Inset: superimposed fEPSPs from stimuli 1, 20, 40, 80, and 160 in the stimulus train. Stimulus artifacts (*) were partially blanked. Afferent fiber volleys are indicated by downward pointing arrow. Both fiber volleys and fEPSPs were reduced during 100-Hz HFS. C: summary graph of results from 6 whole cell recordings and 8 field potential recordings. Whole cell and fEPSP slopes were normalized as % of the first response, and then normalized slopes were averaged and plotted as mean ± 1 SE. For both whole cell and field potential recordings, EPSPs were facilitated during the second stimulus (arrow) but were strongly depressed after only 20 stimuli (200 ms of HFS), with a steady-state level of depression reached after 40 stimuli (400 ms of HFS).
Minimal stimulation-evoked EPSCs during HFS.
Synaptic vesicle depletion could explain the rapid decrease in EPSPs that occurs during HFS. Vesicle depletion and several other mechanisms of depression (e.g., propagation failure) predict an increase in transmission failures when single afferent fibers are stimulated at 100 Hz. We used the minimal stimulation technique to test for failures during 100-Hz HFS. Stimulus intensity was adjusted initially during low-frequency stimulation to produce apparent single-fiber EPSCs (see materials and methods), and this stimulus intensity was then used for 100-Hz HFS (800-ms duration). So that we could quantify any changes in the probability of failures during HFS, we repeated HFS multiple (4–20) times during each recording. This allowed us to estimate the probability of failure at each stimulus position in the 100-Hz stimulus train. As shown in Fig. 2A, for any single train of HFS, EPSCs were quite variable across the 80 stimuli in the train; however, the probability of observing a failure clearly increased with stimulus number within the train. This effect was quantified for each recording by calculating the fraction of failures at each stimulus position and then averaging across all six recordings (Fig. 2B). For the first stimulus the proportion of failures obtained by this procedure was 0.57 ± 0.07. The proportion of failures decreased to 0.25 ± 0.10 during the second stimulus (P < 0.02), consistent with the EPSP facilitation shown in Fig. 1. The proportion of failures remained reduced for stimuli 2–5, before recovering to the initial value, and then progressively increasing. For the final 10 stimuli, the failure rate increased to 0.86 ± 0.04, which was significantly greater than the initial failure rate (P < 0.04). In agreement with the increased failure rate, mean EPSC amplitude (including stimuli with failures) decreased from −11.0 ± 1.3 pA to −6.1 ± 1.3 pA (54.6 ± 6.0% of original amplitude), a change that was not significantly different from the change in whole cell-recorded EPSPs (52.4 ± 6.2%, P > 0.75).
Fig. 2.
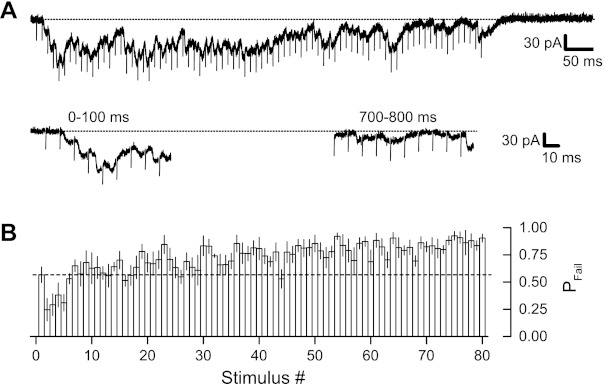
Minimal stimulation-evoked excitatory postsynaptic currents (EPSCs) showed increased failure rate during 100-Hz HFS. A: synaptic currents recorded from 1 cell during an 800-ms, 100-Hz HFS are shown at top, with currents from the beginning (0–100 ms) and end (700–800 ms) of HFS shown at bottom. Early during 100-Hz HFS synaptic failures were relatively rare, but failures became increasingly common with time during HFS. B: a total of 6 cells (in 6 different slices) were examined. HFS was repeated up to 20 times in each cell in the presence of d-2-amino-5-phosphonopentanoic acid (D-AP5) and nifedipine. The proportion of failures (Pfail) for each of 80 stimuli in the HFS was determined separately for each cell and then averaged across cells to produce this summary graph. The proportion of failures decreased from the first to the second stimulus and remained low for several stimuli before returning to the initial level, and then gradually rising to a much higher level. Dotted lines in A indicate holding current level; dashed line in B indicates initial proportion of failures. Stimulus artifacts in A were partially removed.
An increase in the proportion of failures during HFS is expected if vesicle depletion underlies the synaptic depression that occurs during 100-Hz stimulation. However, this observation is also consistent with stimulus-dependent propagation failures. We observed a progressive increase in response latency across stimuli during 100-Hz HFS (Fig. 3) that is not explained by vesicle depletion. For minimal stimulation-evoked EPSCs this latency increase averaged 0.75 ± 0.36 ms. A similar increase in latency (0.89 ± 0.12 ms) was also present in whole cell recordings of EPSPs. In addition, close inspection of field potential records indicated that presynaptic fiber volleys, when discernible, decreased in amplitude during 100-Hz HFS (see Fig. 1B, inset). Collectively, these observations suggested a change in presynaptic axon function during 100-Hz HFS.
Fig. 3.
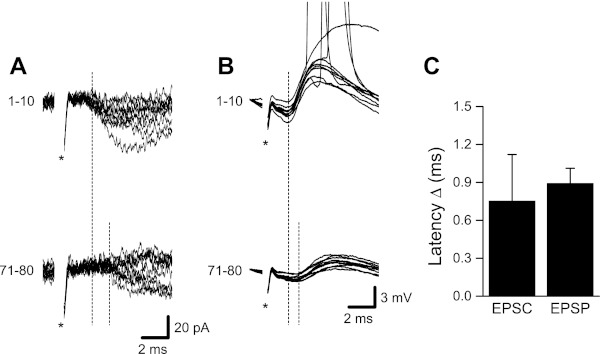
Increased response latency during whole cell recordings. Close inspection of EPSPs and EPSCs revealed an increase in response latency during 100-Hz HFS. A: example showing increased latency for minimal stimulation-evoked EPSCs. Responses recorded during the first 10 stimuli at 100 Hz are shown superimposed at top, and responses from the final 10 stimuli of the 800-ms stimulus train are shown at bottom. B: example showing increased latency for EPSPs during 100-Hz stimulation (top, first 10 responses superimposed; bottom, last 10 responses). C: mean increase in EPSC and EPSP latency over 800 ms of 100-Hz HFS (data taken from the same recordings shown in Figs. 1 and 2; both n = 6). Stimulus artifacts (*) in A and B were partially removed.
Presynaptic fiber volleys during HFS.
Under standard recording conditions, presynaptic fiber volleys are small and can be contaminated by the much larger fEPSPs, making quantification difficult. To allow more accurate measurement, we recorded afferent volleys with fEPSPs blocked by the AMPA receptor antagonist DNQX (30 μM; n = 4) or a combination of DNQX and the NMDA receptor antagonist D-AP5 (50 μM; n = 4); because there were no differences between recordings made with DNQX and DNQX + D-AP5, data were combined. With fEPSPs blocked, fiber volleys showed a consistent pattern of change during 100-Hz HFS. During the initial 10–20 stimuli, fiber volleys increased slightly in amplitude (Fig. 4A) and decreased slightly in latency (Fig. 4B). As 100-Hz stimulation continued, however, fiber volleys became progressively smaller and slower (Fig. 4). By the end of an 800-ms, 100-Hz HFS, afferent volleys were reduced to 39.6 ± 6.4% of their original amplitude (P < 0.01). As we observed above for EPSCs and EPSPs, fiber volley latencies also increased during HFS (mean increase of 0.41 ± 0.07 ms; P < 0.005). Because fiber volleys, field and whole cell EPSPs, and EPSCs all showed decreased amplitude and increased latency, the synaptic depression we observed can be explained by altered presynaptic axon function.
Fig. 4.
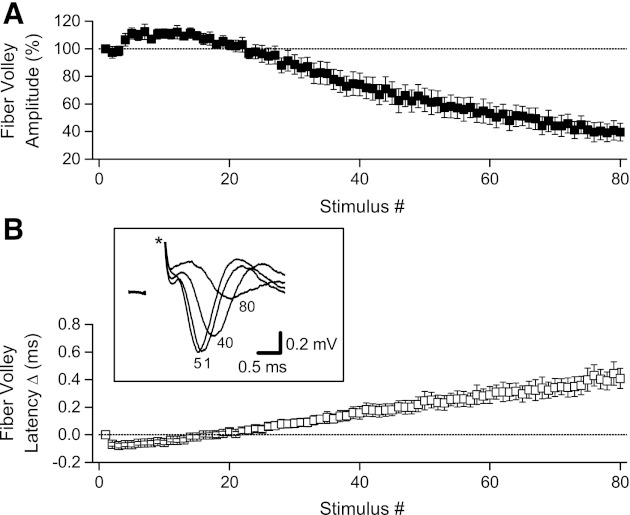
Changes in afferent fiber volley amplitude and latency during 100-Hz HFS. Fiber volleys were examined with fEPSPs blocked by 30 μM 6,7-dinitroquinoxaline-2,3-dione (DNQX; n = 4) or 30 μM DNQX + 50 μM D-AP5 (n = 4). A: fiber volley amplitude, normalized relative to the first stimulus, increased during the first several stimuli at 100 Hz but then progressively decreased. B: fiber volley latencies initially decreased during the first several stimuli but then progressively increased. Inset: sample recording from 1 slice showing superimposed fiber volleys recorded in response to stimuli 1, 5, 40, and 80 during 100-Hz HFS; stimulus artifacts (*) were partially removed.
Synaptic depression and reduced fiber volleys were not experimental artifacts.
The electrical properties of stimulating electrodes can change during HFS (“electrode polarization”; Bollinger and Gerall 1971; Smith et al. 1967; Wetzel et al. 1969), so that less charge is delivered to the slice with successive stimuli. If our stimulating electrodes changed in this way, then the fiber volley and synaptic depression that we observed might be an artifact. To test this potential source of artifact, we monitored stimulation efficacy directly, by measuring the voltage drop across a resistor inserted in series with the stimulating electrode (see materials and methods). This voltage drop is proportional to current delivered to the slice, and any change in the measured voltage would indicate a change in stimulation efficacy. As shown in Fig. 5A, 1,600 ms of 100-Hz HFS substantially depressed both fEPSPs recorded in ACSF (to 11.6 ± 1.5% of original slope; n = 2, P < 0.02) and fiber volleys recorded in 30 μM DNQX (to 22.1 ± 4.2% of original amplitude; n = 10, P < 0.001) but did not change the stimulus current delivered to the slices (at the end of 1,600 ms of HFS, voltage drop = 99.4 ± 0.5% of original peak-to-peak amplitude; n = 12, P > 0.25).
Fig. 5.
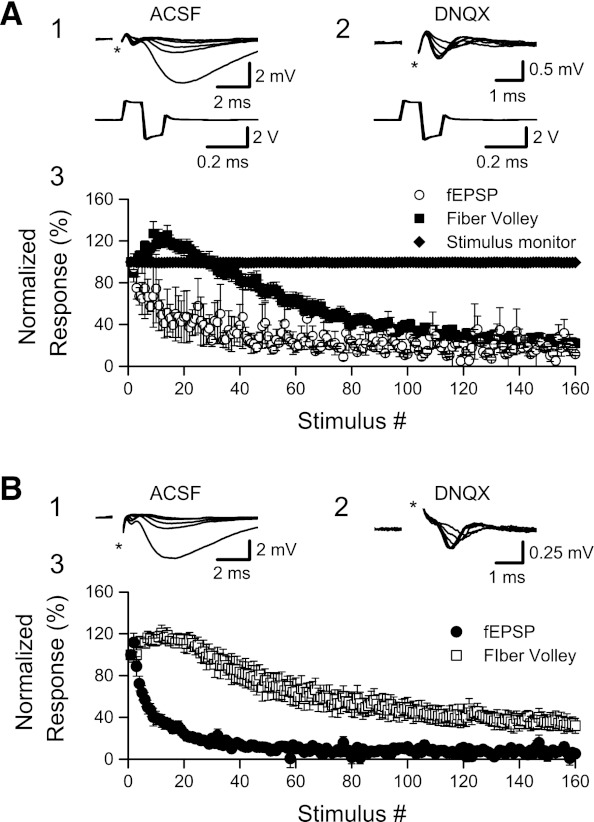
EPSP and fiber volley depression are not the result of an artifactual reduction in stimulation efficacy. A: there was no measurable change in stimulus current during 100-Hz HFS. fEPSPs were measured in artificial cerebrospinal fluid (ACSF), and fiber volleys were measured with AMPA receptors blocked by DNQX. Stimulus current was monitored by measuring the voltage drop across a 10,000-Ω resistor placed in series with a bipolar stainless steel stimulating electrode. 1: Superimposed recordings of fEPSPs (top) and stimulus current monitor (bottom, note the different timescale) during stimuli 1, 10, 20, 40, 80, and 160 of a 1,600-ms, 100-Hz HFS. 2: DNQX was applied (same slice as in 1), and isolated fiber volleys were recorded during a second 1,600-ms, 100-Hz HFS (responses during stimuli 1, 10, 20, 40, 80, and 160 are shown). Field potentials are shown at top, and stimulus current monitor at bottom. 3: Normalized fEPSP slopes (in ACSF, n = 2), fiber volley amplitudes (in ACSF + DNQX, n = 10), and stimulus current (n = 12) amplitudes (peak to peak) during 1,600 ms of HFS (100 Hz). As shown in Figs. 1 and 4, fEPSPs depressed rapidly during HFS, whereas fiber volleys showed an initial, small enhancement followed by a large depression. There was no change in stimulus current delivered to slices during 100-Hz HFS. B: fEPSP and fiber volley depression were still observed when an ACSF-filled glass micropipette was used for stimulation. The glass micropipette was connected to the stimulator by a sliver/silver chloride wire. 1: Superimposed recordings of fEPSPs during stimuli 1, 10, 20, 40, 80, and 160 of a 1,600-ms, 100-Hz HFS. 2: Isolated fiber volleys during 1,600-ms, 100-Hz HFS (stimuli 1, 10, 20, 40, 80, and 160). 3: Normalized fEPSP slopes (n = 9) and fiber volley amplitudes (n = 6) during 1,600 ms of HFS (100 Hz) when a glass micropipette was used for stimulation. Similar effects on fEPSPs and fiber volleys were obtained regardless of the type of stimulating electrode used. Stimulus artifacts (*) were partially removed in A and B.
As a second test for a possible stimulating electrode artifact, we conducted an additional set of control experiments using glass micropipettes (whole cell patch electrodes) filled with ACSF as stimulating electrodes. These glass micropipettes were connected to the stimulator by a chlorided silver wire. Given the differences in materials, if our stimulating electrodes were subject to a polarization artifact, then the magnitude of polarization and consequently the change in fiber volley and fEPSP should change with the type of stimulating electrode used. However, as Fig. 5B shows, fEPSPs and fiber volleys showed similar changes when 100-Hz HFS was given with monopolar glass stimulating electrodes (Fig. 5B) and bipolar metal stimulating electrodes (Figs. 1 and 4). These findings rule out an artifactual decrease in stimulation effectiveness as an explanation for the depression of synaptic transmission and presynaptic fiber volley that we observed during HFS.
Antidromic action potentials during HFS.
Decreased fiber volley amplitude during 100-Hz HFS could result from several distinct changes in presynaptic axon function, including decreased action potential amplitude in single axons, increased action potential failure, or desynchronization among the population of axons that contribute to the measured field potential. Any of these changes, independently or in combination, would cause a decrease in recorded fiber volley amplitude. To learn which of these changes occur during HFS, we made whole cell current-clamp recordings from CA3 pyramidal cells (n = 12) and recorded antidromic action potentials evoked by stimulation of Schaffer collateral fibers—the same axons that contribute to fiber volleys we recorded extracellularly in area CA1.
In all cells examined, action potential amplitude decreased during HFS (see Figs. 6 and 7). In some cells, mean action potential amplitude decreased by as much as 90% during HFS, although smaller decreases (15–45%) were typical (Fig. 7A). Action potentials recorded from pyramidal neuron somata and evoked by somatic or dendritic stimulation include two major components reflecting action potential initiation at the axon initial segment followed by a somato-dendritic action potential; these two components can be separated by time derivative (dV/dt) and phase-plane analysis of the action potential (reviewed in Bean 2007). The antidromic action potentials that we recorded contain the same two components. For each recording, dV/dt was determined by the calculating the instantaneous slope of the recorded membrane potential during 100-Hz HFS (Fig. 6, B and C). Phase-plane plots (Fig. 6D) were constructed by plotting the calculated dV/dt against the recorded membrane voltage. This analysis allowed separation of the axon initial segment and somato-dendritic components. When separated in this way, and plotted against stimulus number during HFS, it was apparent that the overall decrease in action potential amplitude (Fig. 7A) reflected equivalent changes in the axon initial segment (Fig. 7B) and somato-dendritic (Fig. 7C) components. For quantitative comparison, dV/dt values for the initial segment and somato-dendritic components were averaged over the second half of the 100-Hz HFS (stimuli 81–160) and normalized relative to the initial value (stimulus 1). We averaged over the second half of the HFS because the high failure rate resulted in relatively few action potentials (see Fig. 7D); even over this 800-ms period, fewer than half of the cells (5 of 12) fired. For the cells that fired during the second half of the HFS, the initial segment component was reduced to 47.7 ± 12.7% of the initial level and the somato-dendritic component was reduced to 45.9 ± 10.0% of the initial level. These values were not significantly different (P > 0.75).
Fig. 6.
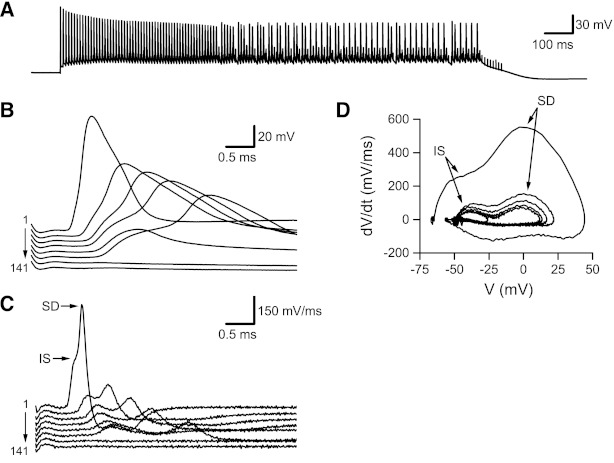
Changes in antidromic action potentials recorded from CA3 pyramidal neurons during 100-Hz HFS. The recording shown here was obtained with a cocktail of glutamate and GABA receptor antagonists (see materials and methods) to prevent synaptically evoked action potentials. Antidromic action potentials were evoked by stimulating Schaffer collateral fibers in stratum radiatum at the border of areas CA3 and CA1. A: membrane potential recording during 100-Hz HFS (1,600-ms duration). Action potential amplitude decreased steadily during the first 2–300 ms of HFS. After ∼600 ms of HFS, antidromic action potentials appeared at 2 alternating amplitudes. Antidromic action potentials completely failed during the final 100 ms of HFS. B: responses evoked by every 20th stimulus (from stimulus 1 to stimulus 141) during the 100-Hz HFS shown in A. To facilitate comparison of amplitude and latency changes, the resting membrane potential has been subtracted and succeeding responses are shown with small downward shifts. C: the membrane potential records from B were differentiated to yield instantaneous slope (dV/dt). To facilitate comparison, differentiated waveforms are shown shifted along the vertical axis. D: phase-plane plots for every 20th stimulus (from stimulus 1 to stimulus 141) during the 100-Hz HFS shown in A. Each curve is a plot of instantaneous slope (dV/dt, from C) vs. membrane potential (V, from B). Arrows in C and D point to axon initial segment (IS) and somato-dendritic (SD) components.
Fig. 7.
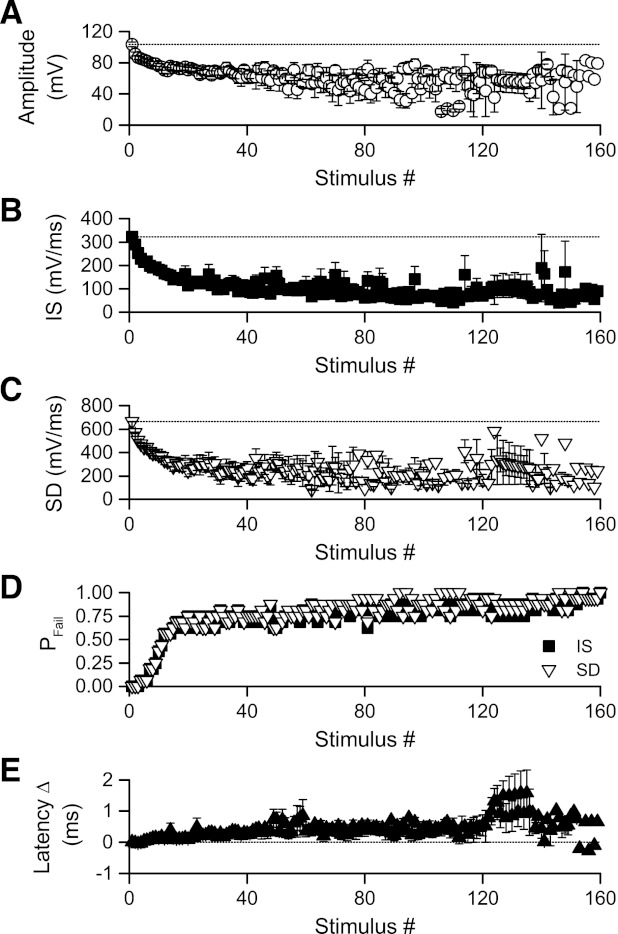
Summary of changes in Schaffer collateral antidromic action potentials during 100-Hz HFS. Antidromic action potentials were recorded during 17 rounds of 1,600-ms, 100-Hz HFS delivered to 12 CA3 pyramidal neurons (5 neurons received 2 trains of HFS). A: mean action potential amplitude plotted against stimulus number during 100-Hz HFS. Amplitude measurements were not included for stimuli that failed to evoke an action potential. Action potential amplitude decreased rapidly at the beginning of HFS, then declined at a slower rate as HFS was continued. B and C: peak dV/dt values for axon IS (B) and SD (C) spike components plotted against stimulus number during 100-Hz HFS. Both components changed equally during HFS, with rapid decreases during the first 200 ms of HFS followed by slower declines as HFS was continued. Measurements were not included for stimuli that failed to evoke an action potential. D: proportion of axon IS and SD failures plotted against stimulus number for all 17 rounds of HFS in 12 cells. For both IS and SD components, the probability of action potential failure increased rapidly during the first 200 ms, then slowly increased as HFS continued. By the end of the 1,600-ms period of HFS, action potentials failed in virtually all recordings. E: on average, antidromic action potential latency was slightly decreased during the first few stimuli, but this change was brief, small, and present in only 2/3 of the cells examined. For each cell, latency increased progressively until action potentials began failing. Measurements were not included for stimuli that failed to evoke an action potential. The increased variability during HFS seen in A–C and E is a consequence of the large increase in action potential failure rate during HFS, and the consequent decrease in the number of cells contributing to the mean values that were plotted.
In some recordings, including the example shown in Fig. 6, action potentials appeared with two discrete amplitudes during HFS, one somewhat smaller than the initial amplitude and a second much smaller than the initial amplitude. Close inspection of action potential waveforms (Fig. 6B) suggested that the smaller-amplitude action potentials might represent the failure of axonal action potentials to trigger somato-dendritic firing. This suggestion was confirmed in phase-plane plots (Fig. 6D), where the failure of the somato-dendritic component was clearly evident. Although somato-dendritic firing sometimes failed even when axonal firing did not (with antidromic stimulation, the converse is not possible), as shown by the example in Fig. 6A, the overall failure rates—across all 12 cells—for axon and somato-dendritic spikes were nearly the same (Fig. 7D). In other words, failure of somato-dendritic firing was almost always the result of failure of the axonal action potential. In all 12 cells, antidromic action potentials failed at some point during HFS; however, the timing of failure was quite variable, with the stimulus number where the first failure occurred ranging between 4 and 121. After the first action potential failure, cells displayed three patterns of firing during the remainder of the HFS. Most commonly (6 of 12 cells recorded, see Fig. 6), we observed short periods of action potential failure, consisting of 1 to as many as 15 consecutive stimuli, interspersed with firing. In 4 of the 12 cells, action potentials failed early during HFS and were not observed again during the same HFS. In two cells, action potentials failed early but reappeared later during HFS after a long delay (200–800 ms). In five cells, HFS was repeated a second time. When HFS was repeated in the same cell, the same basic pattern was observed.
In 8 of the 12 cells examined, action potential latency initially decreased during HFS, but the reliability, magnitude (0.06 ± 0.05 ms), and persistence of this change were smaller than in the previous fiber volley recordings. However, in all 12 cells, action potential latency increased later during the HFS (Fig. 7E), as seen previously in the fiber volley recordings. Because of the increasing probability of action potential failure during HFS, to compare the latency changes for fiber volleys with antidromic action potentials we averaged responses over the time period between 710 and 800 ms after the start of HFS (stimuli 71–80). During this period, antidromic action potential latency increased by a mean of 0.51 ± 0.15 ms, a value similar to the latency increase seen for fiber volleys at the same point during HFS, 0.39 ± 0.08 ms.
Frequency dependence of altered afferent excitability and excitatory synaptic transmission.
In the next set of recordings, we examined the frequency dependence of changes in presynaptic firing and excitatory synaptic transmission by varying the frequency of stimulation (160 stimuli delivered at 10, 20, 50, and 100 Hz), and measuring changes in fiber volley amplitude (n = 16 slices, in 30 μM DNQX) and fEPSP slope (n = 14 slices, in 50 μM D-AP5 + 20 μM nifedipine). Stimulation at 10 or 20 Hz had little effect on fiber volley amplitudes (Fig. 8A), with fiber volleys over the final 10 stimuli (stimuli 151–160) averaging 89.9 ± 3.7% and 91.8 ± 3.1% of the initial amplitude, respectively. Increasing the stimulation frequency to 50 Hz led to an early enhancement of fiber volley amplitude, peaking at 120.3 ± 3.8% (stimulus 16), followed by a gradual decrease to 67.3 ± 3.4% over the final 10 stimuli. When stimulation was increased to 100 Hz, both the early enhancement (127.2 ± 6.9% at stimulus 14) and the later depression (38.2 ± 4.4% over the final 10 stimuli) were increased. Analysis of variance for the normalized fiber volley amplitudes over the final 10 stimuli indicated a significant main effect (P < 0.001), with post hoc paired comparisons showing no differences between 10 and 20 Hz but significant differences between 50 Hz and either 10 or 20 Hz (P values < 0.001) and significant differences between 100 Hz and 10, 20, or 50 Hz (P values < 0.001). In addition to the amplitude changes described above, fiber volley latencies also changed in a frequency-dependent manner. We compared the mean latency change over the final 10 stimuli (stimuli 151–160) among the four frequencies using analysis of variance and found a significant difference (P < 0.001). Pairwise comparisons revealed no significant difference between 10-Hz (mean increase in latency of 0.19 ± 0.02 ms) and 20-Hz (mean latency change of 0.26 ± 0.03 ms; P > 0.65) stimulation. Stimulation at 50 Hz produced an increase in fiber volley latency of 0.44 ± 0.05 ms, which was significantly greater than at 10 Hz (P < 0.005) but not 20 Hz (P = 0.056). Increasing the stimulation frequency to 100 Hz caused a further increase in fiber volley latency to 0.67 ± 0.07 ms, which was significantly greater than at 10, 20, or 50 Hz (P values < 0.001, 0.001, and 0.01, respectively).
Fig. 8.
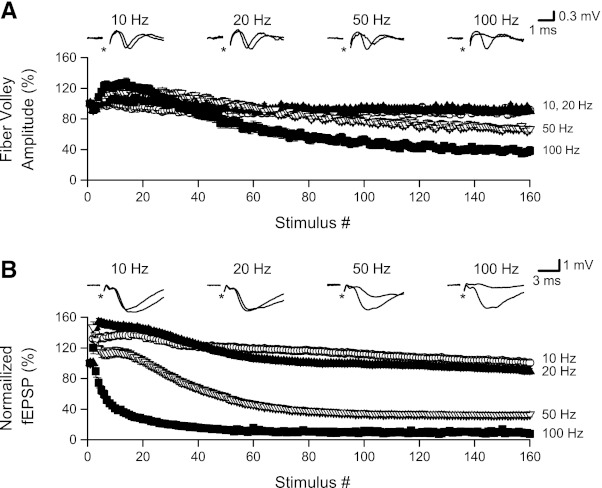
Stimulation at ≥50 Hz caused fiber volley and fEPSP depression. Data shown here are from slices that were given repeated trains of 160 stimuli at 10–100 Hz. A: normalized fiber volley amplitudes plotted against stimulus number during HFS at 10, 20, 50, and 100 Hz. Insets: responses (stimuli 1 and 160) from a representative slice. Although fiber volley latencies increased during HFS at 10 and 20 Hz (see insets), amplitudes were not depressed. Fiber volley amplitudes were depressed by HFS at 50 Hz and were further depressed when HFS was increased to 100 Hz. B: fEPSP slopes plotted against stimulus number during HFS at 10, 20, 50, and 100 Hz. Insets: responses (stimuli 1 and 160) from a representative slice. Although fEPSP latencies appeared to increase slightly during stimulation at 10 and 20 Hz, fEPSP slopes were not depressed during stimulation at these lower frequencies. Increasing stimulation frequency to 50 and 100 Hz caused progressively greater depression of fEPSPs.
To assess the frequency dependence of synaptic depression, we recorded fEPSPs during stimulation at 10–100 Hz. fEPSP slopes were normalized as percentage of the initial (stimulus 1) slope. Stimulation at 10 Hz resulted in an initial facilitation of fEPSP slope, reaching a peak of 139.7 ± 6.5% at stimulus 15, but failed to cause synaptic depression, with fEPSP slopes over the final 10 stimuli averaging 102.7 ± 3.4% of initial slope. Increasing the stimulation frequency to 20 Hz caused a larger and more rapid facilitation (153.0 ± 5.5% at stimulus 3) but again failed to produce depression; fEPSP slopes over the final 10 stimuli averaged 91.7 ± 3.9% of initial slope. While analysis of variance showed a significant difference in normalized fEPSP slope among the four stimulation frequencies (P < 0.0001), there was no difference between 10- and 20-Hz stimulation (P = 0.062). Increasing stimulation frequency to 50 or 100 Hz resulted in smaller and apparently briefer facilitation: 146.8 ± 7.1% for 50-Hz stimulation (at stimulus 2) and 120.2 ± 7.9% for 100-Hz stimulation (also at stimulus 2). Assessment of the duration of facilitation is complicated by the onset of synaptic depression, which was substantial for both 50- and 100-Hz stimulation, reaching stable levels of 33.7 ± 3.1% and 9.4 ± 1.4% of initial response (measured over stimuli 151–160), respectively. The decreases in fEPSP slopes for both 50- and 100-Hz stimulation were significantly greater than for all lower frequencies of stimulation (all P values < 0.0001 for 50 vs. 10 or 20 Hz and 100 vs. 10, 20, or 50 Hz).
Effects of increased extracellular Ca2+ concentration.
Our data show that action potential conduction in Schaffer collaterals is suppressed during 50- to 100-Hz HFS. This alteration in presynaptic function might explain the synaptic depression that we observed during 50- to 100-Hz HFS. However, the relevance of conduction failure to synaptic depression might be questioned based on a previous report (Wessling and Lo 2002) that during sustained HFS (20 Hz), release of transmitter from Schaffer collateral axon terminals is limited by the rate at which the readily releasable pool is replenished. If the replenishment rate is low enough, then failure of action potentials to conduct reliably might not be causally relevant for transmitter release; in other words, even if action potentials were conducted with substantially higher probability of success, these additional action potentials might fail to release additional transmitter. To determine whether this consideration is relevant to our findings, we repeated one of the experiments from the Wessling and Lo (2002) paper.
In the Wessling and Lo (2002) paper, increasing the extracellular Ca2+ concentration (while maintaining overall divalent concentration by an equivalent decrease in extracellular Mg2+ concentration) failed to increase transmitter release across 80 stimuli given at 20 Hz. Before we could assess effects of extracellular Ca2+ on synaptic transmission during HFS, we first had to determine whether increasing extracellular Ca2+ would alter presynaptic excitability. To do this, we measured isolated fiber volleys (AMPA receptors blocked by 30 μM DNQX) during 20- and 100-Hz HFS in normal-Ca2+ ACSF (2.0 mM Ca2+, 2.0 mM Mg2+), after application of a high-Ca2+ ACSF (3.8 mM Ca2+, 0.2 mM Mg2+), and, finally, after washout with normal-Ca2+ ACSF. For each slice (n = 6), fiber volley amplitudes in both normal- and high-Ca2+ ACSF were normalized relative to the stimulus 1 amplitude in normal-Ca2+ ACSF (taken as the mean of the initial response amplitudes in normal-Ca2+ ACSF and after the washout of high-Ca2+ ACSF). Although there was a tendency for reduced amplitude of the initial fiber volley (stimulus 1) in high-Ca2+ ACSF, this difference was not significant (P values > 0.20, 0.13 for 20 and 100 Hz, respectively). Fiber volley amplitudes appeared to decrease more rapidly between stimuli 10 and 60 during both 20- and 100-Hz stimulation in high-Ca2+ ACSF (Fig. 9), but fiber volley amplitudes were not significantly different during the second half (stimuli 81–160) of either 20-Hz (P > 0.14) or 100-Hz (P > 0.80) stimulation.
Fig. 9.
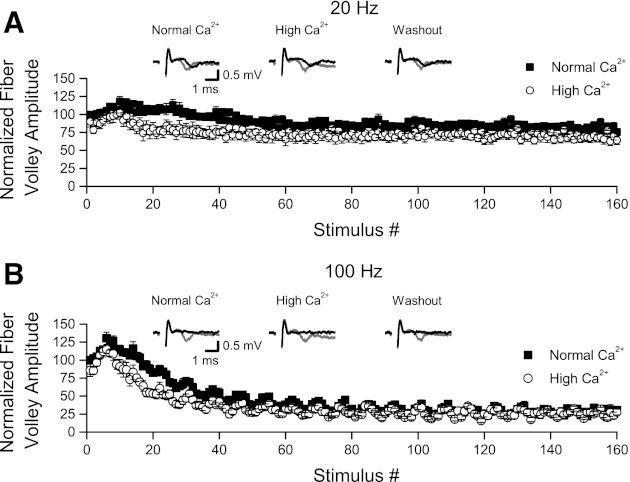
Fiber volleys during HFS were not enhanced by increasing extracellular Ca2+ concentration. Fiber volleys were isolated by application of 30 μM DNQX and recorded in normal (2.0 mM) and elevated (3.8 mM) extracellular Ca2+ (with Mg2+ concentration adjusted to maintain constant total divalent cation concentration). A: as shown above, fiber volleys recorded during 20-Hz HFS (n = 6 slices) showed an early, small increase in amplitude, peaking between stimuli 10 and 15, followed by a slowly developing, small decrement in amplitude. Application of high-Ca2+ ACSF led to a small decrease in fiber volley amplitude that was most apparent between stimuli 10 and 60; fiber volley amplitudes during the second half of the HFS were not different. Insets: representative fiber volleys from a single slice evoked by stimuli 1 (gray line) and 160 (black line) in normal-Ca2+ ACSF, during application of high-Ca2+ ACSF, and after washout in normal-Ca2+ ACSF. B: fiber volleys recorded during 100-Hz HFS (data from the same 6 slices in A). As shown above, both the early increase and the later decrement in fiber volley amplitudes were greater with 100-Hz vs. 20-Hz stimulation. As with 20-Hz stimulation, application of high-Ca2+ ACSF reduced fiber volley amplitudes between stimuli 10 and 60, but fiber volleys during the second half of the HFS were not different. Insets: representative fiber volleys from a single slice evoked by stimuli 1 (gray line) and 160 (black line) in normal-Ca2+ ACSF, during application of high-Ca2+ ACSF, and after washout in normal-Ca2+ ACSF.
Since fiber volleys during HFS were not altered during application of high-Ca2+ ACSF, we next compared synaptic transmission during 20- and 100-Hz stimulation in normal-Ca2+ ACSF, after application of the same high-Ca2+ ACSF used in the preceding fiber volley experiment. To quantify synaptic transmission during HFS, we summed the EPSC areas for responses recorded during stimuli 81–160 (corresponding to the period determined above where fiber volley amplitudes were unaffected by high Ca2+) and normalized the response area relative to the mean response area obtained in normal-Ca2+ ACSF. Examples of EPSCs recorded during 20- and 100-Hz HFS in normal- and high-Ca2+ are shown in Fig. 10, A and B. For all eight cells examined, normalized EPSC areas were increased in high-Ca2+ ACSF (Fig. 10C). This increase in EPSC area in high-Ca2+ ACSF (172.1 ± 29.1% for 20-Hz stimulation, 152.5 ± 20.7% for 100-Hz stimulation) was significant for both 20- and 100-Hz HFS (P values < 0.03). The significant increase in synaptic response that we obtained in high-Ca2+ ACSF contrasts with the negative result reported by Wessling and Lo (2002) and indicates that under our normal conditions the rate of transmitter release during HFS is not maximal, and therefore that reduced presynaptic axon function may contribute to synaptic depression.
Fig. 10.
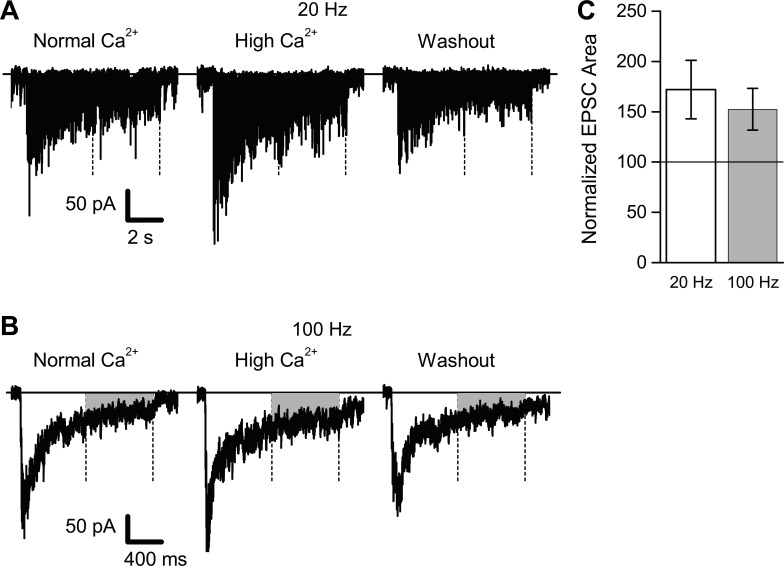
Synaptic transmission during HFS was enhanced by increasing extracellular Ca2+ concentration. EPSCs (n = 8 cells from 8 different slices) were recorded during 20- and 100-Hz stimulation in normal (2.0 mM) and elevated (3.8 mM) extracellular Ca2+ (with Mg2+ concentration adjusted to maintain constant total divalent cation concentration). A: representative example of EPSCs recorded during 8 s of 20-Hz HFS (160 stimuli total); EPSCs were recorded in normal-Ca2+ ACSF, during application of high-Ca2+ ACSF, and after washout in normal-Ca2+ ACSF. Holding current level is indicated by the solid horizontal line; the second half of the HFS (stimuli 81–160) is indicated by the two vertical dashed lines. B: representative example (same cell as shown in A) of EPSCs recorded during 1.6 s of 100-Hz HFS (160 stimuli total). C: data summary of all 8 recordings. Synaptic current areas during the second half of the HFS were summed and normalized relative to the EPSC area recorded in normal-Ca2+ ACSF. For both 20- and 100-Hz HFS, EPSC areas were significantly increased during application of high-Ca2+ ACSF.
DISCUSSION
Mechanisms for decreased afferent excitability during HFS.
As we demonstrate here, depression of excitatory synaptic transmission during 100-Hz HFS is associated with a large decrease in presynaptic axon excitability. These changes during HFS are not an experimental artifact caused by changes in electrical properties of the stimulating electrodes used for HFS but reflect real changes in neuronal function. Field potential recordings of fiber volleys showed a clear decrease in axon excitability during continuous 100-Hz HFS, with fiber volleys becoming progressively smaller in amplitude and appearing at progressively longer latency. Because the fiber volley is a population or compound action potential, these changes in amplitude and latency could reflect similar changes in amplitude and latency in individual Schaffer collateral axons forming a homogeneous population. Alternatively, these changes in the fiber volley might reflect an averaging of multiple distinct patterns of change in a heterogeneous population of axons, with the fiber volley changes resulting from a mix of reduced action potential amplitudes and action potential failures in a population of axons that becomes increasingly desynchronized during HFS.
To distinguish among these possibilities, we made whole cell current-clamp recordings from CA3 pyramidal cells and examined how antidromically conducted action potentials change during HFS of the Schaffer collateral axons. Our recordings of antidromic action potentials revealed variability among CA3 neurons, yet several consistent findings emerged. First, in all cells, antidromic action potential amplitude decreased during HFS. Analysis of axon initial segment and somato-dendritic components of antidromic action potentials revealed similar decreases in both. The decrease in the axon initial segment component during 100-Hz HFS suggests that at least a portion of the decreased fiber volley amplitude is due to reduced action potential amplitude in individual axons. This conclusion might be tempered by differences in voltage-dependent ion channel density and distribution between the axon initial segment and more distal portions of the axon (Clark et al. 2009; Kress and Mennerick 2009; Lai and Jan 2006; Vacher et al. 2008). Such differences also exist between initial segment and somato-dendritic membranes, however, and we observed essentially identical changes in action potential components corresponding to these two membrane areas. Second, in all cells, we saw an increase in action potential failures during HFS; increased action potential failure therefore also contributes to the decreased fiber volley amplitude. Third, in all cells, antidromic action potential latency increased during HFS, indicating that the increased fiber volley latency likely reflects similar changes in individual axons. Our data also suggest that desynchronization could contribute to the observed changes in fiber volleys. This possibility is supported by the variable response of individual CA3 neurons to HFS. In addition, because Schaffer collateral axons vary in conduction velocity (Soleng et al. 2003b), an increase in conduction velocity in individual members of this population will necessarily decrease synchronization.
Changes in axon excitability during HFS may reflect progressive ion channel inactivation and/or changes in extracellular ion concentration. For example, sodium channel inactivation contributes to paired-pulse depression at autaptic synapses in cultured hippocampal neurons (He et al. 2002). Also, changes in extracellular ion concentrations, including increased potassium and decreased sodium, occur during HFS of Schaffer collaterals (reviewed in Heinemann et al. 1990). Reduced extracellular sodium would directly affect action potential initiation and conduction, and increased extracellular potassium might promote sodium channel inactivation by depolarizing axon membranes or reducing the rate of action potential repolarization or the magnitude of afterhyperpolarization. Morphological factors may also contribute to changes in axon function during HFS. Schaffer collateral axons are highly branched and are periodically interrupted by synaptic varicosities (Raastad and Shepherd 2003; Shepherd and Harris 1998; Westrum and Blackstad 1962). Both of these structural elements represent potential locations for action potential conduction failure (Goldstein and Rall 1974; Lüscher and Shiner 1990). An increase in sodium channel inactivation, or altered extracellular ion concentrations during HFS, would increase the likelihood of conduction failure, which presumably underlies the increased failure rate for antidromic action potentials in CA3 neurons during HFS.
Decrease in afferent excitability contributes to synaptic depression during HFS.
A readily releasable pool of synaptic vesicles has been described at excitatory synapses onto hippocampal pyramidal cells. Some estimates of the size of this pool are quite small, between 5 and 20 vesicles (Dobrunz and Stevens 1997; Stevens and Tsujimoto 1995). Given a small pool size, and previous studies indicating vesicle depletion during continuous stimulation at lower frequencies (10 Hz, Dobrunz and Stevens 1997; 20–40 Hz, Wesseling and Lo 2002), vesicle depletion would be expected to contribute to the synaptic depression we obtained. While some of our data (discussed below) are consistent with a contribution of vesicle depletion, our findings emphasize a role for decreased excitability in presynaptic axons.
In support of a role for decreased presynaptic excitability, we only obtained synaptic depression when HFS was given at frequencies of 50 and 100 Hz, the same frequencies that decreased fiber volleys. With 100-Hz HFS, antidromic action potentials ceased partway through the train in some cells, never to return; in other cells action potentials stopped and then resumed only after a long period of time; in still other cells action potentials failed intermittently with gaps in firing of 1–15 stimuli. Action potential failures, and in particular long periods of action potential failures, prevent maximal vesicle release from being achieved. Synaptic depression would occur independent of vesicle depletion, given the observed patterns of action potential failures. Also, our recordings of minimal stimulation-evoked EPSCs revealed that some release still occurs even at the end of 800 ms of 100-Hz HFS, and after several successive failures. Comparison of the average probability of release over the final 10 stimuli (0.14) with the average probability of successful action potential propagation (0.15) reveals that the probability of release, given that an action potential successfully propagates, is high (almost 1.0) at the end of these 100-Hz stimulus trains. These observations suggest that the releasable pool of vesicles is not completely depleted during the HFS we used. This suggestion was confirmed by our finding that increasing extracellular Ca2+ concentration could promote additional transmitter release during both 20- and 100-Hz HFS. Moreover, this increase in synaptic transmission occurred during the portion of 100-Hz HFS when EPSCs were strongly depressed. Additional evidence for a contribution of reduced afferent excitability to synaptic depression during HFS comes from the increases in EPSP and EPSC latencies during HFS that were similar to the latency increases for fiber volleys and antidromic action potentials. Collectively, our findings indicate that glutamate release from Schaffer collateral synaptic terminals onto CA1 pyramidal neurons during HFS is determined, at least in part, by the excitability of the presynaptic axons and their ability to successfully conduct action potentials. Our findings do not appear to be consistent with an easily depleted and slowly replenished pool of releasable vesicles. Although some estimates of releasable pool size are quite small (5–20 vesicles, as noted above), other studies indicate a much larger releasable pool of vesicles (∼100; Micheva and Smith 2005; Ryan et al. 1997). With a larger releasable pool, vesicle depletion would play less of a role and reduced afferent excitability more of a role in EPSP depression.
While the frequency dependence of synaptic depression matched the frequency dependence for fiber volley depression when the final response levels at the end of HFS were compared, the rates of these changes clearly differed. Synaptic depression began after ∼20 stimuli at 50 Hz and within 10 stimuli at 100 Hz, preceding fiber volley depression. This more rapid onset of synaptic depression would be consistent with a rapid, partial depletion of vesicles. On the other hand, antidromic action potentials recorded from CA3 neurons depressed more quickly than fiber volleys—with amplitude and failure rate changes within 10 stimuli during 100-Hz stimulation—suggesting that decreased axon excitability might contribute to even the rapid, initial phase of synaptic depression. In addition to a mismatch in the kinetics of synaptic and fiber volley depression, the final level of synaptic depression was greater than the final decrease in fiber volley amplitude. While this discrepancy may be explained by the combined effects of vesicle depletion and decreased axon excitability, it could simply reflect nonlinearity between presynaptic depolarization and transmitter release (Augustine et al. 1985; Dodge and Rahamimoff 1967).
Differences between fiber volley and antidromic action potential results.
In most respects, the changes in fiber volleys and antidromic action potentials during HFS were consistent. The most profound changes were decreased amplitude and increased latency, indicating a progressive reduction of axon excitability during continued HFS. Despite these overall similarities, the initial effects of HFS on fiber volleys and antidromic action potentials were different. During the first 100–200 ms, fiber volleys were slightly increased in amplitude and latencies were slightly decreased, suggesting an initial, small increase in axon excitability during HFS. While antidromic action potential latency decreased slightly in some CA3 cells, this finding was less consistent, smaller, and briefer than for fiber volleys. Moreover, we failed to see an early increase in action potential amplitude in any of the CA3 cells we recorded from, whereas we routinely observed early increases in fiber volley amplitude in CA1 field potential recordings. The fiber volley changes that occurred early during HFS, and that were not apparent in recordings of antidromic action potentials, might reflect an increase in synchronization of afferent firing or recruitment of firing in additional afferents, neither of which would be apparent in single-neuron whole cell recordings. Alternatively, these differences could be consequences of differences in ion channel expression or distribution among soma, axon initial segment, and distal axon membranes (Clark et al. 2009; Kress and Mennerick 2009; Lai and Jan 2006; Vacher et al. 2008).
Comparison to previous studies of activity-dependent changes in Schaffer collateral excitability.
The excitability of Schaffer collateral axons is affected by previous activity. Early studies of the fiber volley (Low and Bement 1980; Wigström and Gustafsson 1981) demonstrated a period of hyperexcitability following stimulus-evoked firing. This hyperexcitable period is reflected in a reduction of stimulation threshold that peaks at around 30 ms following the first evoked volley and persists for up to 200 ms. Later studies using single-axon recordings (Soleng et al. 2004) have shown a similar period of hyperexcitability (reduced threshold) following single evoked action potentials. Repetitive HFS also elicits periods of hyperexcitability where fiber volleys increase in amplitude and decrease in latency, but continued HFS depresses Schaffer collateral excitability. This depression of excitability is manifest by decreased fiber volley amplitude and increased latency (Poolos et al. 1987). In addition to stimulation frequency, stimulation pattern may affect axon function. Awatramani et al. (2007) recorded from single Schaffer collateral axons and found no change in excitability during prolonged theta burst stimulation (4 stimuli at 50 Hz per burst, with bursts repeated every 200 ms, for up to 60 s). However, the overall stimulation rate in the Awatramani et al. study was 20 Hz (5 bursts/s, with 4 stimuli in each burst), a frequency that in our recordings had little effect on fiber volley amplitude. It is possible that different results might be obtained between burst and continuous stimulation if higher overall stimulation rates were compared.
Several ionic mechanisms that may contribute to activity-dependent changes in Schaffer collateral excitability have been identified. HFS increases extracellular K+ concentration (Poolos et al. 1987). Small increases in K+ concentration in the ACSF perfusing slices have been shown to enhance Schaffer collateral excitability, but larger increases depress excitability (Meeks et al. 2005; Poolos et al. 1987). Increased perfusate K+ concentration also enhances the depression of excitability during HFS (Meeks and Mennerick 2004). Sodium channel inactivation most likely accounts for at least a portion of the reduced excitability during HFS and perfusion of elevated-K+ ACSF (Meeks and Mennerick 2004). Other voltage-dependent conductances contributing to use-dependent changes in Schaffer collateral excitability include A- or D-type potassium current (Debanne et al. 1997; Palani et al. 2010), which normally limits hyperexcitability, and the hyperpolarization-activated cation current, Ih, which is stimulated by firing rates above 1 Hz and partially counters the decrease in excitability that occurs during continued stimulation (Soleng et al. 2003a, 2004). Our observations of frequency-dependent enhancement and depression of Schaffer collateral fiber volleys are consistent with the previous reports summarized above. Some of the mechanisms identified in these previous reports, including altered extracellular K+ concentration and sodium channel inactivation, are quite likely to have contributed to the fiber volley changes we observed. The contribution of other potential mechanisms are less certain. While Soleng et al. (2003a) demonstrated H-current activation for stimulation frequencies above 1 Hz, the highest frequency these investigators reported examining was 5 Hz, whereas the lowest stimulation we used was 10 Hz. During stimulation at higher frequencies, axon membrane potential may not hyperpolarize to the range needed for H-current activation, and even if H current activates during stimulation at these frequencies, its relative contribution may be small compared with other mechanisms, such as sodium channel inactivation. While A-type potassium channels may be important regulators of Schaffer collateral excitability during the first tens of milliseconds of HFS, the rapid inactivation of these channels makes it unlikely that they contribute to excitability changes that occur after several hundred milliseconds of HFS.
Relevance for long-term potentiation.
Decreased axon excitability makes a major contribution to synaptic depression during continuous stimulation at frequencies that are typically used for LTP induction. At most synapses, including the Schaffer collateral-CA1 pyramidal cell synapses we studied here, LTP induction requires postsynaptic, voltage-dependent Ca2+ influx. During continuous HFS, postsynaptic depolarization decreases as EPSPs become depressed, and voltage-dependent Ca2+ influx should decrease. As a consequence of this synaptic depression, stimulation of the Ca2+-dependent signaling pathways that are required for LTP induction will be suboptimal. When HFS is given as multiple short bursts, synaptic depression is avoided and LTP induction is enhanced (Grover et al. 2009). In addition to the greater efficacy of burst stimulation for LTP induction, it has been argued that burst stimulation is more physiological, since it more closely matches endogenous activity patterns in the hippocampus (Albensi et al. 2007; Grover et al. 2009; Larson et al. 1986). Our present findings show that Schaffer collateral axons conduct with poor fidelity during continuous HFS. Not only is continuous HFS nonphysiological, CA3 neurons are poorly adapted for transmitting information through continuous high-frequency firing.
GRANTS
This work was supported by National Institute on Alcohol Abuse and Alcoholism Grant AA-014294 through the CRCNS (Collaborative Research in Computational Neuroscience) Program.
DISCLOSURES
No conflicts of interest, financial or otherwise, are declared by the author(s).
AUTHOR CONTRIBUTIONS
Author contributions: E.K., B.O., W.R.H., and L.M.G. conception and design of research; E.K., B.O., and L.M.G. performed experiments; E.K., B.O., and L.M.G. analyzed data; E.K., B.O., W.R.H., and L.M.G. interpreted results of experiments; E.K., B.O., W.R.H., and L.M.G. edited and revised manuscript; E.K., B.O., W.R.H., and L.M.G. approved final version of manuscript; L.M.G. prepared figures; L.M.G. drafted manuscript.
ACKNOWLEDGMENTS
Present address of E. Kim: Molecular Neurophysiology and Biophysics Unit, Laboratory of Cellular and Synaptic Neurophysiology, National Institute of Child Health and Human Development, National Institutes of Health, Bethesda, MD 20892.
REFERENCES
- Albensi BC, Oliver DR, Toupin J, Capocchi G. Electrical stimulation protocols for hippocampal synaptic plasticity and neuronal hyper-excitability: are they effective or relevant? Exp Neurol 204: 1–13, 2007 [DOI] [PubMed] [Google Scholar]
- Augustine GJ, Charlton MP, Smith SJ. Calcium entry and transmitter release at voltage-clamped nerve terminals of squid. J Physiol 367: 163–181, 1985 [DOI] [PMC free article] [PubMed] [Google Scholar]
- Awatramani GB, Boyd JD, Delaney KR, Murphy TH. Effective release rates at single rat Schaffer collateral–CA1 synapses during sustained theta-burst activity revealed by optical imaging. J Physiol 582: 583–595, 2007 [DOI] [PMC free article] [PubMed] [Google Scholar]
- Bean BP. The action potential in mammalian central neurons. Nat Rev Neurosci 8: 451–465, 2007 [DOI] [PubMed] [Google Scholar]
- Blanton MG, Lo Turco JJ, Kriegstein AR. Whole cell recording from neurons in slices of reptilian and mammalian cerebral cortex. J Neurosci Methods 30: 203–210, 1989 [DOI] [PubMed] [Google Scholar]
- Bliss TV, Collingridge GL. A synaptic model of memory: long-term potentiation in the hippocampus. Nature 361: 31–39, 1993 [DOI] [PubMed] [Google Scholar]
- Blundon JA, Zakharenko SS. Dissecting the components of long-term potentiation. Neuroscientist 14: 598–608, 2008 [DOI] [PMC free article] [PubMed] [Google Scholar]
- Bollinger SF, Gerall AA. Intracranial self-stimulation and impedance as functions of electrode and stimulus source. Am J Physiol 220: 264–269, 1971 [DOI] [PubMed] [Google Scholar]
- Clark BD, Goldberg EM, Rudy B. Electrogenic tuning of the axon initial segment. Neuroscientist 15: 651–668, 2009 [DOI] [PMC free article] [PubMed] [Google Scholar]
- Debanne D, Guerineau NC, Gahwiler BH, Thompson SM. Action-potential propagation gated by an axonal IA-like K+ conductance in hippocampus. Nature 389: 286–289, 1997 [DOI] [PubMed] [Google Scholar]
- Dobrunz LE, Stevens CF. Heterogeneity of release probability, facilitation, and depletion at central synapses. Neuron 18: 995–1008, 1997 [DOI] [PubMed] [Google Scholar]
- Dodge FA, Jr, Rahamimoff R. Co-operative action a calcium ions in transmitter release at the neuromuscular junction. J Physiol 193: 419–432, 1967 [DOI] [PMC free article] [PubMed] [Google Scholar]
- Goldstein SS, Rall W. Changes of action potential shape and velocity for changing core conductor geometry. Biophys J 14: 731–757, 1974 [DOI] [PMC free article] [PubMed] [Google Scholar]
- Grover LM, Kim E, Cooke JD, Holmes WR. LTP in hippocampal area CA1 is induced by burst stimulation over a broad frequency range centered around delta. Learn Mem 16: 69–81, 2009 [DOI] [PMC free article] [PubMed] [Google Scholar]
- He Y, Zorumski CF, Mennerick S. Contribution of presynaptic Na+ channel inactivation to paired-pulse synaptic depression in cultured hippocampal neurons. J Neurophysiol 87: 925–936, 2002 [DOI] [PubMed] [Google Scholar]
- Heinemann U, Stabel J, Rausche G. Activity-dependent ionic changes and neuronal plasticity in rat hippocampus. Prog Brain Res 83: 197–214, 1990 [DOI] [PubMed] [Google Scholar]
- Holmes WR, Grover LM. Quantifying the magnitude of changes in synaptic level parameters with long-term potentiation. J Neurophysiol 96: 1478–1491, 2006 [DOI] [PubMed] [Google Scholar]
- Kress GJ, Mennerick S. Action potential initiation and propagation: upstream influences on neurotransmission. Neuroscience 158: 211–222, 2009 [DOI] [PMC free article] [PubMed] [Google Scholar]
- Lai HC, Jan LY. The distribution and targeting of neuronal voltage-gated ion channels. Nat Rev Neurosci 7: 548–562, 2006 [DOI] [PubMed] [Google Scholar]
- Larson J, Wong D, Lynch G. Patterned stimulation at the theta frequency is optimal for the induction of hippocampal long-term potentiation. Brain Res 368: 347–50, 1986 [DOI] [PubMed] [Google Scholar]
- Low WC, Bement SL. Enhancement of afferent fiber activity in hippocampal slices. Brain Res 198: 472–477, 1980 [DOI] [PubMed] [Google Scholar]
- Lüscher HR, Shiner JS. Simulation of action potential propagation in complex terminal arborizations. Biophys J 58: 1389–1399, 1990 [DOI] [PMC free article] [PubMed] [Google Scholar]
- Lynch MA. Long-term potentiation and memory. Physiol Rev 84: 87–136, 2004 [DOI] [PubMed] [Google Scholar]
- Meeks JP, Mennerick S. Selective effects of potassium elevations on glutamate signaling and action potential conduction in hippocampus. J Neurosci 24: 197–206, 2004 [DOI] [PMC free article] [PubMed] [Google Scholar]
- Meeks JP, Jiang X, Mennerick S. Action potential fidelity during normal and epileptiform activity in paired soma-axon recordings from rat hippocampus. J Physiol 566: 425–441, 2005 [DOI] [PMC free article] [PubMed] [Google Scholar]
- Micheva KD, Smith SJ. Strong effects of subphysiological temperature on the function and plasticity of mammalian presynaptic terminals. J Neurosci 25: 7481–7488, 2005 [DOI] [PMC free article] [PubMed] [Google Scholar]
- Palani D, Baginskas A, Raastad M. Bursts and hyperexcitability in non-myelinated axons of the rat hippocampus. Neuroscience 167: 1004–1013, 2010 [DOI] [PubMed] [Google Scholar]
- Poolos NP, Mauk MD, Kocsis JD. Activity-evoked increases in extracellular potassium modulate presynaptic excitability in the CA1 region of the hippocampus. J Neurophysiol 58: 404–416, 1987 [DOI] [PubMed] [Google Scholar]
- Raastad M, Shepherd GMG. Single-axon action potentials in the rat hippocampal cortex. J Physiol 548: 745–752, 2003 [DOI] [PMC free article] [PubMed] [Google Scholar]
- Raastad M, Storm JF, Andersen P. Putative single quantum and single fibre excitatory postsynaptic currents show similar amplitude range and variability in rat hippocampal slices. Eur J Neurosci 4: 113–117, 1992 [DOI] [PubMed] [Google Scholar]
- Ryan TA, Reuter H, Smith SJ. Optical detection of a quantal presynaptic membrane turnover. Nature 388: 478–482, 1997 [DOI] [PubMed] [Google Scholar]
- Shepherd GM, Harris KM. Three-dimensional structure and composition of CA3→CA1 axons in rat hippocampal slices: implications for presynaptic connectivity and compartmentalization. J Neurosci 18: 8300–8310, 1998 [DOI] [PMC free article] [PubMed] [Google Scholar]
- Smith JR, Nevis AH, Collins GH. Polarization impedance of stainless steel bipolar electrodes in brain. Exp Neurol 18: 287–299, 1967 [DOI] [PubMed] [Google Scholar]
- Soleng AF, Chiu K, Raastad M. Unmyelinated axons in the rat hippocampus hyperpolarize and activate an H current when spike frequency exceeds 1 Hz. J Physiol 552: 459–470, 2003a [DOI] [PMC free article] [PubMed] [Google Scholar]
- Soleng AF, Raastad M, Andersen P. Conduction latency along CA3 hippocampal axons from rat. Hippocampus 13: 953–961, 2003b [DOI] [PubMed] [Google Scholar]
- Soleng AF, Baginskas A, Andersen P, Raastad M. Activity-dependent excitability changes in hippocampal CA3 cell Schaffer axons. J Physiol 560: 491–503, 2004 [DOI] [PMC free article] [PubMed] [Google Scholar]
- Stevens CF, Tsujimoto T. Estimates for the pool size of releasable quanta at a single central synapse and for the time required to refill the pool. Proc Natl Acad Sci USA 92: 846–849, 1995 [DOI] [PMC free article] [PubMed] [Google Scholar]
- Turner DA. Waveform and amplitude characteristics of evoked responses to dendritic stimulation of CA1 guinea-pig pyramidal cells. J Physiol 395: 419–439, 1988 [DOI] [PMC free article] [PubMed] [Google Scholar]
- Vacher H, Mohapatra DP, Trimmer JS. Localization and targeting of voltage-dependent ion channels in mammalian central neurons. Physiol Rev 88: 1407–1447, 2008 [DOI] [PMC free article] [PubMed] [Google Scholar]
- Wesseling JF, Lo DC. Limit on the role of activity in controlling the release-ready supply of synaptic vesicles. J Neurosci 22: 9708–9720, 2002 [DOI] [PMC free article] [PubMed] [Google Scholar]
- Westrum LE, Blackstad TW. An electron microscopic study of the stratum radiatum of the rat hippocampus (regio superior, CA 1) with particular emphasis on synaptology. J Comp Neurol 119: 281–309, 1962 [DOI] [PubMed] [Google Scholar]
- Wetzel MC, Howell LG, Bearie KJ. Experimental performance of steel and platinum electrodes with chronic monophasic stimulation of the brain. J Neurosurg 31: 658–669, 1969 [DOI] [PubMed] [Google Scholar]
- Wigström H, Gustafsson B. Increased excitability of hippocampal unmyelinated fibres following conditioning stimulation. Brain Res 229: 507–513, 1981 [DOI] [PubMed] [Google Scholar]
- Zucker RS, Regehr WG. Short-term synaptic plasticity. Annu Rev Physiol 64: 355–405, 2002 [DOI] [PubMed] [Google Scholar]