

Abstract
Anatomical and pharmacological studies have shown that the lateral superior olive (LSO) receives inputs from a number of sources and that LSO cells can alter the balance of their own excitatory and inhibitory drive. It is thus likely that the ongoing sound-evoked responses of LSO cells reflect a complex interplay of excitatory and inhibitory events, which may be affected by anesthesia. The goal of this study was to characterize the temporal discharge patterns of single units in the LSO of unanesthetized, decerebrate cats in response to long-duration ipsilateral best-frequency tone bursts. A decision tree is presented to partition LSO units on the basis of poststimulus time histogram shape, adaptation of instantaneous firing rate as a function of time, and sustained discharge rate. The results suggest that LSO discharge patterns form a continuum with four archetypes: sustained choppers that show two or more peaks of activity at stimulus onset and little adaptation of rate throughout the response, transient choppers that undergo a decrease in rate that eventually stabilizes with time, primary-like units that display an initial peak of activity followed by a monotonic decline in rate to a steady-state value, and onset-sustained units that exhibit an initial peak of activity at stimulus onset followed by a low sustained activity. Compared with the chopper units, the nonchopper units tend to show longer first-spike latencies, lower peak firing rates, and more irregular sustained discharge patterns. Modeling studies show that the full range of LSO response types can be obtained from an underlying sustained chopper by varying the strength and latency of a sound-driven ipsilateral inhibition relative to that of excitation. Together, these results suggest that inhibition plays a major role in shaping the temporal discharge patterns of units in unanesthetized preparations.
Keywords: poststimulus time histograms, classification, regularity, latency, computational model
the lateral superior olive (LSO) is one of the first processing centers in the central auditory system that receives input from both ears. The primary inputs to the LSO originate from spherical bushy cells in the ipsilateral anteroventral cochlear nucleus (AVCN) and from globular bushy cells in the contralateral AVCN via a synapse in the medial nucleus of the trapezoid body (MNTB) (Cant 1991; Cant and Casseday 1986; Smith et al. 1993; Warr 1966, 1972). Smaller inputs to the LSO come from globular bushy and multipolar cells in the ipsilateral ventral cochlear nucleus (Doucet and Ryugo 2003; Friauf and Ostwald 1988; Smith et al. 1991; Thompson 1998; Thompson and Thompson 1991) and from the ipsilateral lateral (LNTB) and the contralateral ventral nuclei of the trapezoid body (Kuwabara and Zook 1992; Warr and Beck 1996). Some of the inputs to LSO cells are excitatory (CN bushy cells: Glendenning et al. 1991; Smith et al. 1998), whereas others are glycinergic and inhibitory (MNTB: Moore and Caspary 1983; LNTB: Spirou and Berrebi 1997; Wenthold et al. 1987). Given this diversity of inputs and the fact that LSO cells modulate the balance of their own excitatory and inhibitory drive (Kotak et al. 2001; Magnusson et al. 2008), it seems likely that the ongoing sound-evoked responses of LSO cells reflect a complex interplay between excitatory and inhibitory events.
The temporal discharge patterns of LSO units to ipsilaterally presented tone bursts have been examined in many species (cat: Caird and Klinke 1983; Guinan et al. 1972a, 1972b; Tollin and Yin 2002, 2005; Tsai et al. 2010; Tsuchitani 1977, 1982; Tsuchitani and Johnson 1985; chinchilla and rat: Finlayson and Caspary 1991; gerbil: Sanes and Rubel 1988; bat: Harnischfeger et al. 1985). These studies are in good agreement that most LSO units respond to such stimuli with a chopper-type discharge pattern, characterized by regularly spaced peaks of activity initially time-locked to the stimulus onset. In some cases, the interpeak interval is constant as a function of time (termed sustained choppers), whereas in other cases the intervals become more widely spaced with time (transient choppers). Few, if any, LSO units produce primary-like or onset-sustained discharge patterns, which show an initial peak of activity followed by a slow or rapid decline in rate, respectively, and have comparatively irregular sustained discharge patterns (Young et al. 1988).
This description, however, is based almost entirely on studies conducted in barbiturate-anesthetized preparations, and barbiturates are known to alter the balance of excitation and inhibition in other parts of the central auditory system. For example, pentobarbital reduces the effectiveness of glycinergic inhibition in the cochlear nucleus (Evans and Nelson 1973; Young and Brownell 1976), whereas it enhances GABAergic inhibition in the inferior colliculus (Kuwada et al. 1989; Song et al. 2011). Limited data from unanesthetized, decerebrate cats suggest that anesthesia may also affect signal processing in the LSO (Brownell et al. 1979). In particular, Brownell et al. reported that induction of anesthesia converted the responses of two units in the LSO of decerebrate cats from nonchopping to chopping patterns. These observations are consistent with a model in which barbiturates block glycine-mediated inhibition and thereby augment the discharge regularity of units in the LSO (e.g., Banks and Sachs 1991).
The goal of this study was to characterize more fully the temporal discharge patterns of single units in the LSO of unanesthetized, decerebrate cats. Standard extracellular recording techniques were used to obtain responses to repeated presentations of long-duration, ipsilateral best-frequency (BF) tone bursts at 20 dB with regard to (re) threshold. Poststimulus time (PST) histograms were classified objectively on the basis of a decision tree, which includes tests of the first interpeak interval, instantaneous firing rate as a function of time, and sustained rate. Results obtained with the decerebrate preparation support previous observations that the majority (∼2/3) of LSO units exhibit chopper-type responses but also show that regularity is lower in such units and that many units exhibit nonchopping (primary like or onset sustained) patterns. Compared with the chopper-type units, the nonchopper units tend to show longer first-spike latencies, lower peak firing rates, and more irregular sustained discharge patterns. Modeling studies show that the full range of observed LSO response types can be obtained from an underlying sustained chopper by varying the strength and latency of inhibition relative to that of excitation. Together, these results suggest an enhancement of inhibitory effects in unanesthetized preparations and have important implications for LSO processing of free-field sounds.
METHODS
Surgical procedures.
Detailed surgical procedures for acute physiological recording in the LSO of decerebrate cats are described elsewhere (Greene et al. 2010a). Briefly, experiments were conducted on adult male cats (3–4 kg) with infection-free ears under approved institutional animal care guidelines. Cats were anesthetized with ketamine (initial dose: 40 mg/kg im; supplemental doses: 20 mg/kg im) and xylazine (initial dose: 0.5 mg/kg im; supplemental doses: 0.25 mg/kg im) and given atropine (0.05 mg/kg im) to reduce respiratory secretions and dexamethasone (2 mg/kg im) to reduce cerebral edema. Thereafter, core body temperature was maintained at 39°C using a feedback-controlled heating blanket. The cephalic vein was cannulated to allow infusion of fluids, and a tracheotomy was performed to facilitate quiet breathing. The skin and temporalis muscles overlying the skull were reflected, and a craniotomy was made over the left parietal cortex. Cats were made decerebrate under visual control by aspirating through the thalamus; anesthesia was then discontinued. Both ear canals were transected to accept hollow ear bars, and the cat's head was secured in a stereotaxic frame, 30° nose-down with respect to the horizontal plane. The left LSO was accessed by opening the skull at the midline and aspirating the cerebellum overlying and lateral to the floor of the fourth ventricle caudal to the cerebellar peduncle. At the end of each experiment, cats were euthanized with an overdose of pentobarbital sodium (100 mg/kg iv). If unit-rich electrode tracks were marked with electrolytic lesions (∼10 μA; 30 s) during the course of recording, then cats were perfused and the brain tissue was processed for histology.
Recording protocol.
Recordings were made in a sound-attenuating chamber. Acoustic stimuli were delivered bilaterally via electrostatic speakers (Tucker-Davis Technologies; TDT) that were coupled to the ears with hollow ear bars. These acoustic systems were calibrated at the start of each experiment using a probe tube microphone. The responses of the TDT systems decreased monotonically from 110 to 90 dB from 0.8 to 48 kHz. Interaural cross talk was 30–50 dB down at all frequencies in the ear opposite to the sound source (Davis 2005), which is well outside the range of interaural level differences (ILDs) used during binaural testing (used here to aid localization of units to the LSO).
Acoustic stimuli including tones and broadband noise were synthesized digitally with TDT System 3 hardware and presented via a digital-to-analog converter (16 bit; sampling rate of 100 kHz). Two stimulus formats were used: short bursts of 50-ms duration presented at a rate of 4 bursts/s were used as search stimuli and to construct frequency-response maps, and long bursts of 200-ms duration presented at a rate of 1 burst/s were used to obtain rate-level and rate-ILD curves and PST histogram data. All stimuli were gated on and off with 10-ms rise/fall times. Tones were attenuated relative to the acoustic ceiling at that frequency to achieve a desired input sound pressure level (in dB SPL). Noise stimuli were flat at the tympanic membrane (i.e., corrected for nonflat calibration curves) and attenuated relative to the maximum spectrum level achievable without any attenuation (∼45 dB SL).
Unit activity was recorded with platinum-iridium electrodes that were advanced using a motor-controlled multielectrode positioning system (Alpha-Omega). The electrode signal was amplified (10,000–30,000 times) and filtered (0.3–6 kHz) using a multichannel processor (Alpha-Omega). Template matching software (Alpha-Omega) was used to discriminate action potentials from background activity. Templates for all units had error histograms with a single well-defined peak indicating good isolation of one waveform; signal-to-noise ratios were greater than 2:1 and often greater than 10:1. Spike times relative to stimulus onset were stored for on- and off-line analyses.
Electrodes were advanced through the LSO by using a standardized dorsoventral approach (Greene et al. 2010a) while 50-ms search stimuli (tones or noise) were presented to the excitatory ear. When the LSO is sampled along a dorsoventral trajectory, electrodes pass through monaural nuclei before entering and after exiting the LSO (Guinan et al. 1972a, 1972b; Tsuchitani 1977). Within the LSO, unit BFs tend to increase with depth in the medial and lateral limbs (the BFs are higher in the medial limb) but decrease in the central limb (Tsuchitani and Boudreau 1966). Units were identified as being within the LSO on the basis of histological reconstruction of the electrode path (14/47 units) or similarity of monaural and binaural properties to published data (Finlayson and Caspary 1991; Greene et al. 2010a; Guinan et al. 1972a, 1972b; Tollin and Yin 2005; Tsuchitani 1977).
When a single LSO unit was isolated, its BF and threshold were determined using audio-visual inspection and the following data collection protocol was initiated. To evaluate ipsilateral sensitivity, frequency-response maps and BF tone and noise rate-level functions were obtained. To evaluate the binaural sensitivity of units, BF tones were presented at 10 dB re threshold in the excitatory ear, and a 40-dB range of ILDs was created by varying the intensity of the tone in the inhibitory ear relative to this level. PST histograms were generated from responses to 100–200 repetitions of 200-ms BF tone bursts, presented to the excitatory ear at ∼20 dB re threshold.
Data analysis.
PST histogram were constructed using a bin width of 0.2 ms. Three measures were used to analyze and classify the resulting histograms: first interpeak gap, instantaneous firing rate as a function of time, and sustained rate. To compute the first interpeak gap, first- and second-spike latency histograms were constructed. In units without spontaneous activity, the first and second spikes in the response were taken to be the first two spikes after stimulus onset. In spontaneously active units, a cursor was aligned by eye on the beginning of the rise of the onset peak of the histogram, and the first two spikes thereafter were taken (Young et al. 1988). The latency histograms were characterized by their minimum latency and the full width at half maximum (FWHM) time points. The interpeak gap was defined to be the difference in time between the falling and rising FWHM times, respectively, of the first- and second-spike latency histograms. To evaluate changes in instantaneous firing rate, regularity analysis was performed (Young et al. 1988). The interspike interval (ISI) mean and standard deviation were computed and plotted as a function of time throughout the stimulus duration. Calculations were terminated at 180 ms to avoid end effects, and bins were plotted only if they contained ≥2 spikes. Independent best-fit lines (least squares) were fit to the “first” (10 ms) and “second” portions (80 ms) of the response. To obtain the estimate of the sustained rate, the discharge rate over the last 80 ms (100–180 ms) of the response was averaged (where the interval statistics were stationary). For display purposes only, all histograms were smoothed with a three-bin triangularly weighted moving-average filter.
Simulations.
The temporal responses of LSO cells were simulated in MATLAB (The MathWorks, Natick, MA) using a model of the ipsilateral brain stem. The model consists of five neural populations arranged into 400 isofrequency slices evenly spaced on a logarithmic scale from 5 to 20 kHz. Model auditory nerve fibers (Zilany and Bruce 2006) excite spherical (SB) and globular bushy (GB) cells in the VCN, SB cells excite LSO cells, and GB cells excite LNTB cells, which in turn inhibit LSO cells. The convergence from one to another model population is specified by two parameters: number (N) and bandwidth (BW) over which this number is drawn randomly (centered on the BF of the target cell).
The neuromime of MacGregor (1987) was used to model the activity of cells in the VCN, LNTB, and LSO. The model has parallel branches representing a cell's membrane capacitance (Cm), leakage conductance (G), potassium channels (GK; EK = −10 mV), and synaptic inputs. There is one synaptic branch for each population from which a cell draws input, where the sign of the associated reversal potential determines whether the connection is excitatory (Eex = 70 mV) or inhibitory (Ein = −10 mV). The neuromime is governed by three equations:
| (1) |
| (2) |
| (3) |
where Vm is the cell's membrane potential with respect to threshold, τm = Cm/G, gK = GK/G, gex = Gex/G, gin = Gin/G, bK and τK are the step size and time constant, respectively, of the potassium conductance change after a spike S occurs (an absolute dead time of 0.7 ms is enforced), and θ is the cell's threshold. Output spikes, after a fixed delay, produce a step increase, δ, in the cumulative conductance of the cell's synaptic targets (gex or gin), which decays exponentially with time constant τ.
The parameters that specify the model (see Table 1) fall into two groups: intrinsic and connectional. The intrinsic parameter (τm, θ, bK, and τK) values for the SB, GB, and LNTB cells were set to ensure fast temporal dynamics. LSO cell values were set to match closely those for cell 3 of Zhou and Colburn (2010), which exhibits a fast, sustained chopper response (in the absence of inhibitory inputs; the potassium channel here mimics their afterhyperpolarization channel). The connection parameter (BW, N, δ, and τ) values were set so that SB cells exhibit primary-like responses, GB and LNTB cells exhibit primary-like with notch responses (not shown), and LSO cells exhibit sustained chopper responses (in the absence of inhibitory inputs). To examine the effects of inhibitory inputs on LSO model cell responses, the strength of LNTB inputs to LSO cells (δLNTB→LSO) was varied from 0 to 6 in increments of 0.5, and the delay of LNTB inputs (relative to that of SB cells) was varied from −2 to +4 ms in increments of 1 ms.
Table 1.
Model properties
| Intrinsic | τm, ms | θ, mV | bK | τK, ms |
|---|---|---|---|---|
| SB/GB/LNTB | 1 | 7.5 | 2 | 1 |
| LSO | 1 | 15 | 0.6369 | 5 |
| Connection | BWA→B, octave | NA→B | δA→B | τA→B, ms |
|---|---|---|---|---|
| ANF→SB | 0.1 | 1 | 7.5 | 1 |
| ANF→GB | 0.1 | 3 | 3 | 1 |
| SB→LSO | 0.5 | 20 | 2 | 9 |
| GB→LNTB | 0.1 | 1 | 7 | 1 |
| LNTB→LSO | 0.6 | 10 | Varies | 9 |
ANF, auditory nerve fibers; SB, spherical bushy cells; GB, globular bushy cells; LSO, lateral superior olive; LNTB, lateral nucleous of the trapezoid body. See methods for definitions of intrinsic and connectional parameters.
RESULTS
Physiological characterizations are based on the responses of 47 units that were recorded in 11 cats. The monaural spectral response properties of 87 LSO units, including 38 of the current units, were described in Greene et al. (2010a). The present study expands on those results by measuring and analyzing the temporal discharge patterns of units elicited by BF tones. Units were localized to the LSO on the basis of histological reconstruction of electrode tracks (14 units) or stereotaxic coordinates and physiological criteria. In the latter cases, units were inferred to be in the LSO on the basis of depth of recording (∼5–6 mm), progression of BFs within a limb (Tsuchitani and Boudreau 1966), and similarity of monaural and binaural properties (particularly the excitatory-inhibitory interactions) to published data (Finlayson and Caspary 1991; Greene et al. 2010a; Guinan et al. 1972a, 1972b; Tollin and Yin 2005; Tsuchitani 1977). The BFs of units presented in this report were distributed between 1 and 48 kHz, representing most of the cat's audible range.
PST histogram classification.
The discharge patterns of LSO units were assessed by constructing PST histograms from unit responses to repeated presentations of BF tone bursts delivered to the ipsilateral (excitatory) ear at ∼20 dB re threshold. PST shapes are known to be dependent on stimulus level, usually becoming stable above 10 dB re threshold (e.g., Tsuchitani and Johnson 1985). Consistent with this observation, our limited data, in which responses at +50 dB match those at +20 dB, suggest that we recorded at a sufficiently high level to classify the stable PST shapes of units.
Units were grouped into four types on the basis of histogram envelope shape, adaptation of firing rate with time, and sustained discharge rate (details below). Representative data for each unit type are shown in Fig. 1. Chopper-sustained units (Fig. 1A) are characterized by regularly spaced peaks of discharge that are initially time-locked to the onset of the stimulus (raster) such that a number of peaks are discernible in the histogram. Chopper-transient units (Fig. 1B; expanded in Fig. 2A) also show two or more well-defined peaks of activity at stimulus onset but undergo a rapid decrease in instantaneous rate such that the interval between peaks increases with time. Primary-like units (Fig. 1C) display an initial peak of activity followed by a monotonic decline in rate to a steady-state value. Onset-sustained units (Fig. 1D) exhibit a sharp peak at stimulus onset followed by a low sustained activity. Note that units sometimes failed to fire a spike at the first (e.g., the onset-sustained unit) or second preferred peak time in a given trial (see arrows along the ordinate in the dot raster for the chopper-transient unit in Fig. 1B; unit names were chosen to reflect the overall shape of the PST histogram as computed over all trials). Chopper-transient units were the most prevalent unit type in our sample (26/47); the other unit types were less abundant (chopper-sustained, 6/47; primary-like, 7/47; onset-sustained, 8/47).
Fig. 1.
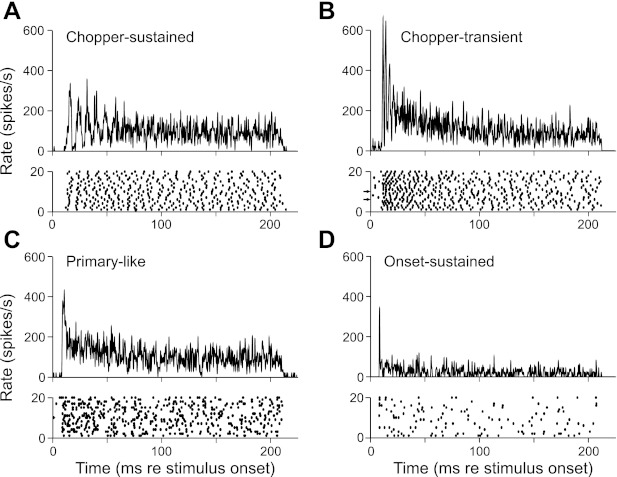
Examples of 4 types of discharge patterns generated by lateral superior olive (LSO) units. Stimuli were 200-ms best-frequency tone bursts presented to the ipsilateral ear at ∼20 dB re threshold. A–D, top: poststimulus time (PST) histograms were constructed from responses to 100–200 repetitions of the stimulus, using a bin width of 0.2 ms, and smoothed with a 3-bin-wide triangular filter; bottom, dot rasters of the responses for the first 20 trials. Arrows along the ordinate of the raster in B indicate trials where the unit failed to fire during 1 or more of the initial peak periods. Unit best frequencies and thresholds are as follows: 24.9 kHz, 13 dB SPL (A); 34.9 kHz, 16 dB SPL (B); 30.6 kHz, 8 dB SPL (C); and 5.3 kHz, 23 dB SPL (D).
Fig. 2.
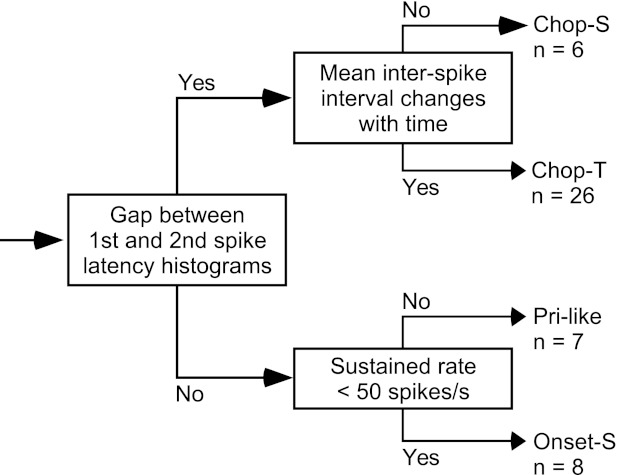
Decision tree for categorizing LSO units on the basis of responses to 200-ms tone bursts. Chop-S, chopper-sustained units; Chop-T, chopper-transient; Pri-like, primary-like units; Onset-S, onset-sustained units. The number of units (n) in each terminal limb is indicated for each category.
Figure 2 shows the decision tree that we developed to partition units into the various types. The initial branch point, which tests for the presence of well-defined peaks of activity at the start of the response, separates units into multimodal (chopper) and unimodal (nonchopper) subpopulations. Units were designated as chopper type on the basis of a simple objective measurement of envelope contour, a test that captures the essence of visual inspection used, for example, by Tsuchitani (1977). Many other tests were devised to identify chopper units (results not shown) on the basis of measures of initial discharge precision (e.g., variance in first- or second-spike latency), reliability (spikes/peak; Young et al. 1988), and/or regularity (first ISI); however, all suffered from the fact that many units with clear chopper discharge patterns (e.g., Fig. 1B) misfired at one or more preferred intervals in any given trial (arrows in dot raster), resulting in low parameter values similar to the ranges of nonchopper units. Along the upper branch of the tree, chopper units are subdivided into chopper-sustained (Chop-S) and chopper-transient (Chop-T) units on the basis of the change in firing rate as a function of time through the response (after Young et al. 1988, who also used discharge regularity to distinguish these subtypes). Along the lower branch, nonchopper units are subdivided into primary-like (Pri-like) and onset-sustained (Onset-S) units on the basis of sustained firing rate (e.g., Blackburn and Sachs 1989). Most units in this study had very low spontaneous discharge rates (median rates in spikes/s: Chop-S, 0; Chop-T, 0.13; Pri-like, 0.94; and Onset-S, 0.07); thus spontaneous activity had little effect on the classification of individual unit spike patterns.
Units were assigned to the multimodal (chopper) subpopulation on the basis of the gap between the first and second peaks of the response. To assess the interpeak gap, first- and second-spike latency histograms were constructed and FWHM times were measured. The interpeak gap was defined to be the difference in time between the falling and rising FWHM times, respectively, of the first- and second-spike latency histograms. Figure 3, A and B, shows PST and first (black)- and second-spike latency (gray) histograms for the Chop-T and Pri-like units in Fig. 1, B and C. All histograms are plotted on the same time scale, and for clarity, only the relevant FWHM times are marked on the latency histograms (vertical dashed lines). Note that the latency histograms for the Chop-T unit (Fig. 3A) have narrow peaks that are aligned with the corresponding peaks in the PST histogram, whereas the latency histograms for the Pri-like unit (Fig. 3B) are broadly distributed, and the second-spike histogram has no obvious corresponding peak in the PST. As a result, the Chop-T unit shows a positive gap, whereas the Pri-like unit shows a negative gap. Figure 3C shows the distribution of first interpeak gaps for each unit type. The median gap for chopper units (black and gray bars) was 1 ms, indicating that the initial firing rate for most chopper units was high.
Fig. 3.
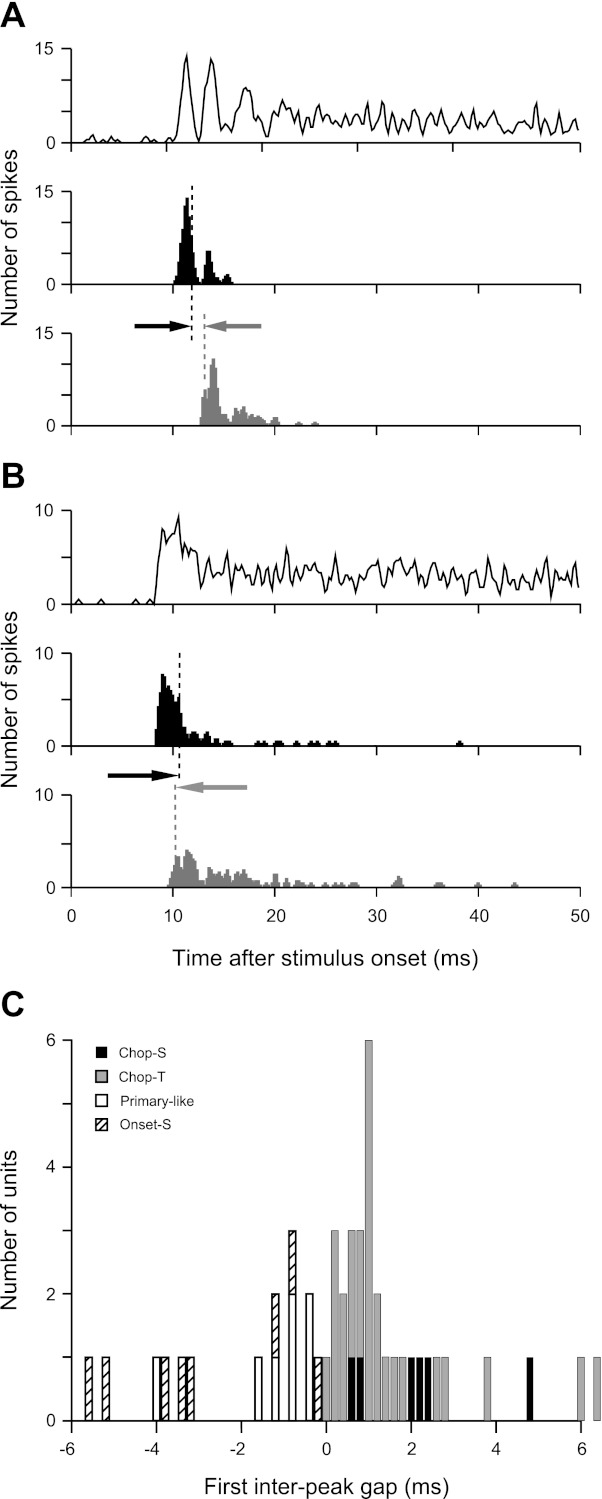
First interpeak gap detection test for chopper units. A and B: PST and first-spike (black) and second-spike (gray) latency histograms for a Chop-T unit (A; same unit as in Fig. 1B) and a Pri-like unit (B; same unit as in Fig. 1C). All plots were smoothed with a 3-bin-wide triangular filter. Black and gray vertical dashed lines mark the half-width (half-maximum) time points on the falling and rising edges, respectively, of the first- and second-spike latency histograms. The first interpeak gap is defined to be the difference in time between the gray and black arrows. C: distribution of first interpeak gap values for all LSO unit types.
Multimodal units were subdivided by assessing the change in firing rate as a function of time. Figure 4, A and B, shows the regularity analysis (Young et al. 1988) for the Chop-S and Chop-T units shown in Fig. 1, A and B. Chop-S units (Fig. 4A) show a relatively constant mean ISI (black) over the duration of the stimulus and a low standard deviation (gray). In contrast, Chop-T units (Fig. 4B) show a mean ISI that changed rapidly following the onset of the response and high standard deviations. Inspection suggests that unit responses may be partitioned into three periods of rate change roughly grouped into the first 10 ms, the next 80 ms, and the final 100 ms of the response (where the mean ISI is approximately constant with time). Straight lines were independently fit (least squares) to the mean ISI plots during the first and second periods (heavy lines in Fig. 4, A and B), and the resulting slopes are compared in Fig. 4C (note that the axes are scaled differently). Chop-S units are defined to be those units that have low first and second slopes (black squares; magnitude <0.05 ΔISI/Δtime). By contrast, Chop-T units (open triangles) show larger rate changes in the first and/or second intervals.
Fig. 4.

Regularity analyses for chopper units. A and B: regularity analyses for a Chop-S (A; Fig. 1A) and a Chop-T unit (B; Fig. 1B). In these plots, μ is the mean interspike interval and σ is the standard deviation of the interval. Bins are plotted only if they contain ≥2 spikes; plots were smoothed with a 3-bin-wide triangular filter. Heavy solid lines on the mean interspike interval (ISI) plots show independent best-fit lines (least squares) to the “first” (10–20 ms) and “second” portions (∼20–100 ms) of the data. C: comparisons of each chopper unit's second vs. first slope of firing rate adaptation.
Unimodal units were subclassified on the basis of sustained rate. The peak-to-sustained rate ratio is plotted against sustained rate for all unimodal units in Fig. 5. Onset-S units were defined to have sustained rates below 50 spikes/s (circles), whereas Pri-like units (squares) had higher sustained rates. Not surprisingly, Onset-S units tended to have higher peak-to-sustained rate ratios than Pri-like units.
Fig. 5.
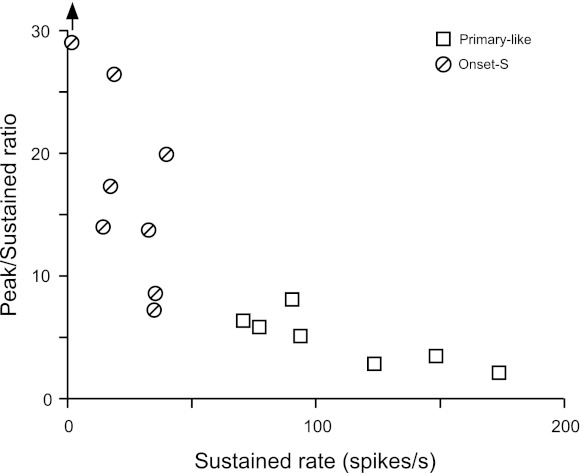
Peak-to-sustained rate ratio vs. sustained rate for Primary-like and Onset-S units. The sustained rate is the average rate over the last 100 ms of the response.
In summary, the temporal discharge patterns of all LSO units in this study were classified categorically (Fig. 2) as Chop-S (13%), Chop-T (55%), Pri-like (15%), or Onset-S (17%). Given the lack of distinct boundaries in the various parameter spaces (Figs. 3–5), however, the data may be best described as a continuum with four archetypes, where unit incidence can be varied to some degree based on choice of criteria. The current distribution of unit types matches best our visual, qualitative assessment of the data.
Other response properties.
PST histograms like those in Fig. 1 also can be used to define basic trends in first-spike latency, firing rate, and discharge regularity for units in each response type. The minimum first-spike latencies of LSO units are shown as a function of BF in Fig. 6A. Minimum rather than mean latency values are plotted for two reasons. First, minimum spike latency values indicate the time when a unit begins to fire in response to a stimulus (estimates that do not suffer from the effects of missed spikes in a peak interval in a given trial), whereas mean latency values reflect both this time as well as the length of time over which that initial response is spread. Second, in this analysis, we are concerned with comparing the responses of LSO unit types with those of primary-like units in the AVCN (their putative spherical bushy cell inputs; Rhode et al. 1983), for which latency values were reported as minimum latency (Blackburn and Sachs 1989). Note that LSO units with the shortest latencies are delayed with respect to those of AVCN primary-like units by ∼4 ms (solid line: Blackburn and Sachs 1989; dashed line: extrapolation) and show a similar trend with BF. To compare unit types across BF, we computed the latency of each unit relative to the AVCN minimum latency curve at that frequency (Fig. 6B). Multimodal (chopper) units (top plot) tended to have shorter first-spike latencies than those of unimodal units (bottom plot) on the order of 0.5 ms; however, there is substantial overlap in the distributions, and the medians are not significantly different (Mann-Whitney U-test, P > 0.05).
Fig. 6.

Minimum first-spike latencies of all units. A: minimum first-spike latency as a function of best frequency. Each symbol is the response of 1 unit. Solid line shows the minimum first-spike latency curve for Primary-like units in the anteroventral cochlear nucleus (AVCN) of cats (Blackburn and Sachs 1989); dashed line represents an extrapolation of this curve to higher frequencies. B: distribution of latencies within unit types. Data are plotted in ms relative to the minimum latency curve of AVCN Primary-like units with similar best frequencies. Symbols above plots indicate median values for each unit type.
Each unit's peak rate is plotted against its sustained rate in Fig. 7. Two trends are evident in the data. First, there are differences between multimodal (filled symbols) and unimodal units (open symbols) in terms of peak rate. That is, most multimodal units responded with peak rates above 500 spikes/s (22/26 Chop-T, 4/6 Chop-S), whereas most unimodal units responded with peak rates below this value (6/7 Pri-like, 7/8 Onset-S). The peak rates of Chop-T units (triangles) are significantly higher than those of both Pri-like (open squares; Mann-Whitney U-test, P < 0.01) and Onset-S units (circles; P < 0.001). Note that peak rates are dependent on bin width; however, the relative differences in peak rates between unit classes are maintained over a broad range of bin widths (not shown). Second, there are differences within multimodal and unimodal groups in terms of sustained rate. That is, most Chop-S units (filled squares) showed a sustained rate above 100 spikes/s (5/6 units), whereas most Chop-T units (triangles) showed a lower rate (19/26); the difference is significant (P < 0.05). By definition, unimodal units are subclassed on the basis of sustained rate; thus Pri-like units have significantly higher sustained rates than Onset-S units (P < 0.001).
Fig. 7.
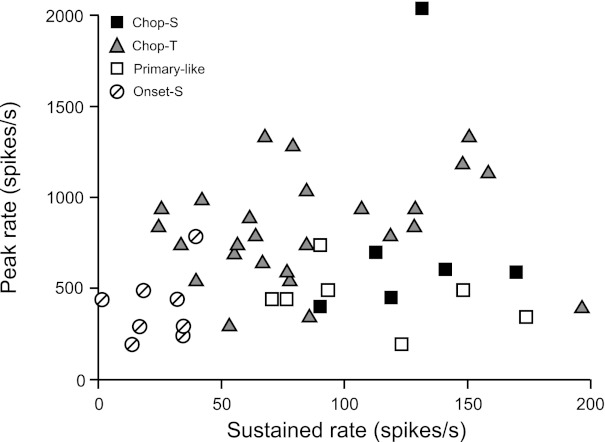
Peak rate vs. sustained rate for all units.
ISI regularity analysis was performed for all units over the third, steady-state portion of the response, where the interval statistics were constant (100–180 ms; see Fig. 4). As an aside, the summary values reported below were not altered significantly if computed over the second (20–100 ms; Tsuchitani 1982) or second and third portions of the response (i.e., values were roughly constant with time after any initial rate adaptation; Blackburn and Sachs 1989). Regularity was quantified using the coefficient of variation (CV), defined as the ratio of the standard deviation of the interval to its mean, where CV is larger for irregularly discharging neurons and smaller for regularly discharging neurons. Each unit's average CV is plotted against its sustained rate in Fig. 8 (3 Onset-S units were excluded due to low spike counts). Note that responses are generally irregular for all unit types (CV > 0.35, Young et al. 1988: 5/6 Chop-S; 21/26 Chop-T; 7/8 Pri-like; 3/5 Onset-S). There was a trend for CV to decrease from Pri-like units (median 0.57) to Chop-T (0.46) to Chop-S units (0.42), but the distributions show substantial overlap, and the medians are not significantly different.
Fig. 8.

Scatter plot showing coefficient of variation (CV) vs. sustained rate for all units. The CV, which is the ratio of the ISI standard deviation to the mean, is the average value computed from regularity histograms over the last 100 ms of the response, an interval over which the interval statistics are approximately constant. Three Onset-S units responded with rates too low to obtain a CV.
Modeling LSO PSTs.
Compared with the anesthetized cat (Tsuchitani 1982), we observed a lower percentage of chopper units, and those choppers we did observe fired with greater irregularity. Also, the current unit population responded with lower sustained discharge rates and longer latencies (Tsuchitani 1977; Tsuchitani and Johnson 1985). These results suggest an enhanced role for inhibition in shaping temporal discharge patterns in the decerebrate preparation. To investigate the effects of a sound-driven ipsilateral inhibitory input on LSO discharge patterns, we developed a computational model of the LSO and varied the strength and delay of inhibitory inputs relative to excitatory inputs.
Figure 9A shows the model organization, where connections between cell types are represented by arrows (solid: excitatory; dashed: inhibitory) and labeled with their number and strength (NA→B × δA→B). Auditory nerve fibers (Zilany and Bruce 2006) provide a small number of suprathreshold inputs to SB and GB cells. SB cells provide 20 subthreshold excitatory inputs to LSO cells. GB cells provide a single suprathreshold input to LNTB cells, which in turn provide 10 inhibitory inputs of variable strength to LSO cells. Synaptic delays were set such that the first-spike latency observed in Fig. 9B fell within the range observed in the anesthetized cat (Tsuchitani 1977), and somatic conductance changes from the excitatory and inhibitory inputs were initially concurrent. Model parameters are summarized in Table 1.
Fig. 9.
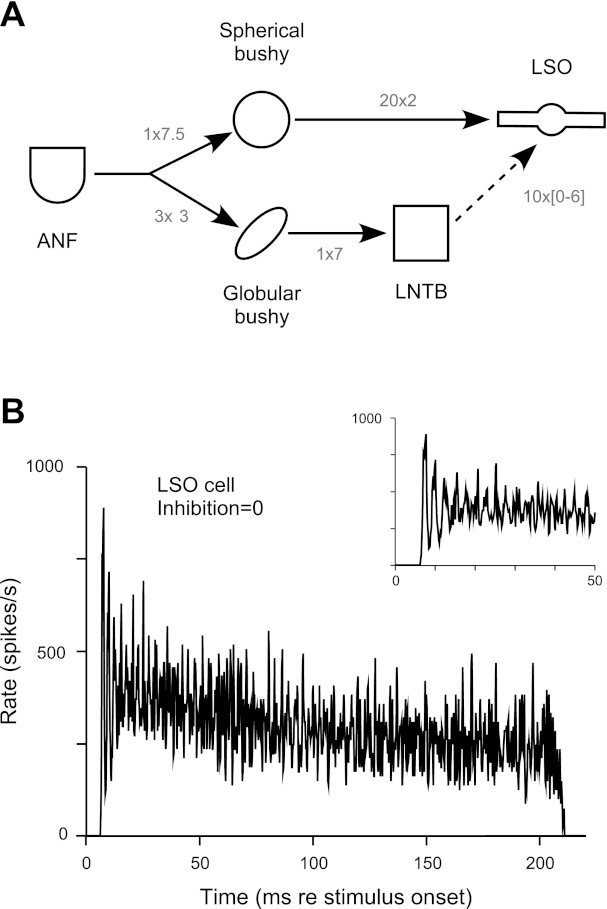
Computational model of the LSO: model response with no inhibition. A: the LSO model consists of 5 populations organized in a tonotopic manner, where auditory nerve fibers (ANF), spherical and globular bushy cells, and LNTB cells model auditory nerve fibers and cochlear nucleus and lateral nucleus of the trapezoid body neurons, respectively. The populations are interconnected as shown. Solid and dashed lines indicate excitatory and inhibitory connections, respectively; the number × strength of connections are indicated (the strength of the LNTB-LSO connection is variable). B: PST histogram of a model LSO cell when the strength of the LNTB-LSO inhibitory connection is zero. Stimuli were 200-ms best-frequency tone bursts presented 20 dB re threshold. Histogram was constructed from 100 repetitions of the stimulus using a bin width of 0.2 ms and smoothed with a 3-bin triangular filter.
We examined the role of inhibition by varying the strength and timing of LNTB inputs to LSO relative to the SB cell excitation. Figure 9B shows a PST generated by the LSO model when the LNTB input is set to zero; the inset expands the first 50 ms to display more clearly the behavior at stimulus onset. Without inhibition, the LSO model produces a discharge pattern comparable to the fast chopper (spontaneous rate = 0 spikes/s, first-spike latency = 6.7 ms, sustained rate = 260 spikes/s, and CV = 0.19) in the anesthetized cat (Tsuchitani 1982; Tsuchitani and Johnson 1985).
Figure 10 displays the effects of varying inhibitory strength and delay on model LSO discharge patterns. Modeled LSO PST (Fig. 10A) is displayed such that rows show decreasing inhibitory delay from top to bottom and columns show increasing inhibitory strength from left to right. PST simulations were always 200 ms in duration, but only the first 50 ms have been shown to highlight differences in the onset behavior. Responses were analyzed in the same manner as the in vivo data (Fig. 10B). The interpeak gap first increases and then decreases with increasing strength and decreasing delay because the effects of the inhibition (i.e., to delay and spread out a peak) are first manifest on the second peak of the response before affecting both peaks. As a result, multimodal responses are observed in the top left portion of the plot, whereas unimodal responses are visible at bottom right (separated by a heavy solid line). Mean ISI (sustained rate) is generally independent of delay but increases (decreases) with increasing inhibitory strength. Thus Chop-S responses are produced when inhibition is weak, regardless of delay (Fig. 10A, left). For positive delays, increasing inhibitory strength results in Chop-T units (top center). For negative delays, increasing inhibitory strength creates Pri-like responses (bottom center), followed by Onset-S unit responses (bottom right).
Fig. 10.
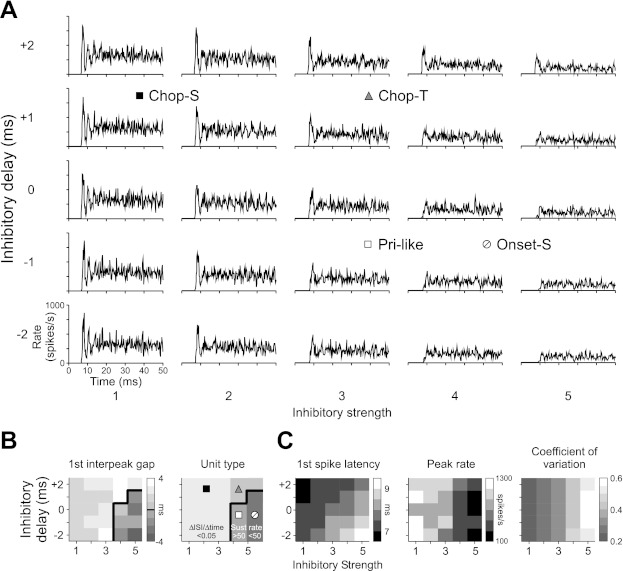
Computational model of the LSO: effects of varying the strength and delay of ipsilateral inhibition on LSO cell responses. A: tone burst-elicited PST histograms of a model LSO cell when the strength and delay of LNTB inhibitory input to the LSO is varied. Strength increases from left to right, and delay decreases from top to bottom. Unit-type symbols indicate regions in parameter space where such responses can be found. B and C: discharge statistics for model PSTs. Tile shade illustrates the value of each parameter for the corresponding PST in A. In B, model PST histograms are grouped into 4 unit types (symbols as defined in A) based on the same decision tree used to classify neural data. The heavy solid line separates multimodal (left) from unimodal units (right); multimodal units are subdivided based on their rate of change in mean ISI with time, and unimodal units are divided by sustained rate in spikes/s.
Increasing inhibitory strength and delay also affected first-spike latency, peak firing rate, and unit regularity (Fig. 10C). First-spike latency increased with increasing strength and decreasing delay, from under 7 ms for a weak, delayed inhibition to over 12 ms for a strong, preceding inhibition. Similarly, peak rates decreased with both increasing inhibitory strength and decreasing delay. Regularity of the sustained region, on the other hand, was generally independent of delay but decreased (CV: 0.2–0.55) with increasing inhibitory strength. Consistent with relationships observed in vivo, compared with multimodal units, unimodal units tended to show longer first-spike latencies, lower peak firing rates, and more irregular sustained discharge patterns.
DISCUSSION
Comparisons with previous studies of the LSO.
A large majority of LSO units (68%) in the present study exhibited chopper-type PSTs. This preponderance of chopper-type units in the LSO is consistent with results obtained in a number of barbiturate-anesthetized preparations (cat: Caird and Klinke 1983; Guinan et al. 1972a, 1972b; Tollin and Yin 2002, 2005; Tsai et al. 2010; Tsuchitani 1977, 1982; Tsuchitani and Johnson 1985; chinchilla and rat: Finlayson and Caspary 1991; gerbil: Sanes and Rubel 1988; bat: Harnischfeger et al. 1985). The results of this study differ from prior observations, however, in several respects: absolute chopper-type incidence rate, and type and nature of chopper units.
The incidence rate of chopper-type units in the LSO of decerebrate cat is lower than that observed in anesthetized cat. In particular, Guinan et al. (1972a, 1972b) found that 80% of LSO units exhibited a chopper-type PST, whereas Tsuchitani (1982) reported a value closer to 100%. This difference may reflect the effects of anesthesia. Brownell et al. (1979) reported that induction of barbiturate anesthesia converted the responses of two nonchopping units to chopper-type units. Alternatively, or in addition, the difference in chopper-type incidence rate may arise from other methodological issues. In the LSO of the rat, it has been shown that the in vitro firing pattern elicited by current injection correlates well with the expression level of low-threshold potassium channels (KLT) such that multiple-spiking cells dominate in the medial (high frequency) limb of the LSO, where KLT expression is low. Therefore, a recording bias more or less toward high-frequency units (where most studies acquire data) might produce variability in the chopper-type unit incidence rate. Chopper-type incidence rate may also depend on classification inclusion criteria. In the current study, chopper units were separated from nonchopper units on the basis of the presence of a positive gap between the interior half-maximum points of the first and second peaks of the response. If a more liberal criterion was used (i.e., 70% of peak value), then our percentage of chopper-type units would increase to 74%. On the other hand, Tsuchitani (1982) found that a number of LSO units exhibited non-chopper-type responses, but most of these responses were classified as abnormal based on the fact that discharge characteristics changed over time. If a more liberal inclusion criterion was employed, then the percentage of chopper-type units would decrease, thus reducing the difference in incidence rate.
Although the percentage of chopper units may or may not be similar across preparations, comparisons with anesthetized cat (Tsuchitani 1977, 1982; Tsuchitani and Johnson 1985), where the most data are available and with which our data collection protocols are most comparable, reveal several major differences in chopper unit characteristics. First, the types of chopper units observed in the two preparations are different. Figure 11 plots the mean sustained ISI as a function of the first ISI for each unit in our sample, together with dashed lines marking boundaries for unit classification in the anesthetized preparation. Our population of chopper units (filled symbols) did not include any fast choppers (Nm; near the origin), which exhibited short ISIs that were maintained throughout the duration of the stimulus. Instead, we observed only slow choppers (N-W or W), which showed long ISIs in the sustained portion of the response. In general, our Chop-T units (triangles) are comparable to N-W choppers, whereas Chop-S units (squares) are comparable to W choppers.
Fig. 11.

Mean sustained vs. initial ISI for all units. Dashed lines show approximate boundaries for categorizing chopper units (Nm, N-W, and W) in the LSO of anesthetized cat (e.g., Tsuchitani 1982).
Other differences between chopper-type units in decerebrate and anesthetized cat include sustained discharge rate, regularity, and first-spike latency. At ∼20 dB re threshold, the sustained discharge rates of LSO units in decerebrate cat are all below 250 spikes/s (Fig. 7), whereas the median sustained rate in anesthetized cat is around 300 spikes/s with rates that can reach as high as 650 spikes/s (Tsuchitani 1982; Tsuchitani and Johnson 1985; but see Tsai et al. 2010, who reported decerebrate-like rates, perhaps because they purposely did not use a barbiturate-only anesthetic regimen). This (usual) disparity in rate is consistent with our observation that the LSO in decerebrate cat lacks fast choppers. With regard to regularity, the current population of units responded with CVs between 0.2 and 0.8, which spans the range observed for choppers and primary-like units in the cochlear nucleus (Young et al. 1988). In contrast, LSO units in the anesthetized cat almost always responded with CVs below 0.5 (Tsuchitani 1982; Tsuchitani and Johnson 1985). Finally, the first-spike latencies for our units were between 8 and 12 ms (Fig. 6), which is substantially longer than values reported for anesthetized cat (6–8 ms; Tsuchitani 1977). Some of this difference may be accounted for by differences in rise/fall times; Tsuchitani used tonal stimuli with fast 1-ms rise/fall times for latency measurements, whereas all PSTs collected here used longer 10-ms rise/fall times.
Role of inhibition in shaping PST histogram shape.
The many differences between chopper-type units in anesthetized and decerebrate cat described above could result from an anesthetic-dependent effect on either intrinsic or extrinsic mechanism(s). With regard to intrinsic mechanisms, LSO cells contain a number of specialized channels, including Ih and KLT channels, the latter of which are known to play a major role in shaping the temporal discharge properties of some LSO cells (Barnes-Davies et al. 2004). However, the gradient of KLT along the tonotopic axis suggests that high-frequency LSO cells, which constitute the bulk of our data, are less likely to express (or express strongly) KLT channels. In addition, we are not aware of any evidence that barbiturates alter the activity of KLT channels. On the contrary, there is direct evidence that barbiturates reduce the effectiveness of extrinsic glycinergic inhibitory mechanisms (Lu and Xu 2002), including those in the LSO (Wu and Kelly 1994). Inhibition could enhance the effectiveness of KLT channels (Dodla et al. 2006), but high-frequency tones (as often used here) are not likely to evoke the (periodic) well-timed inhibitory and excitatory postsynaptic potentials needed to promote postinhibitory facilitation of spiking via transient inactivation of KLT channels. For these reasons, we believe that changes in inhibitory, not KLT current, strength plays the dominant role in the effects we have described in the current report.
LSO cells receive excitatory inputs from spherical bushy cells in the ipsilateral VCN and inhibitory inputs from globular bushy cells in the contralateral VCN via a synapse in the ipsilateral MNTB (Cant 1991; Cant and Casseday 1986; Smith et al. 1993; Warr 1966, 1972). In addition to these well-known inputs, the LSO receives a variety of smaller projections. In particular, anatomical evidence suggests that the LSO receives inputs from the ipsilateral LNTB (Glendenning et al. 1991; Kuwabara and Zook 1992), which provides inhibitory inputs to the medial superior olive (Cant and Hyson 1992; Grothe and Sanes 1993; Kuwabara and Zook 1992). Given that sounds were presented to the ipsilateral ear in the current study, it is likely that the MNTB provided spontaneous, and the LNTB provided both spontaneous and sound-driven, inhibitory input to LSO cells.
Indirect physiological evidence also suggests that LSO cells receive both spontaneous and ipsilateral sound-driven inhibitory inputs. First, despite receiving excitatory inputs with high spontaneous activity (mean = 59 spikes/s; Smith et al. 1993), the spontaneous firing rates of most LSO cells in decerebrate cat are low (median: <1 spike/s; Greene et al. 2010a). This difference could arise if LSO cells have high electrical thresholds (which does not appear to be true for most cells; Greene et al. 2010a) or if LSO cells receive inhibitory inputs from sources that exhibit spontaneous activity (MNTB: mean = 27 spikes/s; Smith et al. 1998; LNTB: Brueckner et al. 1996). Second, inhibitory sidebands can be observed in the ipsilateral, monaural frequency-response maps of LSO units that exhibit spontaneous activity (Brownell et al. 1979; Caird and Klinke 1983; Greene et al. 2010a), although such features could be inherited from lower order nuclei. Finally, PST responses displayed by LSO units in the anesthetized cat closely resemble the responses recorded here when the contralateral, inhibitory ear is stimulated (Tsuchitani 1988a, 1988b). Consistent with the latter two lines of evidence, Wu and Kelly (1994) reported that LSO cells in a slice preparation receive fast, ipsilaterally derived inhibitory postsynaptic potentials, which were blocked by strychnine (and are therefore glycinergic). Wu and Kelly found that these inhibitory potentials could also be blocked by barbiturate anesthesia (in the 1 neuron tested); this result could explain the diminished role of ipsilateral inhibition in the anesthetized cat.
To determine the relative contributions of spontaneous and driven inhibitory inputs to shaping the temporal responses of LSO cells, we examined each independently in a modeling study (Greene et al. 2010b; current results). The results suggest that spontaneous activity (from model MNTB cells) can reduce discharge rate and regularity, but at the expense of well-defined onset peaks; that is, the effects are similar to those of a driven inhibitory input that substantially precedes the excitatory input (Fig. 10A, bottom). Consequently, spontaneous inhibition alone cannot reproduce the Chop-T response, which is the most common response type in our population. As the results in Fig. 10 show, however, a driven inhibitory input (from model LNTB cells), with an appropriate inhibitory delay, can selectively reduce sustained discharge rate and regularity while sparing the onset response (after Banks and Sachs 1991). Therefore, introducing both spontaneous and driven sources of inhibition can reproduce all response types observed. A direct test of this hypothesis, in the form of recording the discharge patterns of units before and after application of inhibitory antagonists, awaits future studies.
Ipsilateral inhibition and binaural processing.
Physiological (Tollin 2003; Tollin and Yin 2002) and behavioral evidence (Kavanagh and Kelly 1992) suggests that the LSO performs the initial analysis of ILDs, which are the primary acoustic cues used by mammals for the horizontal localization of high-frequency sounds (Erulkar 1972; Irvine 1992; Mills 1972). By virtue of altering monaural response properties, an ipsilateral source of inhibition could alter ILD processing in at least three ways. First, the side-band inhibition observed in frequency-response maps (Greene et al. 2010a) could act to increase unit frequency selectivity, thereby resulting in ILD comparisons being performed over narrower frequency bands. Second, an inhibitor-induced delay could slow sufficiently the excitatory inputs from the ipsilateral ear such that inhibitory inputs driven by the contralateral ear (which must pass through an additional synaptic delay) would arrive at the same time. This would allow a more instantaneous comparison of ILD (Joris and Yin 1998). Finally, a feedforward inhibitory circuit, such as has been proposed via the LNTB, could provide automatic gain control over LSO discharge rate to maintain the rates within an optimal operating range. The result of this would be to reduce ipsilateral-driven firing rates, thereby increasing the contralateral inhibitory strength relative to the ipsilateral excitation and shifting ILD sensitivity toward the ipsilateral hemifield. This is similar in effect to the inhibitory feedback mechanism proposed by Magnusson et al. (2008), which allows LSO cells to balance the strength of their own excitatory and inhibitory inputs to ensure maximum sensitivity. Together, these effects would act to enhance the selectivity and sensitivity of ILD comparisons performed in the LSO, thereby improving the localization of complex sounds.
GRANTS
Support was provided by National Institute on Deafness and Other Communication Disorders Grants R01 DC 05161, P30 DC05409, and T32 DC009974.
DISCLOSURES
No conflicts of interest, financial or otherwise, are declared by the authors.
AUTHOR CONTRIBUTIONS
N.T.G. and K.A.D. conception and design of research; N.T.G. performed experiments; N.T.G. analyzed data; N.T.G. and K.A.D. interpreted results of experiments; N.T.G. and K.A.D. prepared figures; N.T.G. and K.A.D. drafted manuscript; N.T.G. and K.A.D. edited and revised manuscript; N.T.G. and K.A.D. approved final version of manuscript.
ACKNOWLEDGMENTS
We are grateful for the helpful input of Drs. L. Carney, R. Frisina, W. O'Neill, and G. Paige, as well as technical assistance from O. Lomakin and T. Bubel.
REFERENCES
- Banks MI, Sachs MB. Regularity analysis in a compartmental model of chopper units in the anteroventral cochlear nucleus. J Neurophysiol 65: 606–629, 1991 [DOI] [PubMed] [Google Scholar]
- Barnes-Davies M, Barker MC, Osmani F, Forsythe ID. Kv1 currents mediate a gradient of principal neuron excitability across the tonotopic axis in the rat lateral superior olive. Eur J Neurosci 19: 325–333, 2004 [DOI] [PubMed] [Google Scholar]
- Blackburn CC, Sachs MB. Classification of unit types in the anteroventral cochlear nucleus: PST histograms and regularity analysis. J Neurophysiol 62: 1303–1329, 1989 [DOI] [PubMed] [Google Scholar]
- Brownell WE, Manis PB, Ritz LA. Ipsilateral inhibitory responses in the cat lateral superior olive. Brain Res 177: 189–193, 1979 [DOI] [PMC free article] [PubMed] [Google Scholar]
- Brueckner S, Doerrscheidt GJ, Ruebsamen R. Binaural response characteristics of single units in five different nuclei of the gerbil superior olivary complex. Assoc Res Otolaryngol Abstr 475, 1996 [Google Scholar]
- Caird D, Klinke R. Processing of binaural stimuli by cat superior olivary complex neurons. Exp Brain Res 52: 385–399, 1983 [DOI] [PubMed] [Google Scholar]
- Cant NB. Projections to the lateral and medial superior olivary nuclei from the spherical and globular bushy cells of the anteroventral cochlear nucleus. In: Neurobiology of Hearing: The Central Auditory System, edited by Altschuler RA. New York: Raven, 1991, p. 99–119 [Google Scholar]
- Cant NB, Casseday JH. Projections from the anteroventral cochlear nucleus to the lateral and medial superior olivary nuclei. J Comp Neurol 247: 457–476, 1986 [DOI] [PubMed] [Google Scholar]
- Cant NB, Hyson RL. Projections from the lateral nucleus of the trapezoid body to the medial superior olivary nucleus in the gerbil. Hear Res 58: 26–34, 1992 [DOI] [PubMed] [Google Scholar]
- Davis KA. Contralateral effects and binaural interactions in dorsal cochlear nucleus. J Assoc Res Otolaryngol 6: 280–296, 2005 [DOI] [PMC free article] [PubMed] [Google Scholar]
- Dodla R, Svirskis G, Rinzel J. Well-timed, brief inhibition can promote spiking: postinhibitory facilitation. J Neurophysiol 95: 2664–2677, 2006 [DOI] [PMC free article] [PubMed] [Google Scholar]
- Doucet JR, Ryugo DK. Axonal pathways to the lateral superior olive labeled with biotinylated dextran amine injections in the dorsal cochlear nucleus of rats. J Comp Neurol 461: 452–465, 2003 [DOI] [PubMed] [Google Scholar]
- Erulkar SD. Comparative aspects of spatial localization of sound. Physiol Rev 52: 237–360, 1972 [DOI] [PubMed] [Google Scholar]
- Evans EF, Nelson PG. The responses of single neurones in the cochlear nucleus of the cat as a function of their location and the anaesthetic state. Exp Brain Res 17: 402–427, 1973 [DOI] [PubMed] [Google Scholar]
- Finlayson PG, Caspary DM. Low-frequency neurons in the lateral superior olive exhibit phase-sensitive binaural inhibition. J Neurophysiol 65: 598–605, 1991 [DOI] [PubMed] [Google Scholar]
- Friauf E, Ostwald J. Divergent projections of physiologically characterized rat ventral cochlear nucleus neurons as shown by intra-axonal injection of horseradish peroxidase. Exp Brain Res 73: 263–284, 1988 [DOI] [PubMed] [Google Scholar]
- Glendenning KK, Masterton RB, Baker BN, Wenthold RJ. Acoustic chiasm. III: Nature, distribution, and sources of afferents to the lateral superior olive in the cat. J Comp Neurol 310: 377–400, 1991 [DOI] [PubMed] [Google Scholar]
- Greene NT, Lomakin O, Davis KA. Monaural spectral processing differs between the lateral superior olive and the inferior colliculus: physiological evidence for an acoustic chiasm. Hear Res 269: 134–145, 2010a [DOI] [PMC free article] [PubMed] [Google Scholar]
- Greene NT, Lomakin OA, Davis KA. Inhibition shapes the temporal discharge patterns of units in the lateral superior olive: a modeling study. Assoc Res Otolaryngol Abstr 767, 2010b [Google Scholar]
- Grothe B, Sanes DH. Bilateral inhibition by glycinergic afferents in the medial superior olive. J Neurophysiol 69: 1192–1196, 1993 [DOI] [PubMed] [Google Scholar]
- Guinan JJ, Jr, Guinan SS, Norris BE. Single auditory units in the superior olivary complex. I. Responses to sounds and classifications based on physiological properties. Int J Neurosci 4: 101–120, 1972a [Google Scholar]
- Guinan JJ, Jr, Norris BE, Guinan SS. Single auditory units in the superior olivary complex. II. Locations of unit categories and tonotopic organization. Int J Neurosci 4: 147–166, 1972b [Google Scholar]
- Harnischfeger G, Neuweiler G, Schlegel P. Interaural time and intensity coding in superior olivary complex and inferior colliculus of the echolocating bat Molossus ater. J Neurophysiol 53: 89–109, 1985 [DOI] [PubMed] [Google Scholar]
- Irvine D. Physiology of the auditory brainstem. In: The Mammalian Auditory Pathway: Neurophysiology, edited by Fay RR, Popper AN. New York: Springer, 1992, p. 153–231 [Google Scholar]
- Joris PX, Yin TC. Envelope coding in the lateral superior olive. III. Comparison with afferent pathways. J Neurophysiol 79: 253–269, 1998 [DOI] [PubMed] [Google Scholar]
- Kavanagh GL, Kelly JB. Midline and lateral field sound localization in the ferret (Mustela putorius): contribution of the superior olivary complex. J Neurophysiol 67: 1643–1658, 1992 [DOI] [PubMed] [Google Scholar]
- Kotak VC, DiMattina C, Sanes DH. GABAB and Trk receptor signaling mediates long-lasting inhibitory synaptic depression. J Neurophysiol 86: 536–540, 2001 [DOI] [PubMed] [Google Scholar]
- Kuwabara N, Zook JM. Projections to the medial superior olive from the medial and lateral nuclei of the trapezoid body in rodents and bats. J Comp Neurol 324: 522–538, 1992 [DOI] [PubMed] [Google Scholar]
- Kuwada S, Batra R, Stanford TR. Monaural and binaural response properties of neurons in the inferior colliculus of the rabbit: effects of sodium pentobarbital. J Neurophysiol 61: 269–282, 1989 [DOI] [PubMed] [Google Scholar]
- Lu H, Xu TL. The general anesthetic pentobarbital slows desensitization and deactivation of the glycine receptor in the rat spinal dorsal horn neurons. J Biol Chem 277: 41369–41378, 2002 [DOI] [PubMed] [Google Scholar]
- MacGregor RJ. Neural and Brain Modeling. New York: Academic, 1987 [Google Scholar]
- Magnusson AK, Park TJ, Pecka M, Grothe B, Koch U. Retrograde GABA signaling adjusts sound localization by balancing excitation and inhibition in the brainstem. Neuron 59: 125–137, 2008 [DOI] [PubMed] [Google Scholar]
- Mills A. Auditory localization. In: Foundations of Modern Auditory Theory, edited by Tobias JV. New York: Academic, 1972, p. 303–348 [Google Scholar]
- Moore MJ, Caspary DM. Strychnine blocks binaural inhibition in lateral superior olivary neurons. J Neurosci 3: 237–242, 1983 [DOI] [PMC free article] [PubMed] [Google Scholar]
- Rhode WS, Oertel D, Smith PH. Physiological response properties of cells labeled intracellularly with horseradish peroxidase in the cat ventral cochlear nucleus. J Comp Neurol 213: 448–463, 1983 [DOI] [PubMed] [Google Scholar]
- Sanes DH, Rubel EW. The ontogeny of inhibition and excitation in the gerbil lateral superior olive. J Neurosci 8: 682–700, 1988 [DOI] [PMC free article] [PubMed] [Google Scholar]
- Smith PH, Joris PX, Carney LH, Yin TC. Projections of physiologically characterized globular bushy cell axons from the cochlear nucleus of the cat. J Comp Neurol 304: 387–407, 1991 [DOI] [PubMed] [Google Scholar]
- Smith PH, Joris PX, Yin TC. Anatomy and physiology of principal cells of the medial nucleus of the trapezoid body (MNTB) of the cat. J Neurophysiol 79: 3127–3142, 1998 [DOI] [PubMed] [Google Scholar]
- Smith PH, Joris PX, Yin TC. Projections of physiologically characterized spherical bushy cell axons from the cochlear nucleus of the cat: evidence for delay lines to the medial superior olive. J Comp Neurol 331: 245–260, 1993 [DOI] [PubMed] [Google Scholar]
- Song P, Wang N, Wang H, Xie Y, Jia J, Li H. Pentobarbital anesthesia alters neural responses in the precedence effect. Neurosci Lett 498: 72–77, 2011 [DOI] [PubMed] [Google Scholar]
- Spirou GA, Berrebi AS. Glycine immunoreactivity in the lateral nucleus of the trapezoid body of the cat. J Comp Neurol 383: 473–488, 1997 [DOI] [PubMed] [Google Scholar]
- Thompson AM. Heterogeneous projections of the cat posteroventral cochlear nucleus. J Comp Neurol 390: 439–453, 1998 [DOI] [PubMed] [Google Scholar]
- Thompson AM, Thompson GC. Projections from the posteroventral cochlear nucleus to the superior olivary complex in guinea pig: light and EM observations with the PHA-L method. J Comp Neurol 311: 495–508, 1991 [DOI] [PubMed] [Google Scholar]
- Tollin DJ. The lateral superior olive: a functional role in sound source localization. Neuroscientist 9: 127–143, 2003 [DOI] [PubMed] [Google Scholar]
- Tollin DJ, Yin TC. The coding of spatial location by single units in the lateral superior olive of the cat. I. Spatial receptive fields in azimuth. J Neurosci 22: 1454–1467, 2002 [DOI] [PMC free article] [PubMed] [Google Scholar]
- Tollin DJ, Yin TC. Interaural phase and level difference sensitivity in low-frequency neurons in the lateral superior olive. J Neurosci 25: 10648–10657, 2005 [DOI] [PMC free article] [PubMed] [Google Scholar]
- Tsai JJ, Koka K, Tollin DJ. Varying overall sound intensity to the two ears impacts interaural level difference discrimination thresholds by single neurons in the lateral superior olive. J Neurophysiol 103: 875–886, 2010 [DOI] [PMC free article] [PubMed] [Google Scholar]
- Tsuchitani C. Discharge patterns of cat lateral superior olivary units to ipsilateral tone-burst stimuli. J Neurophysiol 47: 479–500, 1982 [DOI] [PubMed] [Google Scholar]
- Tsuchitani C. Functional organization of lateral cell groups of cat superior olivary complex. J Neurophysiol 40: 296–318, 1977 [DOI] [PubMed] [Google Scholar]
- Tsuchitani C. The inhibition of cat lateral superior olive unit excitatory responses to binaural tone bursts. I. The transient chopper response. J Neurophysiol 59: 164–183, 1988a [DOI] [PubMed] [Google Scholar]
- Tsuchitani C. The inhibition of cat lateral superior olive unit excitatory responses to binaural tone bursts. II. The sustained discharges. J Neurophysiol 59: 184–211, 1988b [DOI] [PubMed] [Google Scholar]
- Tsuchitani C, Boudreau JC. Single unit analysis of cat superior olive S segment with tonal stimuli. J Neurophysiol 29: 684–697, 1966 [DOI] [PubMed] [Google Scholar]
- Tsuchitani C, Johnson DH. The effects of ipsilateral tone burst stimulus level on the discharge patterns of cat lateral superior olivary units. J Acoust Soc Am 77: 1484–1496, 1985 [DOI] [PubMed] [Google Scholar]
- Warr WB. Fiber degeneration following lesions in the anterior ventral cochlear nucleus of the cat. Exp Neurol 14: 453–474, 1966 [DOI] [PubMed] [Google Scholar]
- Warr WB. Fiber degeneration following lesions in the multipolar and globular cell areas in the ventral cochlear nucleus of the cat. Brain Res 40: 247–270, 1972 [DOI] [PubMed] [Google Scholar]
- Warr WB, Beck JE. Multiple projections from the ventral nucleus of the trapezoid body in the rat. Hear Res 93: 83–101, 1996 [DOI] [PubMed] [Google Scholar]
- Wenthold RJ, Huie D, Altschuler RA, Reeks KA. Glycine immunoreactivity localized in the cochlear nucleus and superior olivary complex. Neuroscience 22: 897–912, 1987 [DOI] [PubMed] [Google Scholar]
- Wu SH, Kelly JB. Physiological evidence for ipsilateral inhibition in the lateral superior olive: synaptic responses in mouse brain slice. Hear Res 73: 57–64, 1994 [DOI] [PubMed] [Google Scholar]
- Young ED, Brownell WE. Responses to tones and noise of single cells in dorsal cochlear nucleus of unanesthetized cats. J Neurophysiol 39: 282–300, 1976 [DOI] [PubMed] [Google Scholar]
- Young ED, Robert JM, Shofner WP. Regularity and latency of units in ventral cochlear nucleus: implications for unit classification and generation of response properties. J Neurophysiol 60: 1–29, 1988 [DOI] [PubMed] [Google Scholar]
- Zhou Y, Colburn HS. A modeling study of the effects of membrane afterhyperpolarization on spike interval statistics and on ILD encoding in the lateral superior olive. J Neurophysiol 103: 2355–2371, 2010 [DOI] [PMC free article] [PubMed] [Google Scholar]
- Zilany MS, Bruce IC. Modeling auditory-nerve responses for high sound pressure levels in the normal and impaired auditory periphery. J Acoust Soc Am 120: 1446–1466, 2006 [DOI] [PubMed] [Google Scholar]