

Introduction
Optical coherence tomography (OCT) is a non-contact medical imaging technology similar to x-ray imaging and magnetic resonance imaging (MRI). Simply stated, OCT uses reflected light to produce a detailed, cross-sectional image of the eye. Image capture is non-invasive, fast, and painless.
Time domain (TD) OCT was first used in 1991 to visualize the eye.1 Although useful, images obtained using TD-OCT were two-dimensional, image acquisition time was slow, and the axial resolution of the devices prohibited detailed analyses of retinal structure. In 2004, spectral domain (SD)-OCT [also commonly referred to as Fourier domain (FD)-OCT] entered clinical practice.2 The generation of three-dimensional images, increased speed of image acquisition, and increased axial resolution are three of the major advancements seen in the SD-OCT devices used today. Having axial resolution between 1 and 5 microns, the newest SD-OCT devices provide detailed measurements of the retinal nerve fiber layer (RNFL) and the macula. The images obtained from the newest SD-OCT devices are of sufficient resolution to permit segmentation and measurement of individual retinal layers using computer-assisted programs.
Quantitative SD-OCT is increasingly being used to detect eye disease, monitor changes in the progression of eye disease, and assess the efficacy of current and novel treatments for eye diseases in pediatric patients. For adult patients, SD-OCT devices routinely compare the results obtained to a normative reference range, allowing for automatic detection of abnormalities. Unfortunately, as is the case with the Spectralis SD-OCT (Heidelberg Engineering) used in this study, the norms provided by SD-OCT devices are for individuals 18 years of age and older. There are no internal standards with which to compare the results obtained in children.
Recently, Turk et al. used the Spectralis SD-OCT to assess macular thickness, macular volume, and RNFL thickness in a cohort of 107 6-16 year old Turkish children.3 We want to expand upon this study in two ways, 1) we want to compile a normative database of North American children, including children of more diverse racial and ethnic backgrounds, and 2) we want to provide reference ranges for retinal layer thicknesses from the SD-OCT images in order to broaden the scope of the normative database. Normative data for individual retinal layers segmented in SD-OCT images may be useful in the differential diagnosis and management of vitreoretinal dystrophies and optic nerve disease, and can be useful in guiding molecular genetic testing.
Methods
This prospective cross-sectional study and data accumulation were approved by the Institutional Review Board of the University of Texas Southwestern Medical Center (Dallas, TX). All data was collected at the Retina Foundation of the Southwest (Dallas, TX). Informed consent to participate in the research study was obtained from a parent or legal guardian. Assent was obtained from subjects between the ages of 10 and 15 years. The Retina Foundation of the Southwest complies with HIPAA regulations.
Subjects
A total of 83 healthy, North American children (aged 5-15 years) were enrolled in this study. All children were seen at the Retina Foundation of the Southwest in Dallas, Texas. Children were included in this study if they were born at term (≥ 37 weeks post-conception), had best-corrected visual acuity of -0.10 to 0.20 logMAR, normal stereoacuity, no ocular abnormalities, no developmental delay, and no family history of retinal or optic nerve diseases or glaucoma. Of the 83 children, 45 were male and 38 were female; 3 were 5 years old, 10 were 6 years old, 13 were 7 years old, 12 were 8 years old, 13 were 9 years old, 6 were 10 years old, 10 were 11 years old, 6 were 12 years old, 4 were 13 years old, 4 were 14 years old, and 2 were 15 years old; 57 were non-Hispanic white, 5 were African American, 7 were Hispanic, 6 were Asian, 6 were more than one race/ethnicity, and 2 were not reported.
Spectral Domain OCT (SD-OCT) Imaging
Imaging was accomplished with the Spectralis SD-OCT (Heidelberg Engineering; Vista, CA), using the automatic real time (ART) eye tracker to eliminate motion artifacts. All children had pupil sizes larger than 3 mm, precluding the need for dilation. For each child, 3-5 high-resolution horizontal line scans (9 mm) and 2-3 high-density volume scans (5.9 X 4.4 mm or 8.6 X 7.2 mm, comprised of 19 or 31 B-scans, respectively) were obtained from the macular region of the right eye. Based on quality scores, one 9-mm horizontal foveal scan image and one volume scan image were chosen for analyses. Quality scores for scans are assigned by the Spectralis and expressed as a signal-to-noise ratio (SNR) in decibels (dB). Scans above 20 dB are considered high quality. The average SNR value for the line scans reported in this manuscript were 33.5 ± 5.9 dB (mean ± standard deviation). The average SNR value for the volume scans reported in this manuscript were 29.6 ± 7.3 dB.
Results obtained from the high-speed volume scans of the macula were classified by region, as shown in Figure 1. The retinal thickness map was used to determine the numeric averages of thickness for 5 subfields within the ETDRS grid.4 Because some of the children had volume scans that did not fill the entire template, we determined the average thickness within the 1 mm diameter central foveal subfield (CFS) and the average thicknesses within the nasal, temporal, superior, and inferior segments of the 3 mm diameter annulus.
Figure 1.
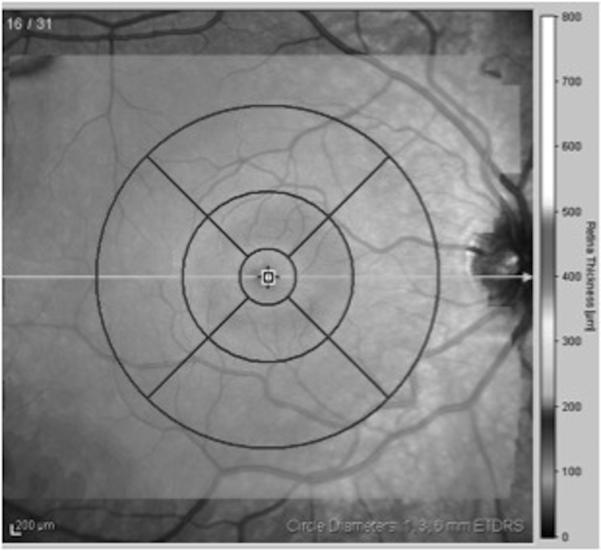
Early Treatment Diabetic Retinopathy Subfield template4 used to derive macular thickness measurements from different regions of a high-density volume scan of the macula. Circles are 1, 3, and 6 mm in diameter.
Two or three high-speed peripapillary RNFL circle scans (circle scan size: 3.5 mm) were also obtained. Based on quality (average SNR values were 29.8 ± 6.9 dB), one RNFL image was chosen for analysis. The peripapillary RNFL thickness measurements (microns) were automatically calculated by the Spectralis SD-OCT, and provided a global average (G) and the average thickness for each of 6 sectors (Figure 2): temporal (T), temporal-superior (TS), temporal-inferior (TI), nasal (N), nasal-superior (NS), nasal-inferior (NI).
Figure 2.
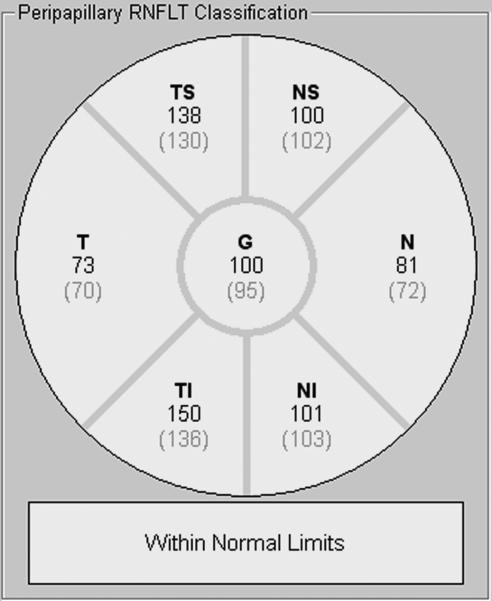
Sample retinal nerve fiber layer report provided by the Spectralis device for a retinal nerve fiber layer scan. Numbers directly under each sector name are the individual's mean retinal nerve fiber layer thickness (microns). Numbers in parentheses are the mean thickness of adults in the Spectralis normative database.17,18
Retinal Segmentation
High-resolution horizontal line scans were segmented using a custom-designed program built in IGOR Pro (IGOR Pro 6.12; WaveMetrics, Inc.; Lake Oswego, OR). This program was used to profile and measure the thickness of individual retinal layers, and layer combinations (Figure 3).5-7 The segmentation approach is comparable to the software developed by Hood et al (MATLAB based; MathWorks; Natick, MA).8 The following layer and layer combination thicknesses were measured: total retinal thickness (TR), retinal nerve fiber layer (RNFL), retinal ganglion cell layer (RGC)+ (GCL + inner plexiform layer [IPL]), inner nuclear layer (INL), outer nuclear layer (ONL), photoreceptor inner segments (IS), photoreceptor outer segments (OS), retinal pigment epithelium + Bruch's membrane (RPE), OS+ (OS + RPE), and receptors (REC)+ (outer plexiform layer + ONL + IS + OS + RPE). Layer thicknesses from the segmented images were sampled at the center of the fovea (foveola) and at ± 2mm from the center of the fovea (outside the rim of the foveal pit).
Figure 3.
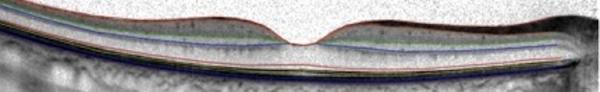
Representative Spectralis line scan image segmented using the IGOR segmentation program. Following manual segmentation, the program provides thickness measurements for each of ten retinal layers or layer combinations (see text for additional details).
Two individuals (SEY, CSP) independently marked retinal layer boundaries after a training period during which they discussed the boundaries of a sample set of scans with an experienced segmenter (YW). It has been shown that after a training period, between-segmenter reliability is quite good.9 The mean (range) of the concordance correlation coefficients for each retinal segmentation measurement was 0.9967 (0.9957 to 0.9975). The results of the two graders were averaged.
Statistical analysis
Statistical analyses were performed using MedCalc Software Version 12.2.1 (Mariakerke, Belgium). Two-way analyses of variance (ANOVAs) were used to examine the effects of sex and race/ethnicity (non-Hispanic white vs. other race/ethnicity) on measured thicknesses. The effect of age on measured thicknesses was assessed using linear regression.
Results
Macular Thickness
The average macular thickness values for the 1 mm diameter central foveal subfield and for each segment of the 3 mm diameter circle are shown in Table 1. There were no significant effects of sex (p = 0.134) or race/ethnicity (p = 0.177) on central foveal subfield thickness. However, linear regression analysis demonstrated a significant increase in central foveal subfield thickness with age (p = 0.032; Figure 4).
Table 1.
Macular thickness (μm) measures in normal children.
| Circle Diameter | All (n=83) microns (SEM) | Male (n=45) microns (SEM) | Female (n=48) microns (SEM) | NHW (n=57) microns (SEM) | Other (n=26) microns (SEM) | |
|---|---|---|---|---|---|---|
| 1 mm | CSF | 271.2 (2.0) | 274.1 (2.5) | 267 (3.3) | 274.1 (2.3) | 263.1 (3.8) |
| 3 mm | N | 334.9 (2.2) | 340.4 (2.1) | 326.8 (3.9) | 335.3 (2.6) | 332.0 (4.0) |
| T | 331.8 (1.7) | 335. 9 (1.8) | 326.0 (2.9) | 331.3 (1.7) | 331.9 (4.2) | |
| S | 346.6 (1.7) | 349.3 (1.8) | 342.8 (3.0) | 345.6 (1.8) | 348.7 (3.9) | |
| I | 333.4 (2.1) | 338.4 (2.1) | 326.2 (3.8) | 334.0 (2.2) | 330.3 (5.1) | |
* Values are means ± (SEM). CSF = central subfield; N = nasal; T = temporal; S = superior; I = inferior; NHW = Non-Hispanic White; Other = Black, Hispanic, Asian, and individuals of more than one race.
Figure 4.
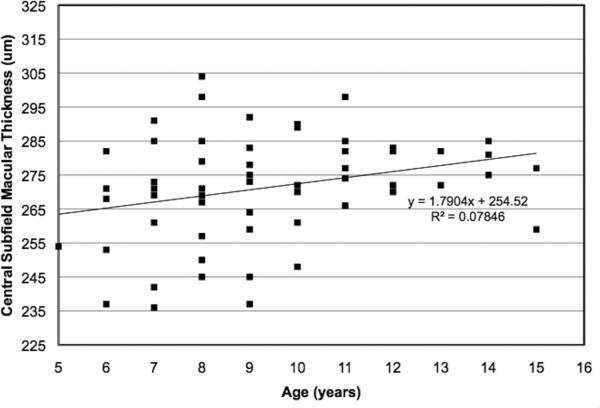
The relationship between age and 1mm-diameter central subfield macular thickness in 83 normal children, aged 5-15 years. Central subfield macular thickness was measured using the Spectralis optical coherence tomography device, using the Early Treatment Diabetic Retinopathy Subfield template.4 A significant increase in central subfield macular thickness was found with increasing age (Pearson r = 0.28; p = 0.032).
Peripapillary RNFL Thickness
The average peripapillary RNFL thickness values for each sector of the circular scan are shown in Table 2. Peripapillary RNFL thickness was greatest in the superior and inferior segments and thinner in the nasal and temporal segments. There were no significant effects of sex (p = 0.951) or race/ethnicity (p = 0.053) on global peripapillary RNFL thickness. Linear regression analysis failed to demonstrate any change in global peripapillary RNFL thickness by age (p = 0.702).
Table 2.
Peripapillary retinal nerve fiber layer thickness (μm) measures in normal children.
| Sector | All (n=83) microns (SEM) | Male (n=45) microns (SEM) | Female (n=48) microns (SEM) | NHW (n=57) microns (SEM) | Others (n=26) microns (SEM) |
|---|---|---|---|---|---|
| Global | 107.6 (1.2) | 107.7 (1.6) | 107.4 (1.7) | 105.3 (1.4) | 112.9 (2.0) |
| T | 76.5 (1.9) | 76.1 (2.8) | 77.0 (2.6) | 74.2 (1.9) | 84.7 (3.5) |
| TS | 145.1 (2.2) | 146.5 (2.9) | 143.5 (3.2) | 141.8 (2.5) | 152.5 (4.0) |
| TI | 147.0 (2.1) | 145.2 (2.9) | 149.0 (3.2) | 142.2 (2.1) | 157.6 (4.8) |
| N | 84.5 (1.9) | 84.9 (2.9) | 84.1 (2.3) | 84.8 (2.1) | 84.1 (4.2) |
| NS | 116.2 (2.8) | 117.7 (3.4) | 114.5 (4.5) | 114.5 (3.1) | 121. 0 (6.1) |
| NI | 125.4 (3.0) | 124.7 (4.4) | 126.2 (4.0) | 122.2 (3.5) | 131.6 (5.7) |
* Values are means ± (SEM). G = global average; T= temporal; TS = temporal-superior; TI = temporal-inferior; N = nasal; NS= nasal-superior; NI = nasal-inferior; NHW = Non-Hispanic White; Other = Black, Hispanic, Asian, and individuals of more than one race.
Retinal Layer Thickness
Table 3 summarizes the segmented retinal layer thicknesses at the foveola and ± 2 mm from the foveal center. There were no significant effects of sex (p = 0.808) or race/ethnicity (p = 0.458) on total retinal thickness at the fovea. Linear regression analysis failed to demonstrate any change in total retinal thickness at the foveola by age (p = 0.413). Both outer segment and inner segment layers were significantly thicker in the fovea than at ± 2 mm from the foveal center (p < 0.0001 and p < 0.001, respectively). As expected, inner retinal layers were not measurable at the fovea and the RNFL was thicker in the nasal than in the temporal retina.
Table 3.
Retinal layer thicknesses (μm) in normal children.
| Layer | Center of fovea microns (SEM) | 2 mm nasal microns (SEM) | 2 mm temporal microns (SEM) |
|---|---|---|---|
| TR | 219.6 (1.7) | 329.2 (2.3) | 298.3 (1.9) |
| RNFL | -- | 35.6 (0.7) | 14.5 (0.5) |
| RGC+ | -- | 84.6 (0.9) | 79.7 (0.7) |
| INL | -- | 45.0 (1.5) | 41.3 (1.5) |
| ONL | -- | 91.2 (1.2) | 89.8 (1.1) |
| IS | 32.5 (0.5) | 24.9 (0.5) | 24.3 (0.5) |
| OS | 44.3 (0.9) | 28.1 (0.6) | 28.5 (0.6) |
| RPE | 22.5 (0.6) | 21.8 (0.5) | 21.7 (0.5) |
| OS+ | 66.9 (0.8) | 49.8 (0.5) | 50.1 (0.4) |
| REC+ | 210.2 (2.4) | 164.0 (1.9) | 162.9 (1.9) |
* Values are means ± (SEM). The following layers, or layer combinations, were measured: total retinal thickness (TR), retinal nerve fiber layer (RNFL), retinal ganglion cell layer (RGC)+ (GCL + inner plexiform layer [IPL]), inner nuclear layer (INL), outer nuclear layer (ONL), photoreceptor inner segments (IS), photoreceptor outer segments (OS), retinal pigment epithelium + Bruch's membrane (RPE), OS+ (OS + RPE), and receptors (REC)+ (outer plexiform layer + ONL + IS + OS + RPE). Values for the RNFL, RGC+, and INL are denoted by dashes due to their absence at the center of the fovea. ONL values are similarly denoted by dashes due to the confounding inclusion of Henle fibers in ONL thickness measurement at the center of the fovea.
Normative Reference Ranges
For each of the thickness parameters, data normality was assessed using the Kolmogorov-Smirnov test. All parameters were normally distributed. Normative ranges of each parameter were constructed for children ages 5-15 years by determining the values corresponding to the 5th / 95th and 1st / 99th percentiles (Table 4). Values that lie within the range of the 5th-95th percentiles may be considered normal. Those that lie outside of this range but within the 1st-99th percentiles may be considered borderline. Values that lie beyond the 1st or 99th percentile may be considered abnormal.
Table 4.
Normative reference ranges for macular thickness, retinal nerve fiber layer thickness, and retinal layer thicknesses (μm) in children.
| Circle Diameter | Mean (SEM) | 5th p | 95th p | 1st p | 99th p | |
|---|---|---|---|---|---|---|
| 1 mm | CSF | 271.2 (2.0) | 239.3 | 295.3 | 236.1 | 303.5 |
| 3 mm | N | 334.9 (2.2) | 308.1 | 357.7 | 283.3 | 368.4 |
| T | 331.8 (1.7) | 310.4 | 353.1 | 300.2 | 361.3 | |
| S | 346.6 (1.7) | 323.5 | 366.6 | 323.0 | 380.9 | |
| I | 333.4 (2.1) | 302.0 | 358.0 | 295.0 | 370.8 | |
| RNFL | Global | 107.6 (1.2) | 91.0 | 127.3 | 83.5 | 136.1 |
| T | 76.5 (1.9) | 58.1 | 104.3 | 21.3 | 137.1 | |
| TS | 145.1 (2.2) | 112.6 | 179.6 | 99.5 | 198.9 | |
| TI | 147.0 (2.1) | 115.6 | 184.9 | 108.3 | 194.5 | |
| N | 84.5 (1.9) | 66.6 | 113.0 | 39.3 | 132.6 | |
| NS | 116.2 (2.8) | 78.1 | 156.3 | 66.5 | 194.9 | |
| NI | 125.4 (3.0) | 82.0 | 174.9 | 67.0 | 183.5 | |
| Retinal Layer (fovea) | TR | 219.6 (1.7) | 196.7 | 250.2 | 187.2 | 261.7 |
| RNFL | -- | -- | -- | -- | -- | |
| RGC+ | -- | -- | -- | -- | -- | |
| INL | -- | -- | -- | -- | -- | |
| ONL | -- | -- | -- | -- | -- | |
| IS | 32.5 (0.5) | 25.5 | 39.9 | 19.4 | 43.1 | |
| OS | 44.3 (0.9) | 30.4 | 59.4 | 23.1 | 62.2 | |
| RPE | 22.5 (0.6) | 13.8 | 32.2 | 9.6 | 36.5 | |
| OS+ | 66.9 (0.8) | 56.1 | 79.6 | 48.8 | 83.4 | |
| REC+ | 210.2 (2.4) | 187.6 | 232.4 | 87.9 | 247.0 | |
* Values are means ± (SEM). CSF = central subfield; N = nasal; T = temporal; S = superior; I = inferior; G = global average; TS = temporal-superior; TI = temporal-inferior; NS= nasal-superior; NI = nasal-inferior; TR = total retinal thickness; RNFL = retinal nerve fiber layer; RGC+ = GCL + IPL; INL = inner nuclear layer; ONL = outer nuclear layer; IS = photoreceptor inner segments; OS = photoreceptor outer segments; RPE = retinal pigment epithelium + Bruch's membrane; OS+ = OS + RPE; REC+ = outer plexiform layer + ONL + IS + OS + RPE. Values for the RNFL, RGC+, and INL are denoted by dashes due to their absence at the center of the fovea. ONL values are similarly denoted by dashes due to the confounding inclusion of Henle fibers in ONL thickness measurement at the center of the fovea.
Discussion
SD-OCT is increasingly being utilized as a diagnostic and monitoring tool in children with visual loss. Because of short exposure durations and eye-tracking systems in devices such as the Heidelberg Spectralis, quality images (with SNRs > 20 dB), can be obtained in over 95% of children aged 5 years or older. Scans of the central retina are useful for identifying, monitoring, and classifying children with genetic retinal diseases such as Leber congenital amaurosis, retinitis pigmentosa, and Stargardt disease, or with abnormal retinal development such as in retinopathy of prematurity. Peripapillary RNFL scans can be useful for the detection and monitoring of glaucoma, optic nerve hypoplasia, and optic neuritis. However, for the scans to be the most useful for detecting diseases in children, quantitative measures from children should be compared to age-matched normal controls. Normal values from children are not currently available from manufacturers, and there is only a single normative study of Turkish children3 available in the literature. The present study establishes a normative pediatric database for macular thickness, peripapillary retinal nerve fiber layer (RNFL) thickness, and retinal layer thicknesses in healthy North American children using the Spectralis SDOCT.
Strengths of this study included a large cohort of healthy North American children with diverse racial and ethnic backgrounds, and the use of a current SD-OCT technology with reproducible thickness measurements when used to test normal control adults and adult patients with degenerative retinal diseases.7,10-13 One limitation of our study is that axial length was not measured; however, axial length has minimal influence on macular and RNFL thickness measurements.3,14 Morisbakk et al. showed that scan-depth settings with Spectralis SD-OCT have no effect on measured central foveal thickness in eyes with axial lengths that are within the range of the default setting (Morisbakk TL, et al. ARVO 2011;52:ARVO E-Abstract 4048). Our cohort had normal distance visual acuity, so it is unlikely that they had significant myopia and increased axial length. Another limitation is that, although there was racial and ethnic diversity, our sample size was not sufficient to evaluate differences among each racial and ethnic group beyond comparing non-Hispanic white children to the other racial/ethnic groups taken together.
The average macular thickness (central subfield thickness) among all children aged 5-15 years of age was 271.2 ± 2.0 μm. This value is similar to that reported previously for Turkish children ages 6-16 years3 and comparable to the data from healthy adults obtained with Spectralis SD-OCT.10,15 Despite the overall similarity to adult values, there was a significant increase in macular thickness between ages 5 and 15 years, with central subfield thickness averaging 10 μm less in children aged 5-7 years than in children aged 11-15 years. This trend is consistent with anatomical studies suggesting continued development of the fovea beyond the age of 5 years.16,17 Unlike the study of children in Turkey3, no significant sex differences in central subfield thickness were found, although we did see a similar trend (males having a thicker CSF than females).
The mean peripapillary RNFL thickness in children aged 5 to 15 years was 107.6 ± 1.2 μm, which is significantly higher than normative data for healthy Caucasian adults (18-78 years old) included in the Spectralis software.18,19 Furthermore, the thicker RNFL in children is consistent with the significant negative correlation reported previously in adults between RNFL thickness and age.18,20 Increased thickness relative to the Spectralis norms was most evident in the inferior and superior sectors, consistent with continued development of the maculo-papillar bundle beyond the age of 5 years.
The thicknesses of individual layers of the macula were measured with a manually-assisted computer segmentation program. Segmentation values at the foveola reflected the characteristic displacement of inner retinal layers; the RNFL, RGC+, INL, and OPL were minimally detectable. The ONL-Henle fiber layer and RPE layer thicknesses were comparable to those of adults. The outer segment (OS) layer was 36% thinner in children than it is in adults,8 consistent with the report that outer segments of 4-year-old children are 30-50% shorter than those of adults.17 Segmentation at ± 2 mm eccentricity (beyond the foveal rim) demonstrated thickness values in children comparable to those of adults, a thicker RNFL nasally than temporally, and shorter OS compared to the OS at the foveola. In this study, sex did not affect total retinal thickness values.
SD-OCT may be especially useful for children with glaucoma or retinal diseases because it provides high-resolution, objective, quantitative assessments of the retinal layers affected by various diseases. The normative reference ranges for each of the SD-OCT parameters for children aged 5-15 years enhance our ability to diagnose pediatric disorders affecting the retina and optic nerve, and provide guidance for molecular testing.21-24
Acknowledgements
a. Funding/Support: Supported by a Fight for Sight Post-doctoral Fellowship Award (SEY), a Gerber Foundation Novice Researcher Award (JW), and grants from the National Eye Institute [EY022313 (EEB) and EY09076 (DGB)], OneSight Foundation (JW), and the Once Upon A Time Foundation (JW).
d. Other Acknowledgments: None.
Biography

Footnotes
Publisher's Disclaimer: This is a PDF file of an unedited manuscript that has been accepted for publication. As a service to our customers we are providing this early version of the manuscript. The manuscript will undergo copyediting, typesetting, and review of the resulting proof before it is published in its final citable form. Please note that during the production process errors may be discovered which could affect the content, and all legal disclaimers that apply to the journal pertain.
c. Contributions to Authors in each of these areas: Conception and design (DGB, EEB); Analysis and interpretation (SEY, JW, CSP, KIL, YW, DGB, EEB); Writing the article (SEY, DGB, EEB); Critical revision of the article (SEY, JW, CSP, KIL, YW, DGB, EEB); Final approval of the article (SEY, JW, CSP, KIL, YW, DGB, EEB); Data collection (SEY, JW, CSP, KIL, YW, DGB, EEB); Provision of materials, patients, or resources (DGB, EEB); Statistical expertise (SEY, YW, EEB); Obtaining funding (SEY, JW, DGB, EEB); Literature search (SEY, YW, DGB, EEB); Administrative, technical, or logistical support (YW, EEB).
b. Financial Disclosures: All authors have completed and submitted the ICMJE form for disclosure of potential conflicts of interest. The authors report the following financial disclosures: SEY: none; JW: none; CSP: none; KIL: none; YW: none; DGB: none; EEB: research grants from Mead Johnson Nutrition and Martek Biosciences.
References
- 1.Huang D, Swanson EA, Lin CP, et al. Optical coherence tomography. Science. 1991;254(5035):1178–1181. doi: 10.1126/science.1957169. [DOI] [PMC free article] [PubMed] [Google Scholar]
- 2.Drexler W, Sattmann H, Hermann B, et al. Enhanced visualization of macular pathology with the use of ultrahigh resolution optical coherence tomography. Arch Ophthalmol. 2003;121(5):695–706. doi: 10.1001/archopht.121.5.695. [DOI] [PubMed] [Google Scholar]
- 3.Turk A, Ceylan OM, Arici C, et al. Evaluation of the nerve fiber layer and macula in the eyes of healthy children using spectral-domain optical coherence tomography. Am J Ophthalmol. 2012;153(3):552–559. doi: 10.1016/j.ajo.2011.08.026. [DOI] [PubMed] [Google Scholar]
- 4.Early Treatment Diabetic Retinopathy Study design and baseline patient characteristics. ETDRS report number 7. Ophthalmology. 1991;98(5 Suppl):741–756. doi: 10.1016/s0161-6420(13)38009-9. [DOI] [PubMed] [Google Scholar]
- 5.Wen Y, Klein M, Hood DC, Birch DG. Relationships among multifocal electroretinogram amplitude, visual field sensitivity, and SD-OCT receptor layer thicknesses in patients with retinitis pigmentosa. Invest Ophthalmol Vis Sci. 2012;53(2):833–840. doi: 10.1167/iovs.11-8410. [DOI] [PMC free article] [PubMed] [Google Scholar]
- 6.Wen Y, Locke KG, Klein M, et al. Phenotypic characterization of 3 families with autosomal dominant retinitis pigmentosa due to mutations in KLHL7. Arch Ophthalmol. 2011;129(11):1475–1482. doi: 10.1001/archophthalmol.2011.307. [DOI] [PMC free article] [PubMed] [Google Scholar]
- 7.Birch DG, Wen Y, Locke K, Hood DC. Rod sensitivity, cone sensitivity, and photoreceptor layer thickness in retinal degenerative diseases. Invest Ophthalmol Vis Sci. 2011;52(10):7141–7147. doi: 10.1167/iovs.11-7509. [DOI] [PMC free article] [PubMed] [Google Scholar]
- 8.Hood DC, Lin CE, Lazow MA, Locke KG, Zhang X, Birch DG. Thickness of receptor and post-receptor retinal layers in patients with retinitis pigmentosa measured with frequency-domain optical coherence tomography. Invest Ophthalmol Vis Sci. 2009;50(5):2328–2336. doi: 10.1167/iovs.08-2936. [DOI] [PMC free article] [PubMed] [Google Scholar]
- 9.Hood DC, Cho J, Raza AS, Dale EA, Wang M. Reliability of computer-aided manual procedure for segmenting optical coherence tomography scans. Optom Vis Sci. 2011;88(1):113–123. doi: 10.1097/OPX.0b013e3181fc3625. [DOI] [PMC free article] [PubMed] [Google Scholar]
- 10.Garcia-Martin E, Pinilla I, Sancho E, et al. Optical coherence tomography in retinitis pigmentosa: Reproducibility and capacity to detect macular and retinal nerve fiber layer thickness alterations. Retina. 2012 Mar 29; doi: 10.1097/IAE.0b013e318242b838. DOI: 10.1097/IAE.0b013e318242b854. [DOI] [PubMed] [Google Scholar]
- 11.Seigo MA, Sotirchos ES, Newsome S, et al. In vivo assessment of retinal neuronal layers in multiple sclerosis with manual and automated optical coherence tomography segmentation techniques. J Neurol. 2012 Mar 15; doi: 10.1007/s00415-012-6466-x. DOI: 10.1007/s00415-012-6466-x. [DOI] [PubMed] [Google Scholar]
- 12.Wu H, de Boer JF, Chen TC. Diagnostic capability of spectral-domain optical coherence tomography for glaucoma. Am J Ophthalmol. 2012;153(5):815–826.e2. doi: 10.1016/j.ajo.2011.09.032. [DOI] [PMC free article] [PubMed] [Google Scholar]
- 13.Lazow MA, Hood DC, Ramachandran R, et al. Transition zones between healthy and diseased retina in choroideremia (CHM) and Stargardt disease (STGD) as compared to retinitis pigmentosa (RP). Invest Ophthalmol Vis Sci. 2011;52(13):9581–9590. doi: 10.1167/iovs.11-8554. [DOI] [PMC free article] [PubMed] [Google Scholar]
- 14.Tariq YM, Samarawickrama C, Pai A, Burlutsky G, Mitchell P. Impact of ethnicity on the correlation of retinal parameters with axial length. Invest Ophthalmol Vis Sci. 2010;51(10):4977–4982. doi: 10.1167/iovs.10-5226. [DOI] [PubMed] [Google Scholar]
- 15.Grover S, Murthy RK, Brar VS, Chalam KV. Comparison of retinal thickness in normal eyes using Stratus and Spectralis optical coherence tomography. Invest Ophthalmol Vis Sci. 2010;51(5):2644–2647. doi: 10.1167/iovs.09-4774. [DOI] [PubMed] [Google Scholar]
- 16.Hendrickson AE, Yuodelis C. The morphological development of the human fovea. Ophthalmology. 1984;91(6):603–612. doi: 10.1016/s0161-6420(84)34247-6. [DOI] [PubMed] [Google Scholar]
- 17.Yuodelis C, Hendrickson A. A qualitative and quantitative analysis of the human fovea during development. Vision Res. 1986;26(6):847–855. doi: 10.1016/0042-6989(86)90143-4. [DOI] [PubMed] [Google Scholar]
- 18.Bendschneider D, Tornow RP, Horn FK, et al. Retinal nerve fiber layer thickness in normals measured by spectral domain OCT. J Glaucoma. 2010;19(7):475–482. doi: 10.1097/IJG.0b013e3181c4b0c7. [DOI] [PubMed] [Google Scholar]
- 19.Spectralis HRA+OCT User Guide Software Version 5.3. Heidelberg Engineering GmbH; 2010. pp. 60–62. [Google Scholar]
- 20.Ooto S, Hangai M, Tomidokoro A, et al. Effects of age, sex, and axial length on the three-dimensional profile of normal macular layer structures. Invest Ophthalmol Vis Sci. 2011;52(12):8769–8779. doi: 10.1167/iovs.11-8388. [DOI] [PubMed] [Google Scholar]
- 21.Pasadhika S, Fishman GA, Stone EM, et al. Differential macular morphology in patients with RPE65-, CEP290-, GUCY2D-, and AIPL1-related Leber congenital amaurosis. Invest Ophthalmol Vis Sci. 2010;51(5):2608–2614. doi: 10.1167/iovs.09-3734. [DOI] [PMC free article] [PubMed] [Google Scholar]
- 22.Mackay DS, Henderson RH, Sergouniotis PI, et al. Novel mutations in MERTK associated with childhood onset rod-cone dystrophy. Mol Vis. 2010;16:369–377. [PMC free article] [PubMed] [Google Scholar]
- 23.Genead MA, Fishman GA, Rha J, et al. Photoreceptor structure and function in patients with congenital achromatopsia. Invest Ophthalmol Vis Sci. 2011;52(10):7298–7308. doi: 10.1167/iovs.11-7762. [DOI] [PMC free article] [PubMed] [Google Scholar]
- 24.Duncan JL, Ratnam K, Birch DG, et al. Abnormal cone structure in foveal schisis cavities in X-linked retinoschisis from mutations in exon 6 of the RS1 gene. Invest Ophthalmol Vis Sci. 2011;52(13):9614–9623. doi: 10.1167/iovs.11-8600. [DOI] [PMC free article] [PubMed] [Google Scholar]