

Abstract
We investigated sweet-bitter and umami-bitter mixture taste interactions by presenting sucrose or umami stimuli mixed with quinine hydrochloride (QHCl) while recording single-unit activity of neurons in the parabrachial nucleus (PbN) of urethane-anesthetized C57BL/6J mice. A total of 70 taste-responsive neurons were classified according to which stimulus evoked the greatest net response (36 sucrose-best, 19 NaCl-best, 6 citric acid-best, and 9 QHCl-best). Although no neurons responded best to monopotassium glutamate (MPG) or inosine 5′-monophosphate (IMP), the combination of these two stimuli evoked a synergistic response (i.e., response > 120% of the sum of the component responses) in all sucrose-best and some NaCl-best neurons (n = 43). Adding QHCl to sucrose or MPG + IMP resulted in suppression of the response (responses to mixture < responses to the more effective component) in 41 of 43 synergistic neurons. Neurons showing QHCl suppression were classified into two types: an “MS1” type (n = 27) with suppressed responses both to sucrose and MPG + IMP and an “MS2” type (n = 14) that showed suppressed responses only to sucrose. No neuron displayed suppressed responses to MPG or IMP alone. The suppression ratio (1 − mixture response/sucrose or MPG + IMP response) of sucrose and MPG + IMP in MS1 neurons had a weak positive correlation (r = 0.36). The pattern of reconstructed recording sites of neuron types suggested chemotopic organization in the PbN. Although a peripheral basis for QHCl suppression has been demonstrated, our results suggest that convergence in the PbN plays a role in shaping responses to taste mixtures.
Keywords: taste mixture, mixture interaction, umami taste, mouse, parabrachial nucleus
in natural settings, animals including humans normally experience the taste of foodstuffs consisting of two or more chemicals that individually stimulate different gustatory receptor mechanisms, resulting in the elicitation of more than one taste quality. Human psychophysical studies show that a binary taste mixture often elicits a complex perceptual interaction, although each component can be separately perceived (for review see Keast and Breslin 2003; Kroeze 1989; McBride 1989). Although much debate has focused on coding strategies for individual qualities in the taste system (e.g., Smith and St John 1999; Spector and Travers 2005), an ecologically valid taste coding theory should consider mechanisms of complex, multiquality taste mixtures as well.
Investigations of neural responses to taste mixtures in rodents have been conducted at both peripheral and central levels. Early neurophysiological studies that systemically examined mixture responses in the hamster chorda tympani (CT) and parabrachial nucleus (PbN), the second central taste relay in rodents, showed that some mixtures composed of heterogeneous (dissimilar) tastes elicited mixture interactions (Hyman and Frank 1980a, 1980b; Travers and Smith 1984). More recent data collected from hamster CT nerve, PbN, and rat nucleus of the solitary tract (NST) confirmed these earlier findings and found that mixture suppression is more apparent than mixture enhancement (Adachi and Aoyama 1991; Chen and Di Lorenzo 2008; Formaker and Frank 1996; Formaker et al. 1997; Frank et al. 2005; Vogt and Smith 1993a, 1993b, 1994). In particular, sweet-bitter taste interactions are almost always suppressive in the CT and PbN (Formaker and Frank 1996; Formaker et al. 1997; Frank et al. 2005; Vogt and Smith 1993a). On the basis of this evidence it was hypothesized that there are mutual inhibitory mechanisms mediating responses to appetitive and aversive taste stimuli (Smith et al. 1994). According to a recent study (Talavera et al. 2008), the locus of sweet-bitter interactions is the Ca2+-sensitive transient receptor potential channel TRPM5, which is expressed in a subset of taste receptor cells and has been shown to be necessary for normal bitter, sweet, and umami transduction (Damak et al. 2006; Zhang et al. 2003). However, CNS involvement in mixture effects cannot be completely ruled out, as there is compelling evidence from human psychophysical studies that the sweet-bitter interaction occurs not only in the periphery but also centrally (Kroeze and Bartoshuk 1985; Lawless 1979).
The neurophysiological studies described above typically used taste mixtures consisting of binary combinations of the classic four basic taste qualities (sweet, salty, sour, and bitter). Only a few previous studies included a mixture of umami and other basic taste compounds (Adachi and Aoyama 1991; Formaker et al. 2004; Sako et al. 2003; Yamamoto et al. 2001). Umami is considered to be the fifth basic taste quality in humans and is elicited by l-glutamate, typically presented as a monosodium salt (MSG) or a potassium salt (MPG). Other umami-tasting stimuli include derivatives of 5′-ribonucleotides such as inosine 5′-monophosphate (IMP) and guanosine 5′-monophosphate. Combining MSG or MPG with these 5′-ribonucleotides (e.g., MPG + IMP) evokes a synergistic response where the intensity of the perceived taste or the magnitude of neural response becomes substantially enhanced, i.e., greater than the sum of the responses to the two stimuli presented alone (see, e.g., Tokita et al. 2012; Yamaguchi 1991). Several candidate G protein-coupled receptors for umami taste have been molecularly identified in taste bud cells. These include the heterodimer T1R1/T1R3 (Li et al. 2002; Nelson et al. 2002), truncated and possibly taste-specific forms of the metabotropic glutamate receptors 1 and 4 (taste-mGluR1 and 4), as well as brain-expressed forms of mGluR1 and mGluR2 (Chaudhari et al. 1996, 2000; Nakashima et al. 2012; San Gabriel et al. 2005, 2009; Toyono et al. 2003).
In the present study, we investigated neural responses to umami-bitter and sweet-bitter mixtures in individual CNS neurons in C57BL/6J inbred mice. Since umami stimuli, especially MSG + IMP or MPG + IMP, are highly appetitive to rodents (see, e.g., Ho et al. 2011; Yamamoto et al. 2001), we reasoned that an aversive bitter stimulus such as quinine might suppress both sweet and umami taste responses. Hence, in this study we investigated whether there are umami-bitter as well as sweet-bitter interactions, and whether these interactions occur in the same population of neurons. Recordings were conducted in the PbN, the second central relay for taste and a key structure in the gustatory pathway from where parallel thalamocortical and ventral forebrain pathways arise. Previous mixture studies in rodents have focused on this central region (e.g., Smith et al. 1994; Travers and Smith 1984; Vogt and Smith 1993a, 1993b, 1994).
MATERIALS AND METHODS
Subjects.
A total of 29 adult male C57BL/6J mice (17–32 g, aged 3–4 mo) were used. The animals were maintained in a temperature- and humidity-controlled colony room on a 12:12-h light-dark cycle (lights on at 0700, off at 1900) and were given ad libitum access to normal dry pellet (22/5 rodent diet, Harlan Teklad, Madison, WI) and water. This study was approved by the Animal Care and Use Committee at the University of Tennessee Health Science Center, and all experiments were carried out in accordance with the National Institutes of Health (NIH) Guide for the Care and Use of Laboratory Animals (NIH Pub. No. 80-23, revised 1996).
Surgery.
Animals were anesthetized with intraperitoneally injected urethane (1 g/kg). Supplemental anesthetic (25% of initial dose) was administered to maintain deep anesthesia throughout the experiment when spontaneous movements were observed and/or when the mouse responded to a brief foot pinch. After tracheotomy was performed to permit respiration, each mouse was fixed in a stereotaxic instrument equipped with nontraumatic ear bars (Stoelting, Wood Dale, IL). Body temperature was maintained at 35°C with a heating pad (Elenco Electronics, Wheeling, IL). The scalp was opened with a midline incision, and the skull was leveled between bregma and lambda by adjusting the bite bar. A hole (∼4.0 mm in diameter, just posterior to the lambda), serving access to the PbN, was drilled through the skull.
Test solutions.
Fifteen taste stimuli used in the present study are summarized in Table 1. The mixtures were made such that the final concentration of each component stimulus was maintained in the mixture. The concentration of quinine hydrochloride (QHCl) used in mixtures was initially formulated on the basis of a similar hamster single-unit study that showed that 0.1 M QHCl effectively suppresses 0.1 and 1.0 M sucrose responses in the PbN (Vogt and Smith 1993a). As we used 0.5 M sucrose, the concentration of QHCl was also reduced to 0.05 M. Preliminary experiments showed that this concentration reliably induces mixture interactions. For comparison, concentrations of QHCl from 0.01 to 0.02 M were used in previous mouse central physiological studies (Lemon and Margolskee 2009; McCaughey 2007; Tokita et al. 2012).
Table 1.
Taste stimuli
| Stimulus |
| 0.5 M sucrose |
| 0.1 M NaCl |
| 0.01 M citric acid |
| 0.01 and 0.05 M QHCl |
| 0.1 M MSG |
| 0.1 M MPG |
| 0.01 M IMP |
| 0.1 M MPG + 0.01 M IMP |
| 0.5 M sucrose + 0.05 M QHCl |
| 0.1 M MPG + 0.05 M QHCl |
| 0.01 M IMP + 0.05 M QHCl |
| 0.1 M MPG + 0.01 M IMP + 0.05 M QHCl |
| 1.0 M glucose |
| 0.2 M Polycose |
| 0.1 M LiCl |
QHCl, quinine HCl; MSG, monosodium glutamate; MPG, monopotassium glutamate; IMP, inosine 5′-monophosphate.
In the present study, a combination of MPG + IMP was used instead of MSG + IMP to more clearly show synergism by precluding the substantial taste effect of the sodium ion (Sako et al. 2003; Tokita et al. 2012; Yamamoto et al. 1991). All stimuli except for Polycose (Ross Laboratories, Columbus, OH) were prepared from reagent-grade chemicals. The concentration of Polycose was 0.2 M, calculated with an average molecular weight of 1,000. These chemicals were dissolved in distilled water <1 h before each recording session to avoid possible chemical interactions (no precipitation was observed during the experiment). Taste solutions were maintained at room temperature during testing.
Electrophysiological recording.
Access to the PbN was accomplished with procedures described previously (Tokita et al. 2012). The taste-responsive zone of the PbN was visually identified by using the inferior colliculus, just posterior to the transverse sinus on the dorsal surface of the exposed tissue, as a landmark. PbN taste-responsive neurons were most often found 0 ± 0.2 mm anterior or posterior to the boundary of the inferior colliculus and cerebellum, 1.3 ± 0.1 mm lateral to the midline, and 2.9 ± 0.2 mm ventral to the surface of the inferior colliculus. An epoxy-insulated tungsten microelectrode (impedance = 1–8 MΩ at 1 kHz; FHC, Bowdoinham, ME) was advanced through the inferior colliculus into the PbN with a micromanipulator (SM-191, Narishige, Tokyo, Japan). Neuronal activity was amplified and monitored with a computer-aided data acquisition and analysis system (CED 1401, Spike2 version 4.01, Cambridge Electronic Design, Cambridge, UK).
A mixture of 0.5 M sucrose, 0.3 M NaCl, 0.02 M citric acid, and 0.02 M QHCl was used as a search stimulus. After a single unit in the PbN was isolated, taste stimuli were presented at room temperature (23–24°C). The tongue was pulled out with a string glued to its ventral surface to make it easier to stimulate posterior taste buds. The oral cavity was stimulated with a method modified from our previous studies with rats (e.g., Shimura et al. 2002; Tokita et al. 2004). Fluid stimuli were delivered through a length of intraorally inserted slender tubing (PE-100), with the end positioned ∼2 mm above the dorsal anterior tongue. During delivery, fluid could be seen engaging both the tongue and palate, and preliminary experiments using methylene blue dye suggested that this method reliably bathes the entire oral cavity. Five milliliters of each taste stimulus was presented at a rate of 0.5 ml/s, delivered manually under mild pressure from a 5-ml syringe. Each stimulus trial consisted of a 10-s rinse of distilled water, a 10-s stimulus, and a 10-s rinse of distilled water. Residual fluid was cleared from the delivery tubing by a brief pulse of air following both the pre- and poststimulus water rinses. Stimulus onset could also be determined by a response artifact that occurred when the stimulus first contacted the tongue (Bradley and Mistretta 1980). When taste-evoked neural activity persisted after the 10-s poststimulus rinse of distilled water, we continued the water rinse until the activity returned to the prestimulus level. At least 90 s was allowed to elapse between stimuli to avoid the effects of adaptation. When possible, taste stimuli were presented more than two times each.
Data analysis.
A neuron was considered to be taste responsive if the neural activity evoked by a taste stimulus increased or decreased ≥2 SD from the mean of its spontaneous activity. This criterion was also applied to activity during prestimulus water rinse to detect water-responsive neurons reported in the rat NST and PbN (Rosen et al. 2010). All data analyses were based on neural activity quantified in 10-s samples with a bin size of 0.5 s. Spontaneous activity and responses to prestimulus water were calculated from multiple samples. The spontaneous rate was determined during the 10-s period just before the prestimulus water rinse. Water and taste neural responses were calculated during the first 10-s period after the onset of stimulation with prestimulus water or a taste solution. The net response rate, obtained by subtracting the immediately preceding raw water responses from the raw taste responses, was used for data analyses. The averages of net responses were used when taste stimulations were repeated. Each neuron was classified into sucrose (S)-best, NaCl (N)-best, citric acid (C)-best, or QHCl (Q)-best categories on the basis of which of the prototypical taste stimuli (0.5 M sucrose, 0.1 N NaCl, 0.01 M citric acid, and 0.01 M QHCl) evoked the greatest net response (Frank 1973).
With the use of adjusted response data, a breadth-of-response measure was derived for each neuron from the formula for entropy (Smith and Travers 1979):
where Pi represents the response to each of the four basic taste stimuli. The constant K = 1.661 for four stimuli. Values of entropy (H) close to zero indicate sensitivity to a single stimulus (narrow tuning); values close to 1.0 indicate sensitivity to all four stimuli (broad tuning). In the present study entropy was obtained by using the excitatory components of responses to four basic taste stimuli.
The synergistic ratio was calculated by the following formula: magnitude of response to mixture/sum of magnitudes of responses to individual components (0.1 M MPG and 0.01 M IMP) in the mixture. If the magnitude of response to mixture was negative, the synergistic ratio was judged as zero. In theory, a ratio > 1.0 would be classified as synergistic. However, it is possible for the ratio to slightly exceed (or fall under) 1.0 in cells with small-magnitude nonsynergistic responses. We therefore used the previously established criterion of 1.2 (Ninomiya and Funakoshi 1989; Tokita et al. 2012). This criterion corresponded to a natural breakpoint in our data, with 7 of 27 nonsynergistic cells showing ratios >1 but <1.14; the first clearly synergistic neuron showed a ratio of 1.44. Synergistic responses were typically (61/70) confirmed with multiple trials with 0.1 M MPG, 0.01 M IMP, and their mixture, but for consistency ratios were only computed from the first presentation of these stimuli.
Taste responses to the binary mixture were judged as greater than (enhancement), equal to, or less than (suppression) the more effective component (MEC) based on the following criteria: at least ±5 spikes/s and/or at least ±50% to identify a mixture response that differed from the MEC (Vogt and Smith 1993a, 1993b). The MPG + IMP + QHCl mixture was considered as a umami-bitter binary, but not ternary, mixture by regarding MPG + IMP as a single umami stimulus. Suppression ratios (1 − mixture response/sucrose or MPG + IMP response) were also calculated in neurons showing suppression.
Repeated-measures analysis of variance (ANOVA) was performed to examine responses to all taste stimuli in synergistic and nonsynergistic neurons (neuron type × stimulus). Post hoc comparisons were performed with a Bonferroni correction. To examine the influence of location of recording site on synergistic and nonsynergistic neurons in the PbN, Fisher's exact probability test was used. On the basis of taste response profiles, multidimensional analysis was executed by using a Euclidean distance model to generate a three-dimensional taste space.
All statistical analyses described above were performed with a general statistics package (Statistica version 6, StatSoft, Tulsa, OK). The statistical rejection criterion for all tests was set at P < 0.05.
Histology.
At the end of the last experimental session, a small electrolytic lesion (20 μA for 20 s, electrode positive) was made at the final recording site in the PbN. After this, mice were intraperitoneally injected with 0.5 ml of 25% urethane and perfused transcardially with phosphate-buffered saline and 10% formalin. The brains were removed and placed in 10% formalin for 1 day and then transferred to a 30% buffered sucrose solution and stored at 4°C for at least 5 days. Coronal sections of 40-μm thickness were serially cut with a freezing microtome and then stained with cresyl violet. The location of each recording site was histologically verified; subnuclear locations were defined on the basis of previously published cytoarchitectural criteria (Fulwiler and Saper 1984; Halsell and Frank 1991; Hashimoto et al. 2009; Tokita et al. 2010). All recording sites were then plotted on a single representative schematic.
RESULTS
Basic characteristics.
A total of 70 taste-responsive neurons were isolated and recorded from the PbN while all taste stimuli were presented. All the neurons showed excitatory activity to at least one of the four basic taste stimuli (sucrose, NaCl, citric acid, or QHCl). The mean spontaneous firing rate (spikes/s) was 1.29 ± 0.2 (range: 0.0–7.38). The mean breadth of tuning value across all neurons was 0.65 ± 0.02 (range: 0.08–0.98). Ten of seventy neurons also showed an excitatory response to water (0.89 ± 0.44) relative to spontaneous rate (0.51 ± 0.31). There was no neuron showing inhibitory responses to water.
Response profiles.
On the basis of their largest net response to the four standard taste stimuli as well as MPG and IMP, we classified the 70 PbN neurons as follows: 36 S-best, 19 N-best, 6 C-best, and 9 Q-best. No neuron responded best to 0.1 M MPG or 0.01 M IMP. Neurons were also classified as synergistic (n = 43) or nonsynergistic (n = 27) according to whether they showed these types of responses to MPG + IMP. Figure 1 displays the total gustatory net response profiles for all neurons. S- and N-best neurons predominated in the data set, at 51% and 27% of all neurons, respectively. Of the 43 neurons showing a synergistic response, 36 were S-best neurons (100% of this type) and the remaining 7 were N-best neurons.
Fig. 1.
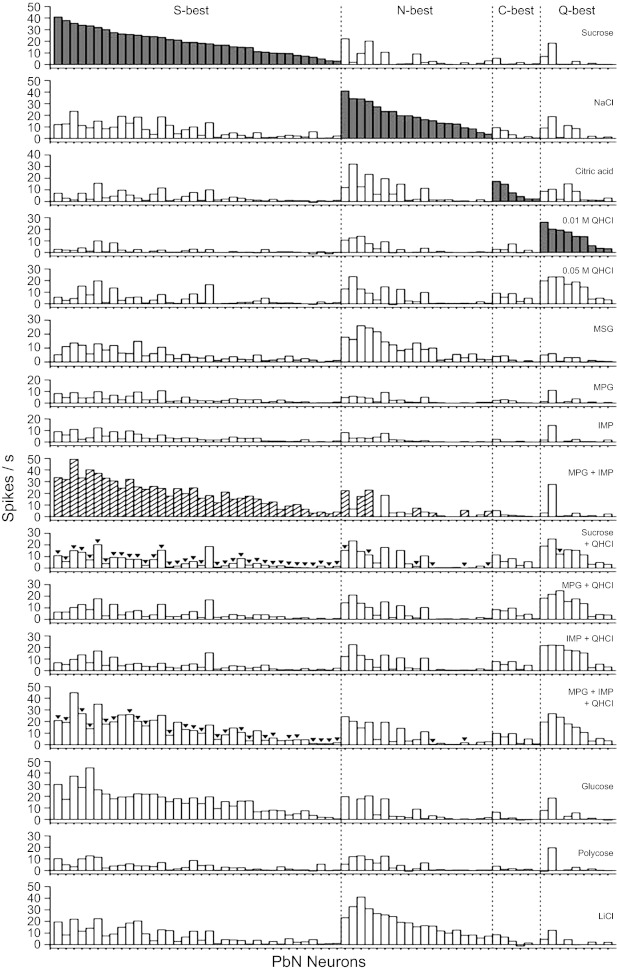
Response profiles of parabrachial nucleus (PbN) taste neurons. Taste neurons were grouped into best-stimulus categories (gray bars) and arranged within those categories in descending order of response magnitude to the best stimulus [n = 70: sucrose (S)-best, 39; NaCl (N)-best, 19; citric acid (C)-best, 9; quinine hydrochloride (QHCl, Q)-best, 9]. Taste responses are presented as net responses (i.e., responses to stimulus − responses to water). Hatched bars indicate synergistic responses to the mixture of monopotassium glutamate (MPG) and inosine 5′-monophosphate (IMP). Inverted triangles are associated with bars when the responses evoked by the mixture were smaller than those evoked by the more effective component (MEC).
Characteristics of synergism.
Mean net taste responses to taste stimuli in synergistic and nonsynergistic neurons are shown in Fig. 2. A two-way ANOVA with repeated measures (neuron type × stimulus) revealed a significant main effect of stimulus [F(15,1,020) = 22.5, P < 0.01] but not neuron type [F(1,68) = 2.4, P = 0.13]. Neuron type × stimulus interaction was also significant [F(15,1,020) = 30.7, P < 0.01]. Taste responses of synergistic neurons to sucrose, MPG + IMP, and glucose were significantly higher than those of nonsynergistic neurons (P < 0.05); 0.01 M QHCl was the only stimulus that elicited significantly more responses in nonsynergistic neurons than in synergistic neurons (P < 0.05). A t-test revealed no significant difference in the mean breadth of tuning values between synergistic (0.65 ± 0.02, range: 0.35–0.93) and nonsynergistic (0.63 ± 0.05, range: 0.08–0.98) neurons.
Fig. 2.
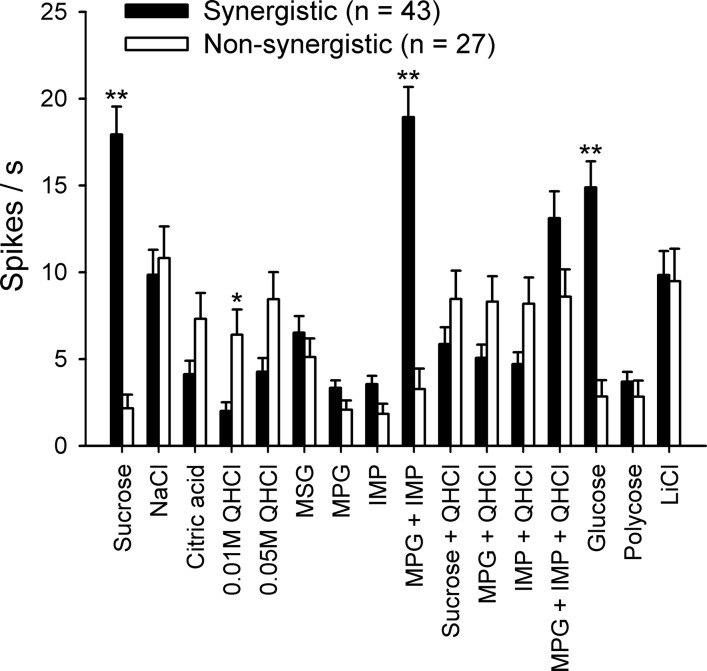
Mean (±SE) net taste responses of synergistic (shaded bars, n = 43) and nonsynergistic (open bars, n = 27) neurons to all taste stimuli used in the present study. *P < 0.05. **P < 0.01.
Taste mixture interactions.
Taste mixture interactions (mixture response different from the response to the MEC alone) were observed in a total of 42 neurons. All interactions observed in the present study involved suppression of the response, but not enhancement (indicated by inverted triangles in Fig. 1). MPG and IMP alone were not involved in such interactions. In 35 synergistic S-best and 6 synergistic N-best neurons QHCl suppressed the sucrose response [mixture response < sucrose response (MEC)]. Of these 41 neurons, 25 synergistic S-best and 2 synergistic N-best neurons also showed suppression of the MPG IMP response by QHCl [mixture response < MPG+IMP response (MEC)], although QHCl did not have any effect on MPG and IMP response alone. There was no single neuron that showed mutual mixture suppression (i.e., a smaller response to the mixture than to either component alone) in response to sucrose + QHCl or MPG + IMP + QHCl mixtures. QHCl suppression by sucrose [mixture response < QHCl response (MEC)] was observed in only one Q-best neuron.
Examples of responses of three major types of taste neurons to basic and mixture taste stimuli are shown in Fig. 3. The neuron in Fig. 3A was categorized as S-best on the basis of a robust response to sucrose relative to other basic stimuli. This neuron also showed umami synergism, as evidenced by the strong response to MPG + IMP. Addition of 0.05 M QHCl to either sucrose or MPG + IMP resulted in almost complete suppression of the response to either of these stimuli—this type of response was classified as mixture suppression type 1 (MS1). In the neuron in Fig. 3B, also categorized as S-best, addition of QHCl resulted in strong suppression of sucrose but not the MPG + IMP mixture (mixture suppression type 2, MS2). The neuron in Fig. 3C was an N-best neuron that robustly responded to NaCl, citric acid, and QHCl but not sucrose or MPG + IMP. In this neuron, addition of QHCl to sucrose or MPG + IMP resulted in a response more or less equivalent to QHCl alone (mixture response = MEC).
Fig. 3.
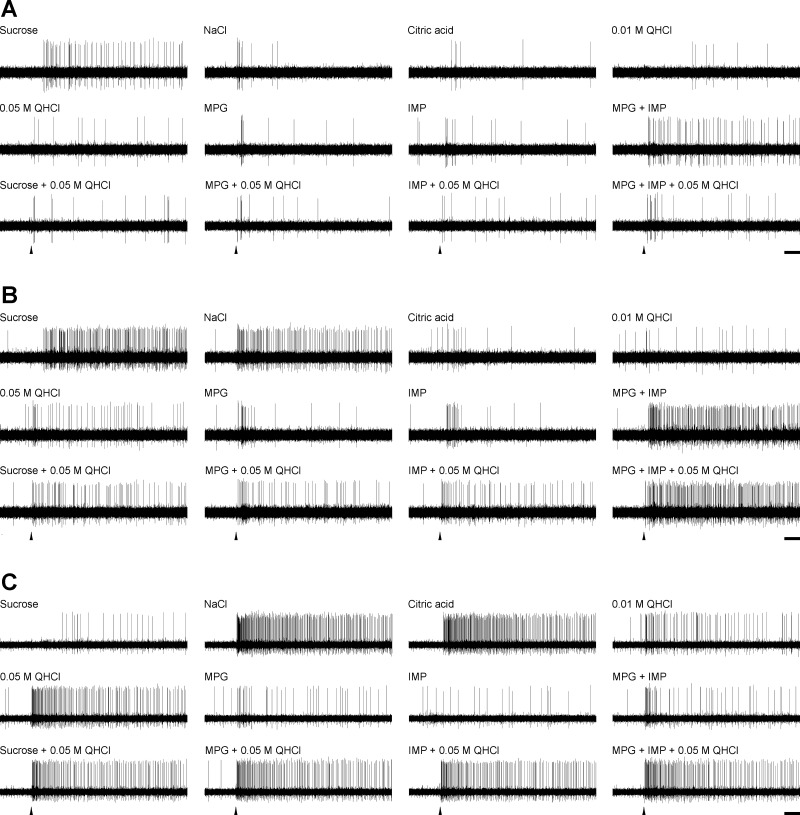
Examples of responses of 3 types of neurons to basic and mixture taste stimuli. A: a synergistic neuron whose responses to both sucrose and MPG+IMP were suppressed by addition of 0.05 M QHCl (mixture suppression type 1, MS1). B: a synergistic neuron whose responses to sucrose but not MPG+IMP were suppressed by QHCl (mixture suppression type 2, MS2). C: a nonsynergistic neuron that showed no QHCl suppression. Arrowheads indicate stimulus onset. Scale bars, 1 s.
The responses of neurons that showed and did not show suppression to taste mixtures and components are displayed in Fig. 4, A and B, respectively. Data in Fig. 4A combine both MS1- and MS2-type neurons. The order of neurons is the same across panels and arranged based on their magnitude of responses to sucrose. The magnitude of responses to a mixture is similar to that to the MEC except for the sucrose + QHCl mixture and the MPG + IMP + QHCl mixture responses in Fig. 4A. Data from the only neuron that showed QHCl suppression by sucrose were not included in this figure.
Fig. 4.
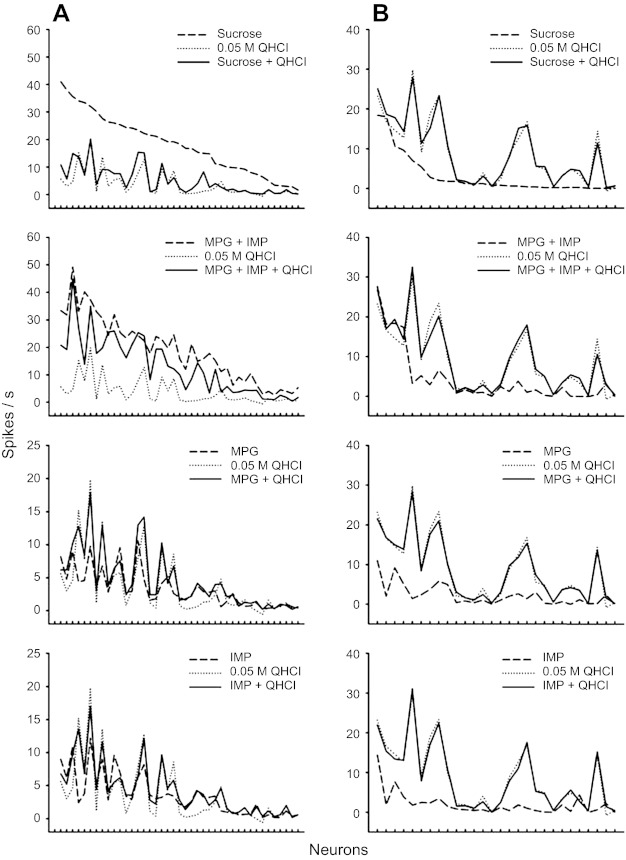
Responses of neurons that showed taste suppression by QHCl (MS1 and MS2 type, n = 41; A) and neurons that did not show QHCl suppression (n = 29; B). The order of neurons is the same across panels and arranged based on their magnitude of responses to sucrose. Data from the only neuron that showed QHCl suppression by sucrose are not included in this figure.
Mean net taste responses to taste stimuli in MS1- and MS2-type neurons are shown in Fig. 5. A two-way ANOVA with repeated measures (neuron type × stimulus) revealed a significant main effect of stimulus [F(15,585) = 54.8, P < 0.01] but not neuron type [F(1,39) = 2.97, P = 0.09]. Neuron type × stimulus interaction was significant [F(15,585) = 1.99, P < 0.05]. Taste responses of MS2-type neurons to NaCl, citric acid, MSG, sucrose + QHCl mixture, and MPG + IMP + QHCl mixture were significantly higher than those of MS1-type neurons (P < 0.05). A t-test revealed a significant difference (P < 0.05) in the mean breadth of tuning values between MS1 (0.61 ± 0.03, range: 0.35–0.87) and MS2 (0.70 ± 0.04, range: 0.49–0.93) neurons, but not in the umami synergistic ratio (3.87 ± 0.31 and 3.01 ± 0.40 for MS1 and MS2, respectively). There was also a significant difference in sucrose suppression ratio by QHCl between MS1 (0.79 ± 0.03, range: 0.45–0.97) and MS2 (0.65 ± 0.06, range: 0.31–0.95) neurons (P < 0.05).
Fig. 5.

Mean (±SE) net taste responses of MS1 (shaded bars, n = 27)- and MS2 (open bars, n = 14)-type neurons to all taste stimuli used in the present study. *P < 0.05.
Figure 6 summarizes the suppressive effect of QHCl on responses to sucrose and MPG + IMP in MS1-type neurons (n = 27). Figure 6A shows net taste responses to sucrose and MPG + IMP in the presence or absence of 0.05 M QHCl. A two-way ANOVA with repeated measures (QHCl × stimulus) revealed a significant main effect of QHCl [F(1,52) = 20.6, P < 0.01] and stimulus [F(1,52) = 29.8, P < 0.01] and a significant QHCl × stimulus interaction [F(1,52) = 23.0, P < 0.01]. A post hoc Bonferroni's test showed that QHCl significantly suppressed both the sucrose and MPG + IMP response (P < 0.01), although there was no significant difference between responses to each component in the absence of QHCl. Figure 6B displays a comparison of the taste response suppression ratio by QHCl. A t-test revealed significant difference (P < 0.01) in suppression ratio between sucrose (0.79 ± 0.03) and MPG + IMP (0.51 ± 0.04). There was a weakly positive correlation (+0.36) between the sucrose and MPG + IMP suppression ratios (Fig. 6C).
Fig. 6.
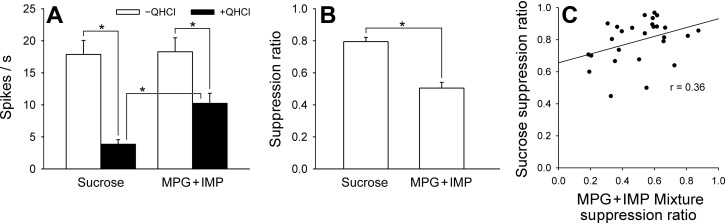
Effect of QHCl on taste responses to sucrose and MPG+IMP in M1-type neurons. A: mean responses to sucrose and MPG+IMP with or without QHCl added. Responses to both stimuli were significantly suppressed by QHCl. QHCl's suppressive effect was greater with sucrose than with MPG+IMP, although there was no significant difference in response magnitude when these stimuli were presented alone. B: comparison of suppression ratio. Sucrose suppression ratio was significantly greater than that of MPG+IMP. C: correlation between sucrose and MPG+IMP suppression ratio. There was a weakly positive correlation (r = 0.36). *P < 0.01.
Across-neuron representation of taste.
A three-dimensional “taste space” showing relative stimulus similarity is presented in Fig. 7. Stimuli representing the four basic taste qualities (sweet, salty, sour, and bitter) occupied distinct positions in the taste space. The two salty-tasting stimuli (NaCl and LiCl) are clustered closely together, as are both sweet-tasting sugars (glucose and sucrose). The two umami stimuli, MPG and IMP, were also clustered together (along with Polycose); interestingly, MSG was located intermediate to the umami and salty groups. As expected, sucrose and MPG + IMP were positioned very close to one another. Mixtures of QHCl with sucrose, MPG, or IMP were clustered with the two concentrations (0.01 and 0.05 M) of QHCl itself. The MPG + IMP + QHCl mixture was positioned between the sweet group and the bitter group.
Fig. 7.
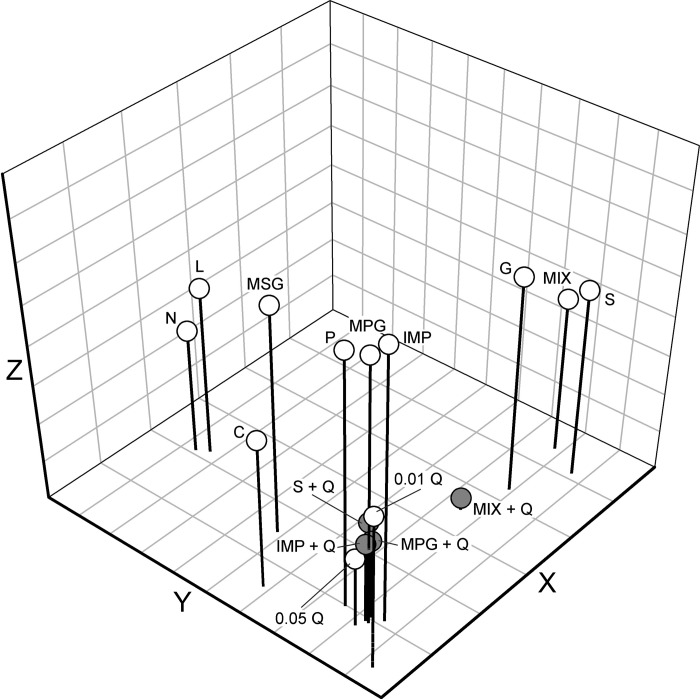
Distribution of 14 taste stimuli in a 3-dimensional taste space resulting from multidimensional scaling. Stress values were 0.16405 for 1 dimension, 0.07809 for 2 dimensions, 0.01161 for 3 dimensions, 0.00122 for 4 dimensions, and 0.00022 for 5 dimensions. S, sucrose; N, NaCl; C, citric acid; Q, QHCl; G, glucose; L, LiCl; P, Polycose; MIX, MPG+IMP. Shaded circles indicate mixtures with QHCl.
Histology.
On the basis of stereotaxic coordinates of recording sites and the marking lesions made in the final recording sites, the locations of all 70 taste-responsive PbN neurons were successfully reconstructed. Figure 8 shows recording site plots in rostrocaudally arranged PbN schema at four different levels (Fig. 8, A–D). Recording sites were located in the medial, central lateral, ventral lateral, and external lateral subnuclei as well as in the brachium conjunctivum (BC). No gustatory neurons were isolated in other areas such as dorsal medial, external medial, dorsal lateral, or internal lateral subnuclei. The distribution of recording sites in terms of neuron type based on both best stimulus and synergism is summarized in Tables 2 and 3. Recording sites were classified into medial (medial subnucleus), BC, and lateral (central lateral, ventral lateral, and external lateral subnuclei) divisions. Fisher's exact probability test revealed that the proportion of S-best neurons in the medial vs. lateral and BC vs. lateral divisions was significantly different, with a greater amount of S-best neurons found medially (P < 0.05) and within the BC (P < 0.01). There was no such difference in neuron type distribution between the medial and BC divisions. A similar effect was found for neurons classified as either synergistic or nonsynergistic, with more neurons showing synergism found medially and in the BC (P < 0.01).
Fig. 8.
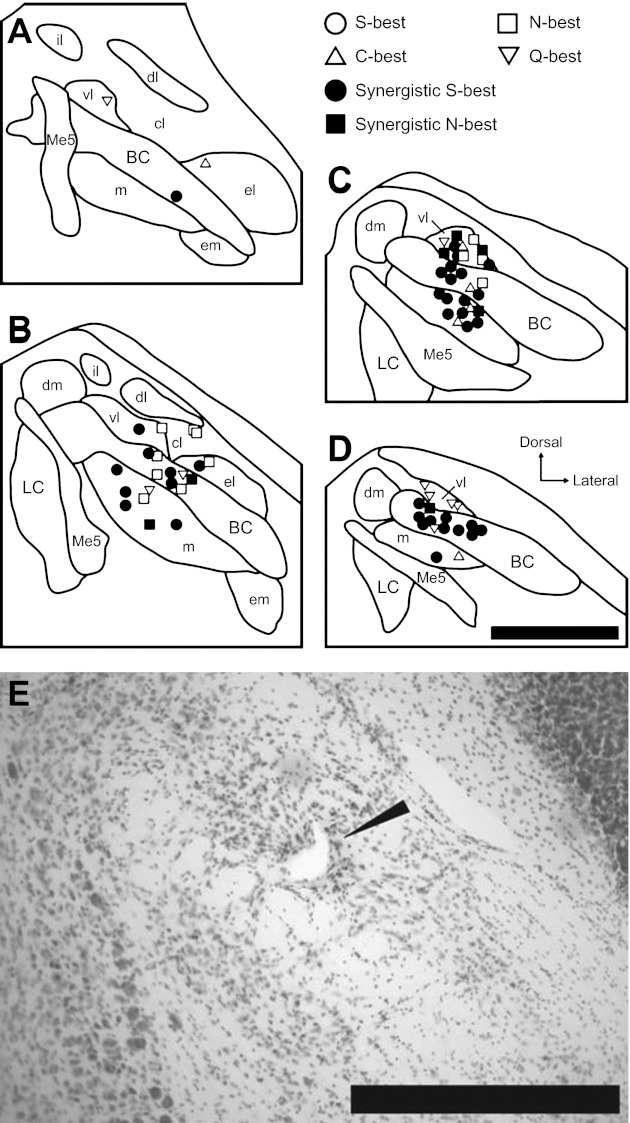
Anatomical reconstruction of 70 recording sites in the right PbN. A–D: coronal sections are arranged rostral to caudal and +50, −100, −250, and −400 μm separated from the caudal end of the cuneiform nucleus, respectively. Filled symbols, synergistic units; open symbols, nonsynergistic units; circles, S-best units; squares, N-best units; triangles, C-best units; inverted triangles, Q-best units. BC, brachium conjunctivum; cl, central lateral subnucleus; dl, dorsal lateral subnucleus; dm, dorsal medial subnucleus; el, external lateral subnucleus; em, external medial subnucleus; il, internal lateral subnucleus; LC, locus coeruleus; m, medial subnucleus; Me5, mesencephalic trigeminal nucleus; vl, ventral lateral subnucleus. E: photomicrograph of a cresyl violet-stained section in the PbN. Marking lesion in the ventral lateral subnucleus is indicated by an arrowhead. Scale bars, 500 μm.
Table 2.
Location of recording site of neurons in terms of best stimulus
| Recording Site |
||||
|---|---|---|---|---|
| Neuron Type | Medial | BC | Lateral | Total |
| S-best | 12 | 19 | 5 | 36 |
| N-best | 3 | 6 | 10 | 19 |
| C-best | 3 | 1 | 2 | 6 |
| Q-best | 1 | 2 | 6 | 9 |
| Total | 19 | 29 | 23 | 70 |
BC, brachium conjunctivum; S, sucrose; N, NaCl; C, citric acid; Q, QHCl.
Table 3.
Location of recording site of neurons in terms of synergism
| Recording Site |
||||
|---|---|---|---|---|
| Neuron Type | Medial | BC | Lateral | Total |
| Synergistic | 14 | 21 | 8 | 43 |
| Nonsynergistic | 5 | 7 | 15 | 27 |
| Total | 19 | 28 | 23 | 70 |
DISCUSSION
Basic Characteristics of Synergism
All of the neurons showing a synergistic taste response in the present study were S-best or N-best and were strongly activated by sucrose (Figs. 1–4). These neurons had significantly stronger responses to sweet stimuli such as sucrose or glucose and weaker responses to QHCl than those that did not show a synergistic response (Fig. 2). These results are in accordance with our previous study (Tokita et al. 2012) as well as rat and mouse CT single-fiber studies showing a strong correlation between sensitivity to sweet-tasting stimuli and umami synergism (Ninomiya and Funakoshi 1989; Sato et al. 1970).
Sweet-bitter and umami-bitter taste interactions in the PbN.
Sweet-bitter and/or umami-bitter mixture taste interactions were observed in 35 S-best and 6 N-best neurons, except for a single Q-best neuron that showed suppression of the QHCl response by the addition of sucrose (but not umami stimuli; Fig. 1). These S- and N-best neurons also each showed a synergistic response to MPG + IMP. The close correspondence between responses to sucrose and MPG + IMP in individual cells was also seen in an earlier PbN study (Tokita et al. 2012) as well as in prior studies on peripheral nerves (Ninomiya and Funakoshi 1989; Sato et al. 1970). Surprisingly, although all of these “synergistic” neurons displayed QHCl-induced sucrose suppression, only a subset also displayed quinine-induced MPG + IMP suppression. We therefore classified neurons showing QHCl suppression into types labeled MS1 and MS2 on the basis of whether or not they showed an umami-bitter taste interaction in addition to a sweet-bitter taste interaction (Fig. 3).
Umami-bitter taste interactions occurred only when QHCl was added to the MPG + IMP mixture and not to individual components MPG or IMP. Furthermore, we did not observe any neurons that showed an umami-bitter taste interaction but not a sweet-bitter taste interaction. MS2-type neurons had a greater magnitude response to NaCl and citric acid than MS1-type neurons, which resulted in significantly different breadth of tuning values between these two types of neurons (Fig. 5). These results suggest that MS1 and MS2 neuron types may have functional significance. There were no neurons showing mixture enhancement, such as previously reported in the rat NST (Chen and Di Lorenzo 2008). Our data also differ from a similar study conducted in the hamster PbN (Vogt and Smith 1993a) in that mixture suppression was almost unidirectional (and not mutual). However, in that study, QHCl's suppressive effect on sucrose responses was much more apparent than sucrose's suppressive effect on QHCl. These results make sense in a certain context: It is vital for the bitter taste to have salience in order for animals to avoid food or fluid containing bitter toxins (Glendinning 1994). However, there may be some species difference in the pattern of taste mixture interactions. The concentration of QHCl must also be considered, as the concentration used in the present study (0.05 M) is stronger than that required to provoke a completely aversive behavioral response in mice (Boughter et al. 2005) and may additionally have non-taste receptor-specific effects. The concentration used in this study fell within the range of those used in the Vogt and Smith (1993a) study (0.0032–0.1 M).
Possible peripheral and central mechanisms.
A critical question about taste mixture effects concerns where in the taste system mixture interactions occur. Previous electrophysiological studies on rat and hamster CT responses have shown that QHCl suppression takes place at least as early as the afferent nerves (Formaker and Frank 1996; Formaker et al. 1997; Frank et al. 2005). A recent study has demonstrated that TRPM5, a cation channel involved in bitter, sweet, and umami taste transduction, is the peripheral locus of sweet-bitter interactions by showing the absence of such mixture effects in CT responses of TRPM5−/− but not wild-type mice (Talavera et al. 2008). The authors suggest that QHCl suppresses sweet responses by inhibiting TRPM5 currents that are necessary for the depolarization of taste receptor cells. In support of this idea, a strong positive correlation was found between the suppression ratio of CT responses to different taste stimuli and the extent to which those responses depend on TRPM5 in wild-type mice. Their data also indicated a stronger dependence of sweet than umami stimuli (0.1 M MSG) on TRPM5, although MSG + IMP was not tested. Still, these results are consistent with our present data showing that the suppressive effect of QHCl was stronger on sweet than on umami synergistic responses (Fig. 6), and they indicate that at least part of this differential suppression has a peripheral basis. Interestingly, lingual treatment with the sweet-taste-suppressing polypeptide gurmarin has similar effect on the mouse CT responses to sucrose and MSG + IMP (Ninomiya et al. 2000).
Our data are also consistent with the notion that there are TRPM5-dependent and -independent pathways for detection of umami stimuli in CT and glossopharyngeal (GL) nerves (Damak et al. 2006). Such pathways seem to be partially (MS1-type neurons) or completely (MS2-type neurons) segregated at the level of the PbN (Fig. 3). However, our present results showing that QHCl had no suppressive effect on MPG or IMP alone do not completely fit the TRPM5-dependent hypothesis of QHCl suppression, because TRPM5-knockout mice show decreased or abolished CT responses to each of these as well as to their mixture (Damak et al. 2006; Zhang et al. 2003). It is possible that QHCl suppression of MPG or IMP responses is concentration dependent, i.e., suppression might be observable with higher concentrations of either stimulus type. However, it should be noted that Talavera et al. (2008) also did not detect a statistically significant suppressive effect of QHCl on the MSG response in wild-type as well as TRPM5−/− mice. Therefore it may still be possible that TRPM5-dependent suppressive mechanisms become active or much stronger only when QHCl is added to the MPG + IMP mixture but not MPG or IMP alone.
Centrally, there is ample evidence that convergence of peripheral input shapes the response to umami stimuli. A recent study in mice demonstrates the existence of a distinct MPG-best CT single fiber type (Yasumatsu et al. 2012). In this study, both these and S-best fiber types were each further divided into two subtypes based on whether or not they showed a synergistic response, i.e., MPG-best or S-best fibers that show umami synergism (M1 or S1 type) and MPG-best or S-best fibers that do not show umami synergism (M2 or S2 type). These subtypes are not found at the level of the PbN (except for S1). In fact, we did not find any taste neurons responding best to 0.1 M MPG or 0.1 M MSG relative to other basic tastants. This lack of umami specificity is consistent with our previous study (Tokita et al. 2012) and likely due to convergence of input centrally. Evidence for this convergence of information is found in the mean breadth of tuning values (0.65 ± 0.02) in the present study, which fall within the range of those obtained in previous studies in the PbN of rat and hamster (Cho and Li 2008; Geran and Travers 2009; Nishijo and Norgren 1997; Tokita et al. 2004; Van Buskirk and Smith 1981; for review, see Spector and Travers 2005). This value is much higher than those in the single CT fibers of mice, which range from 0.22 to 0.41 (Ninomiya et al. 1982, 1984). We hypothesize that information from M1-type CT fibers converges onto S- or N-best PbN neurons, which show umami synergism. Interestingly, S1-type fibers but not the other three types disappear in T1R3- and TRMP5-knockout mice (Yasumatsu et al. 2012), indicative of non-T1R-dependent mechanisms for umami taste.
A central basis for QHCl suppression seen in this study is also quite possible. Several lines of evidence from human psychophysics support mixture interaction at the central level (Gillan 1982; Kroeze and Bartoshuk 1985; Lawless 1979). Specifically, Kroeze and Bartoshuk (1985) demonstrated sucrose + QHCl and NaCl + QHCl mixture suppression via use of a split-tongue technique, which presumably excludes the possibility of a peripheral basis, owing to the fact that peripheral taste nerves rarely have branches crossing the midline on the tongue. Rodent physiological studies also indicate possible central mechanisms. For example, gustatory neurons in the rat NST showed larger responses to taste stimuli presented on the posterior tongue when the CT nerve was anesthetized (Halpern and Nelson 1965). Chronic transection of the CT nerve results in decreased responses to NaCl and increased spontaneous rate of nasoincisor duct-responsive neurons in the rat NST (Dinkins and Travers 1999). Hamster NST neurons that have convergent inputs from both anterior tongue and posterior oral cavity often show smaller responses to taste stimuli presented to the entire oral cavity than to stimuli solely presented to the more effective receptive field (Sweazey and Smith 1987). Some rat PbN neurons are also activated by both anterior and posterior oral taste stimulation, and anterior tongue stimulation was shown to reduce the resting rate of neurons responsive to posterior stimulation (Norgren and Pfaffmann 1975). These studies all indicate that taste inputs from different receptive fields are modulated via inhibitory interactions at the brain stem level. The neurotransmitter γ-aminobutyric acid (GABA) inhibits activity of neurons in the gustatory zones of both the NST and the PbN (Kobashi and Bradley 1998; Liu et al. 1993; Smith et al. 1994; Wang and Bradley 1993), and all PbN subnuclei possess GABAA receptors, glutamic acid decarboxylase, and GABA transporters (Guthmann et al. 1998). Additionally, anatomical and physiological evidence indicates that centrifugal inputs alter taste activity in the PbN (e.g., Di Lorenzo 1988; Tokita et al. 2004, 2009).
Perceptual consequences of taste mixture stimulation.
Consistent with our previous study (Tokita et al. 2012), multidimensional analysis resulted in close grouping of sweet stimuli (sucrose and glucose) with MPG + IMP among all stimuli (Fig. 7). These results are in accordance with behavioral studies showing perceptual similarity between sweet stimuli and MSG + IMP in rats and mice (Nakashima et al. 2001; Yamamoto et al. 1991). Our data also showed that the MPG + IMP + QHCl mixture was positioned between sweet stimuli and bitter stimuli. Sucrose + QHCl, MPG + QHCl, and IMP + QHCl were very closely grouped together with 0.01 M and 0.05 M QHCl. These results suggest that QHCl reduces perceived sweetness and/or “umaminess” by suppressing or overcoming taste responses to these stimuli. However, previous behavioral studies (Frank et al. 2003; Smith and Theodore 1984) showed that each component in a sucrose + QHCl mixture can be separately perceived in hamsters, a species that displays suppressed CT and PbN responses to sucrose by bitter stimuli (Formaker and Frank 1996; Formaker et al. 1997; Frank et al. 2005; Vogt and Smith 1993a). Behavioral studies in mice examining responses to taste mixtures are needed to relate the present physiological data to perceptual identification and intensity of components in mixtures.
Chemotopy in the PbN.
Recording sites in the PbN were distributed in the medial and lateral part of the PbN and also within the BC (Fig. 8 and Tables 2 and 3). In terms of subnuclei (Hashimoto et al. 2009; Tokita et al. 2010), recordings were made in the medial, central lateral, ventral lateral, and external lateral subnuclei but not in the dorsal medial, external medial, internal lateral, and dorsal lateral subnuclei. On the basis of the distribution pattern of recording sites of specific neuron types, some previous studies using rat and hamster suggest the existence of chemotopy in the PbN (Ogawa et al. 1984, 1987; Shimura et al. 1997; Tokita et al. 2004; Van Buskirk and Smith 1981; but see Geran and Travers 2009). In our previous study we suggested that neurons in the medial and lateral PbN in the mouse tend to be responsive to preferred and aversive taste stimuli, respectively (Tokita et al. 2012). In the present study it is also evident that S-best or synergistic neurons are preferentially located medially and Q-best or nonsynergistic neurons are preferentially located laterally. One new finding in the present study is that neurons within the BC as well as the medial area also tend to be responsive to preferred stimuli. Most of the recording sites of such neurons were reconstructed within the so-called “waist area” of the BC (Fulwiler and Saper 1984), where many taste-responsive neurons are reported to exist in the rat and hamster (Halsell and Frank 1991; Halsell and Travers 1997; Norgren and Pfaffmann 1975). Although the notion of “gustatopic maps” is still somewhat controversial, it is reasonable to conclude that taste is organized in spatially distinctive areas in the PbN considering the fact that chemotopic organization also exists in other taste-related brain regions of rodents (Chen et al. 2011; Harrer and Travers 1996; Travers et al. 2007; Yamamoto et al. 1985) and that PbN subregions have differential projection patterns to higher taste-related areas (Tokita et al. 2010).
GRANTS
This research was supported by the Ajinomoto Amino Acid Research Program and National Institute on Deafness and Other Communication Disorders Grant DC-000353 to J. D. Boughter, Jr.
DISCLOSURES
No conflicts of interest, financial or otherwise, are declared by the author(s).
AUTHOR CONTRIBUTIONS
Author contributions: K.T. and J.D.B. conception and design of research; K.T. performed experiments; K.T. and J.D.B. analyzed data; K.T. and J.D.B. interpreted results of experiments; K.T. and J.D.B. prepared figures; K.T. and J.D.B. drafted manuscript; K.T. and J.D.B. edited and revised manuscript; K.T. and J.D.B. approved final version of manuscript.
ACKNOWLEDGMENTS
The authors thank Dr. Matthew Ennis for technical support and Drs. Takashi Yamamoto, Noritaka Sako, Keiko Yasumatsu, and Steven St John for valuable comments.
REFERENCES
- Adachi A, Aoyama M. Neuronal responses of the nucleus tractus solitarius to oral stimulation with umami substances. Physiol Behav 49: 935–941, 1991 [DOI] [PubMed] [Google Scholar]
- Boughter JD, Jr, Raghow S, Nelson TM, Munger SD. Inbred mouse strains C57BL/6J and DBA/2J vary in sensitivity to a subset of bitter stimuli. BMC Genet 6: 36, 2005 [DOI] [PMC free article] [PubMed] [Google Scholar]
- Boughter JD, Jr, Smith DV. Amiloride blocks acid responses in NaCl-best gustatory neurons of the hamster solitary nucleus. J Neurophysiol 80: 1362–1372, 1998 [DOI] [PubMed] [Google Scholar]
- Bradley RM, Mistretta CM. Developmental changes in neurophysiological taste responses from the medulla in sheep. Brain Res 191: 21–34, 1980 [DOI] [PubMed] [Google Scholar]
- Chaudhari N, Landin AM, Roper SD. A metabotropic glutamate receptor variant functions as a taste receptor. Nat Neurosci 3: 113–119, 2000 [DOI] [PubMed] [Google Scholar]
- Chaudhari N, Yang H, Lamp C, Delay E, Cartford C, Than T, Roper S. The taste of monosodium glutamate: membrane receptors in taste buds. J Neurosci 16: 3817–3826, 1996 [DOI] [PMC free article] [PubMed] [Google Scholar]
- Chen JY, Di Lorenzo PM. Responses to binary taste mixtures in the nucleus of the solitary tract: neural coding with firing rate. J Neurophysiol 99: 2144–2157, 2008 [DOI] [PubMed] [Google Scholar]
- Chen X, Gabitto M, Peng Y, Ryba NJ, Zuker CS. A gustotopic map of taste qualities in the mammalian brain. Science 333: 1262–1266, 2011 [DOI] [PMC free article] [PubMed] [Google Scholar]
- Cho YK, Li CS. Gustatory neural circuitry in the hamster brain stem. J Neurophysiol 100: 1007–1019, 2008 [DOI] [PMC free article] [PubMed] [Google Scholar]
- Damak S, Rong M, Yasumatsu K, Kokrashvili Z, Pérez CA, Shigemura N, Yoshida R, Mosinger B, Jr, Glendinning JI, Ninomiya Y, Margolskee RF. Trpm5 null mice respond to bitter, sweet, and umami compounds. Chem Senses 31: 253–264, 2006 [DOI] [PubMed] [Google Scholar]
- Di Lorenzo PM. Taste responses in the parabrachial pons of decerebrate rats. J Neurophysiol 59: 1871–1887, 1988 [DOI] [PubMed] [Google Scholar]
- Dinkins ME, Travers SP. Altered taste responses in adult NST after neonatal chorda tympani denervation. J Neurophysiol 82: 2565–2578, 1999 [DOI] [PubMed] [Google Scholar]
- Formaker BK, Frank ME. Responses of the hamster chorda tympani nerve to binary component taste stimuli: evidence for peripheral gustatory mixture interactions. Brain Res 727: 79–90, 1996 [DOI] [PubMed] [Google Scholar]
- Formaker BK, MacKinnon BI, Hettinger TP, Frank ME. Opponent effects of quinine and sucrose on single fiber taste responses of the chorda tympani nerve. Brain Res 772: 239–242, 1997 [DOI] [PubMed] [Google Scholar]
- Formaker BK, Stapleton JR, Roper SD, Frank ME. Responses of the rat chorda tympani nerve to glutamate-sucrose mixtures. Chem Senses 29: 473–482, 2004 [DOI] [PubMed] [Google Scholar]
- Frank ME. An analysis of hamster afferent taste nerve response functions. J Gen Physiol 61: 588–618, 1973 [DOI] [PMC free article] [PubMed] [Google Scholar]
- Frank ME, Formaker BK, Hettinger TP. Taste responses to mixtures: analytic processing of quality. Behav Neurosci 117: 228–235, 2003 [DOI] [PubMed] [Google Scholar]
- Frank ME, Formaker BK, Hettinger TP. Peripheral gustatory processing of sweet stimuli by golden hamsters. Brain Res Bull 66: 70–84, 2005 [DOI] [PubMed] [Google Scholar]
- Fulwiler CE, Saper CB. Subnuclear organization of the efferent connections of the parabrachial nucleus in the rat. Brain Res 319: 229–59, 1984 [DOI] [PubMed] [Google Scholar]
- Geran LC, Travers SP. Bitter-responsive gustatory neurons in the rat parabrachial nucleus. J Neurophysiol 101: 1598–1612, 2009 [DOI] [PMC free article] [PubMed] [Google Scholar]
- Gillan DJ. Mixture suppression: the effect of spatial separation between sucrose and NaCl. Percept Psychophys 32: 504–510, 1982 [DOI] [PubMed] [Google Scholar]
- Glendinning JI. Is the bitter rejection response always adaptive? Physiol Behav 56: 1217–1227, 1994 [DOI] [PubMed] [Google Scholar]
- Guthmann A, Fritschy JM, Ottersen OP, Torp R, Herbert H. GABA, GABA transporters, GABAA receptor subunits, and GAD mRNAs in the rat parabrachial and Kölliker-Fuse nuclei. J Comp Neurol 400: 229–243, 1998 [PubMed] [Google Scholar]
- Halpern BP, Nelson LM. Bulbar gustatory responses to anterior and to posterior tongue stimulation in the rat. Am J Physiol 209: 105–110, 1965 [DOI] [PubMed] [Google Scholar]
- Halsell CB, Frank ME. Mapping study of the parabrachial taste-responsive area for the anterior tongue in the golden hamster. J Comp Neurol 306: 708–722, 1991 [DOI] [PubMed] [Google Scholar]
- Halsell CB, Travers SP. Anterior and posterior oral cavity responsive neurons are differentially distributed among parabrachial subnuclei in rat. J Neurophysiol 78: 920–938, 1997 [DOI] [PubMed] [Google Scholar]
- Harrer MI, Travers SP. Topographic organization of Fos-like immunoreactivity in the rostral nucleus of the solitary tract evoked by gustatory stimulation with sucrose and quinine. Brain Res 711: 125–137, 1996 [DOI] [PubMed] [Google Scholar]
- Hashimoto K, Obata K, Ogawa H. Characterization of parabrachial subnuclei in mice with regard to salt tastants: possible independence of taste relay from visceral processing. Chem Senses 34: 253–267, 2009 [DOI] [PubMed] [Google Scholar]
- Ho AS, Hori E, Nguyen PH, Urakawa S, Kondoh T, Torii K, Ono T, Nishijo H. Hippocampal neuronal responses during signaled licking of gustatory stimuli in different contexts. Hippocampus 21: 502–519, 2011 [DOI] [PubMed] [Google Scholar]
- Hyman AM, Frank ME. Effects of binary taste stimuli on the neural activity of the hamster chorda tympani. J Gen Physiol 76: 125–142, 1980a [DOI] [PMC free article] [PubMed] [Google Scholar]
- Hyman AM, Frank ME. Sensitivities of single nerve fibers in the hamster chorda tympani to mixtures of taste stimuli. J Gen Physiol 76: 143–173, 1980b [DOI] [PMC free article] [PubMed] [Google Scholar]
- Keast RS, Breslin PA. An overview of binary taste-taste interactions. Food Qual Pref 14: 111–124, 2003 [Google Scholar]
- Kobashi M, Bradley RM. Effects of GABA on neurons of the gustatory and visceral zones of the parabrachial nucleus in rats. Brain Res 799: 323–328, 1998 [DOI] [PubMed] [Google Scholar]
- Kroeze JH. Is taste mixture suppression a peripheral or central event? In: Perception of Complex Smells and Tastes, edited by Laing DG, Cain WS, McBride RL, Ache BW. Sydney, Australia: Academic, 1989 [Google Scholar]
- Kroeze JH, Bartoshuk LM. Bitterness suppression as revealed by split-tongue taste stimulation in humans. Physiol Behav 35: 779–783, 1985 [DOI] [PubMed] [Google Scholar]
- Lawless HT. Evidence for neural inhibition in bittersweet taste mixtures. J Comp Physiol Psychol 93: 538–547, 1979 [DOI] [PubMed] [Google Scholar]
- Lemon CH, Margolskee RF. Contribution of the T1r3 taste receptor to the response properties of central gustatory neurons. J Neurophysiol 101: 2459–2471, 2009 [DOI] [PMC free article] [PubMed] [Google Scholar]
- Li X, Staszewski L, Xu H, Durick K, Zoller M, Adler E. Human receptors for sweet and umami taste. Proc Natl Acad Sci USA 99: 4692–4696, 2002 [DOI] [PMC free article] [PubMed] [Google Scholar]
- Liu H, Behbehani MM, Smith DV. The influence of GABA on cells in the gustatory region of the hamster solitary nucleus. Chem Senses 18: 285–305, 1993 [Google Scholar]
- McBride RL. Three models for taste mixtures. In: Perception of Complex Smells and Tastes, edited by Laing DG, Cain WS, McBride RL, Ache BW. Sydney, Australia: Academic, 1989 [Google Scholar]
- McCaughey SA. Taste-evoked responses to sweeteners in the nucleus of the solitary tract differ between C57BL/6ByJ and 129P3/J mice. J Neurosci 27: 35–45, 2007 [DOI] [PMC free article] [PubMed] [Google Scholar]
- Nakashima K, Eddy MC, Katsukawa H, Delay ER, Ninomiya Y. Behavioral responses to glutamate receptor agonists and antagonists implicate the involvement of brain-expressed mGluR4 and mGluR1 in taste transduction for umami in mice. Physiol Behav 105: 709–719, 2012 [DOI] [PubMed] [Google Scholar]
- Nakashima K, Katsukawa H, Sasamoto K, Ninomiya Y. Behavioral taste similarities and differences among monosodium l-glutamate and glutamate receptor agonists in C57BL mice. J Nutr Sci Vitaminol (Tokyo) 47: 161–166, 2001 [DOI] [PubMed] [Google Scholar]
- Nelson G, Chandrashekar J, Hoon MA, Feng L, Zhao G, Ryba NJ, Zuker CS. An amino-acid taste receptor. Nature 416: 199–202, 2002 [DOI] [PubMed] [Google Scholar]
- Ninomiya Y, Funakoshi M. Peripheral neural basis for behavioral discrimination between glutamate and the four basic taste substances in mice. Comp Biochem Physiol A Comp Physiol 92A: 371–376, 1989 [DOI] [PubMed] [Google Scholar]
- Ninomiya Y, Mizukoshi T, Higashi T, Katsukawa H, Funakoshi M. Gustatory neural responses in three different strains of mice. Brain Res 302: 305–314, 1984 [DOI] [PubMed] [Google Scholar]
- Ninomiya Y, Nakashima K, Fukuda A, Nishino H, Sugimura T, Hino A, Danilova V, Hellekant G. Responses to umami substances in taste bud cells innervated by the chorda tympani and glossopharyngeal nerves. J Nutr 130: 950S–953S, 2000 [DOI] [PubMed] [Google Scholar]
- Ninomiya Y, Tonosaki K, Funakoshi M. Gustatory neural response in the mouse. Brain Res 244: 370–373, 1982 [DOI] [PubMed] [Google Scholar]
- Nishijo H, Norgren R. Parabrachial neural coding of taste stimuli in awake rats. J Neurophysiol 78: 2254–2268, 1997 [DOI] [PubMed] [Google Scholar]
- Norgren R, Pfaffmann C. The pontine taste area in the rat. Brain Res 91: 99–117, 1975 [DOI] [PubMed] [Google Scholar]
- Ogawa H, Hayama T, Ito S. Location and taste responses of parabrachio-thalamic relay neurons in rats. Exp Neurol 83: 507–517, 1984 [DOI] [PubMed] [Google Scholar]
- Ogawa H, Hayama T, Ito S. Response properties of the parabrachio-thalamic taste and mechanoreceptive neurons in rats. Exp Brain Res 68: 449–457, 1987 [DOI] [PubMed] [Google Scholar]
- Rosen AM, Roussin AT, Di Lorenzo PM. Water as an independent taste modality. Front Neurosci 4: 175, 2010 [DOI] [PMC free article] [PubMed] [Google Scholar]
- Sako N, Tokita K, Sugimura T, Yamamoto T. Synergistic responses of the chorda tympani to mixtures of umami and sweet substances in rats. Chem Senses 28: 261–266, 2003 [DOI] [PubMed] [Google Scholar]
- San Gabriel A, Maekawa T, Uneyama H, Torii K. Metabotropic glutamate receptor type 1 in taste tissue. Am J Clin Nutr 90: 743S–746S, 2009 [DOI] [PubMed] [Google Scholar]
- San Gabriel A, Uneyama H, Yoshie S, Torii K. Cloning and characterization of a novel mGluR1 variant from vallate papillae that functions as a receptor for l-glutamate stimuli. Chem Senses 30, Suppl 1: i25–i26, 2005 [DOI] [PubMed] [Google Scholar]
- Sato M, Yamashita S, Ogawa H. Potentiation of gustatory response to monosodium glutamate in rat chorda tympani fibers by addition of 5′-ribonucleotides. Jpn J Physiol 20: 444–464, 1970 [DOI] [PubMed] [Google Scholar]
- Shimura T, Tanaka H, Yamamoto T. Salient responsiveness of parabrachial neurons to the conditioned stimulus after the acquisition of taste aversion learning in rats. Neuroscience 81: 239–247, 1997 [DOI] [PubMed] [Google Scholar]
- Shimura T, Tokita K, Yamamoto T. Parabrachial unit activities after the acquisition of conditioned taste aversion to a non-preferred HCl solution in rats. Chem Senses 27: 153–158, 2002 [DOI] [PubMed] [Google Scholar]
- Smith DV, Liu H, Vogt MB. Neural coding of aversive and appetitive gustatory stimuli: interactions in the hamster brain stem. Physiol Behav 56: 1189–1196, 1994 [DOI] [PubMed] [Google Scholar]
- Smith DV, St John SJ. Neural coding of gustatory information. Curr Opin Neurobiol 9: 427–435, 1999 [DOI] [PubMed] [Google Scholar]
- Smith DV, Theodore RM. Conditioned taste aversions: generalization to taste mixtures. Physiol Behav 32: 983–989, 1984 [DOI] [PubMed] [Google Scholar]
- Smith DV, Travers JB. A metric for the breadth of tuning of gustatory neurons. Chem Senses Flav 4: 215–229, 1979 [Google Scholar]
- Spector AC, Travers SP. The representation of taste quality in the mammalian nervous system. Behav Cogn Neurosci Rev 4: 143–191, 2005 [DOI] [PubMed] [Google Scholar]
- Sweazey RD, Smith DV. Convergence onto hamster medullary taste neurons. Brain Res 408: 173–184, 1987 [DOI] [PubMed] [Google Scholar]
- Talavera K, Yasumatsu K, Yoshida R, Margolskee RF, Voets T, Ninomiya Y, Nilius B. The taste transduction channel TRPM5 is a locus for bitter-sweet taste interactions. FASEB J 22: 1343–1355, 2008 [DOI] [PubMed] [Google Scholar]
- Tokita K, Inoue T, Boughter JD., Jr Afferent connections of the parabrachial nucleus in C57BL/6J mice. Neuroscience 161: 475–488, 2009 [DOI] [PMC free article] [PubMed] [Google Scholar]
- Tokita K, Inoue T, Boughter JD., Jr Subnuclear organization of parabrachial efferents to the thalamus, amygdala and lateral hypothalamus in C57BL/6J mice: a quantitative retrograde double labeling study. Neuroscience 171: 351–365, 2010 [DOI] [PMC free article] [PubMed] [Google Scholar]
- Tokita K, Karádi Z, Shimura T, Yamamoto T. Centrifugal inputs modulate taste aversion learning associated parabrachial neuronal activities. J Neurophysiol 92: 265–279, 2004 [DOI] [PubMed] [Google Scholar]
- Tokita K, Yamamoto T, Boughter JD., Jr Gustatory neural responses to umami stimuli in the parabrachial nucleus of C57BL/6J mice. J Neurophysiol 107: 1545–1555, 2012 [DOI] [PMC free article] [PubMed] [Google Scholar]
- Toyono T, Seta Y, Kataoka S, Kawano S, Shigemoto R, Toyoshima K. Expression of metabotropic glutamate receptor group I in rat gustatory papillae. Cell Tissue Res 313: 29–35, 2003 [DOI] [PubMed] [Google Scholar]
- Travers JB, Herman K, Yoo J, Travers SP. Taste reactivity and Fos expression in GAD1-EGFP transgenic mice. Chem Senses 32: 129–137, 2007 [DOI] [PubMed] [Google Scholar]
- Travers SP, Smith DV. Responsiveness of neurons in the hamster parabrachial nuclei to taste mixtures. J Gen Physiol 84: 221–250, 1984 [DOI] [PMC free article] [PubMed] [Google Scholar]
- Van Buskirk RL, Smith DV. Taste sensitivity of hamster parabrachial pontine neurons. J Neurophysiol 45: 144–171, 1981 [DOI] [PubMed] [Google Scholar]
- Vogt MB, Smith DV. Responses of single hamster parabrachial neurons to binary taste mixtures: mutual suppression between sucrose and QHCl. J Neurophysiol 69: 658–668, 1993a [DOI] [PubMed] [Google Scholar]
- Vogt MB, Smith DV. Responses of single hamster parabrachial neurons to binary taste mixtures of citric acid with sucrose or NaCl. J Neurophysiol 70: 1350–1364, 1993b [DOI] [PubMed] [Google Scholar]
- Vogt MB, Smith DV. Responses of single hamster parabrachial neurons to binary taste mixtures of NaCl with sucrose or QHCl. J Neurophysiol 71: 1373–1380, 1994 [DOI] [PubMed] [Google Scholar]
- Wang L, Bradley RM. Influence of GABA on neurons of the gustatory zone of the rat nucleus of the solitary tract. Brain Res 616: 144–153, 1993 [DOI] [PubMed] [Google Scholar]
- Yamaguchi S. Basic properties of umami and effects on humans. Physiol Behav 49: 833–841, 1991 [DOI] [PubMed] [Google Scholar]
- Yamamoto T, Matsuo R, Fujimoto Y, Fukunaga I, Miyasaka A, Imoto T. Electrophysiological and behavioral studies on the taste of umami substances in the rat. Physiol Behav 49: 919–925, 1991 [DOI] [PubMed] [Google Scholar]
- Yamamoto T, Sako N, Tokita K. Characteristics of umami responses in rats. Sensory Neuron 3: 185–204, 2001 [Google Scholar]
- Yamamoto T, Yuyama N, Kato T, Kawamura Y. Gustatory responses of cortical neurons in rats. II. Information processing of taste quality. J Neurophysiol 53: 1356–1369, 1985 [DOI] [PubMed] [Google Scholar]
- Yasumatsu K, Ogiwara Y, Takai S, Yoshida R, Iwatsuki K, Torii K, Margolskee RF, Ninomiya Y. Umami taste in mice uses multiple receptors and transduction pathways. J Physiol 590: 1155–1170, 2012 [DOI] [PMC free article] [PubMed] [Google Scholar]
- Zhang Y, Hoon MA, Chandrashekar J, Mueller KL, Cook B, Wu D, Zuker CS, Ryba NJ. Coding of sweet, bitter, and umami tastes: different receptor cells sharing similar signaling pathways. Cell 112: 293–301, 2003 [DOI] [PubMed] [Google Scholar]