

Abstract
Our percept of visual stability across saccadic eye movements may be mediated by presaccadic remapping. Just before a saccade, neurons that remap become visually responsive at a future field (FF), which anticipates the saccade vector. Hence, the neurons use corollary discharge of saccades. Many of the neurons also decrease their response at the receptive field (RF). Presaccadic remapping occurs in several brain areas including the frontal eye field (FEF), which receives corollary discharge of saccades in its layer IV from a collicular-thalamic pathway. We studied, at two levels, the microcircuitry of remapping in the FEF. At the laminar level, we compared remapping between layers IV and V. At the cellular level, we compared remapping between different neuron types of layer IV. In the FEF in four monkeys (Macaca mulatta), we identified 27 layer IV neurons with orthodromic stimulation and 57 layer V neurons with antidromic stimulation from the superior colliculus. With the use of established criteria, we classified the layer IV neurons as putative excitatory (n = 11), putative inhibitory (n = 12), or ambiguous (n = 4). We found that just before a saccade, putative excitatory neurons increased their visual response at the RF, putative inhibitory neurons showed no change, and ambiguous neurons increased their visual response at the FF. None of the neurons showed presaccadic visual changes at both RF and FF. In contrast, neurons in layer V showed full remapping (at both the RF and FF). Our data suggest that elemental signals for remapping are distributed across neuron types in early cortical processing and combined in later stages of cortical microcircuitry.
Keywords: vision, saccades, perception, microcircuitry
many neurons in the primate visual system exhibit presaccadic remapping (Duhamel et al. 1992; Nakamura and Colby 2002; Umeno and Goldberg 1997, 2001). During fixation (Fig. 1), these neurons respond to visual stimuli in their receptive field (RF). Just before a saccade (Fig. 1), they become newly responsive at a remapped location, the future field (FF), which is where the RF will reside after the saccade. The spatial selectivity and presaccadic timing of the FF visual response imply the use of advance information about the saccade, i.e., corollary discharge (Duhamel et al. 1992; Kusunoki and Goldberg 2003; Sommer and Wurtz 2008). Also, before a saccade, many of the neurons become less responsive at their RF. After a saccade, the FF becomes the new RF. Remapping has been proposed as a possible mechanism for stabilizing vision across saccades (Crapse and Sommer 2008, 2012; Merriam and Colby 2005; Sommer and Wurtz 2008). It may also contribute to the sequencing of saccades (Klier and Angelaki 2008) and/or the shifting of spatial attention (Cavanagh et al. 2010).
Fig. 1.
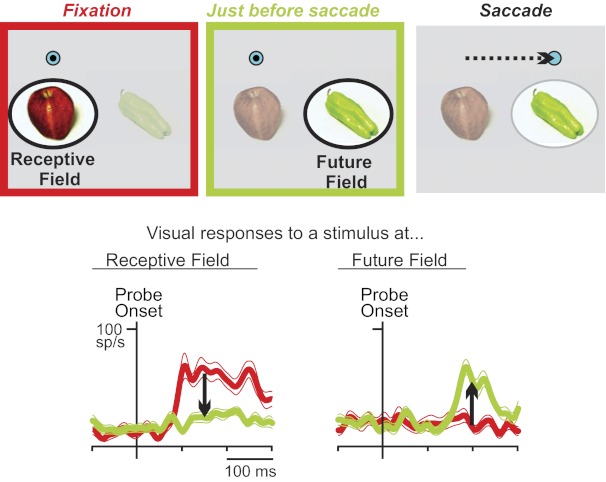
Presaccadic visual remapping. Color code is same throughout the figure: red is during fixation; green is just before a saccade. Top: during initial fixation, a monkey foveates (black dot) a fixation spot (blue circle), and neurons are sensitive to stimuli (e.g., the apple) only in their receptive field (RF; left). Just before a saccade visual sensitivity increases for stimuli (the pepper) at a new location, the future field (FF), and often decreases at the RF (middle). The FF is where the RF will be after the saccade. Then, the saccade is made (dashed arrow; right). Bottom: example frontal eye field (FEF) neuron with full remapping, recorded in layer V [it was antidromically activated from the superior colliculus (SC)]. Traces show means and SEs of spike-density functions. From fixation to just before a saccade, visual responses go down at the RF and up at the FF (arrows). Modified from Sommer and Wurtz (2006).
Presaccadic remapping was discovered originally in lateral intraparietal cortex (LIP) (Duhamel et al. 1992), but it is prominent in the frontal eye field (FEF) as well (Umeno and Goldberg 1997, 2001). In the FEF, a source of corollary discharge for remapping has been identified. The FEF receives corollary discharge of saccades via a pathway from the superior colliculus (SC), which is relayed by the mediodorsal nucleus of the thalamus (Sommer and Wurtz 2002, 2004a, b). Inactivating this pathway impairs presaccadic remapping in the FEF by ∼50% (Sommer and Wurtz 2006). The thalamocortical segment of this pathway terminates in layer IV of the FEF (and to a lesser extent, deep layer III) (Benevento and Fallon 1975; Giguere and Goldman-Rakic 1988; Goldman-Rakic and Porrino 1985). For brevity, we term the recipient neurons of the pathway “FEF layer IV” neurons. Nearly all of them have a visual response [94% in Sommer and Wurtz (2004a)], probably due, in large part, to inputs from extrastriate visual cortex (Ferraina et al. 2002; Schall et al. 1995).
Taking all of these findings together, a simple hypothesis is that the FEF may combine corollary discharge with visual information to create presaccadic remapping. A rigorous test of this hypothesis would require one to trace the processing of signals through the FEF, which is not yet possible in behaving monkeys. It is possible, however, to identify signals related to two aspects of FEF microcircuitry. We may distinguish between neurons of different laminae (layers IV and V) (Everling and Munoz 2000; Segraves and Goldberg 1987; Segraves and Park 1993; Sommer and Wurtz 1998, 2000, 2001, 2004a) and valences (excitatory vs. inhibitory neurons) (Cohen et al. 2009). The signals of different layers and neuron types in the FEF could be sampled to assess whether they match predictions of the hypothesis. One prediction is that remapping should be incomplete in input neurons but fully developed in output neurons.
Our goal, therefore, was to examine the microcircuitry of remapping in the FEF at two levels: the laminar location of neurons and the excitatory/inhibitory influence of neurons. In behaving monkeys, we physiologically identified FEF layer IV neurons and for comparison, layer V neurons. The layer IV neurons were expected to consist of both excitatory and inhibitory neurons, as found previously for thalamic-recipient layer IV neurons throughout the brain and across species (Beierlein et al. 2003; Swadlow 2003; Tan et al. 2008). It is well established that inhibitory and excitatory neurons may be discriminated in extracellular recordings from behaving monkeys (Chen et al. 2008; Cohen et al. 2009; Constantinidis and Goldman-Rakic 2002; Ding and Gold 2012; Johnston et al. 2009; Mitchell et al. 2007; Rao et al. 1999; Song and McPeek 2010; Tamura et al. 2004). In general, excitatory neurons have broader action potentials and lower spontaneous firing rates than inhibitory neurons (Connors and Gutnick 1990; Kawaguchi 1993; McCormick et al. 1985; Nowak et al. 2003). We applied these principles, aided by a calibration set of data from known excitatory neurons (the layer V sample), to discriminate different putative neuron types of layer IV. We characterized their fundamental visual, delay, and saccade-related activities using a memory-guided saccade task (Bruce and Goldberg 1985; Mays and Sparks 1980) and quantified their presaccadic changes in visual responses at the RF and FF with the use of a presaccadic remapping task (Nakamura and Colby 2002; Sommer and Wurtz 2006). Finally, we compared the properties of remapping in layer IV (FEF input) with those in layer V (FEF output).
We found that layer IV neurons remap only partially: they exhibit presaccadic changes in visual responses at the RF or FF but not both. These component changes were distributed between different neuron types in layer IV. In contrast, we found that full remapping (changes at the RF and the FF) was prevalent in layer V neurons. Our data thus provide evidence in support of the hypothesis that the FEF may help to create presaccadic remapping. Neurons at the input of FEF seem to engage in a division of labor that may be used to produce full remapping at the output of FEF.
MATERIALS AND METHODS
Surgery
Experiments were performed on four male rhesus monkeys (Macaca mulatta). In aseptic surgery using isoflurane anesthesia, we implanted recording chambers over craniotomies that provided access to the FEF and SC. We also implanted subconjunctival coils for monitoring eye position. Plugs for the eye coils, a post for minimizing head movements during experiments, and the recording chambers were bound together with dental acrylic and fixed to the skull with bone screws. Surgeries were performed at the National Institutes of Health by M. A. Sommer in collaboration with Dr. Robert H. Wurtz. All procedures were approved by the Institutional Animal Care and Use Committee and complied with Public Health Service Policy on the humane care and use of laboratory animals.
Equipment
A monkey faced a tangent screen onto which visual stimuli were back projected with a liquid crystal display projector. A personal computer controlled the presentation of visual stimuli, and this computer in turn was controlled by a computer running a QNX-based real-time experimentation data acquisition system (REX) (Hays et al. 1982). A third computer ran a digital oscilloscope program (50 kHz sampling rate), which allowed us to isolate action-potential waveforms using time and amplitude windows. Data files stored at 1 ms resolution the timings of task events, the occurrence of action potentials, and samples of eye position. One of the task events was a code provided by a photocell circuit that confirmed the exact timings of visual stimulation. The photocell was at the corner of the tangent screen, shielded from the monkey's view, and it detected flashes presented simultaneously with all of the task-related visual stimuli. Neurons were recorded with parylene-coated tungsten electrodes (FHC, Bowdoin, ME).
Behavior
We studied neuronal activity by having monkeys perform two tasks. First, with a memory-guided saccade task, we documented each neuron's fundamental signals: its classical RF visual response and its delay and saccadic activity (Bruce and Goldberg 1985; Sommer and Wurtz 2000). Second, with a presaccadic remapping task [same as used in Sommer and Wurtz (2006), based on the design of Nakamura and Colby (2002)], we assessed each neuron's visual response at the FF and RF during early fixation vs. just before a saccade.
Memory-guided saccade task.
The monkey was required to fixate on a central spot of light for a random duration (500–800 ms), and then a visual target appeared for 50 ms in the RF of the neuron or randomly interleaved at the diametrically opposite location. With the use of two locations, an explicit spatial memory requirement was introduced, but only the trials involving response field targets were analyzed. The monkey had to maintain fixation during a delay period of 500–1,000 ms (randomized by trial). Then, the fixation light disappeared, cueing the monkey to make a saccade to the location where the target had been presented. A drop of water was delivered for correct performance.
Presaccadic remapping task.
The task is illustrated in Fig. 2, with spatial aspects of the task (Fig. 2A) aligned with a timeline of events (Fig. 2B). The monkey fixated a spot for 400–600 ms, a saccade target appeared outside of the neuron's RF, and after a reaction time, the monkey made a saccade to the target (Fig. 2). The main experimental manipulation was to test visual responsiveness of the neuron with the use of small, brief probes (50 ms duration). They were irrelevant to the monkey's task, and if a monkey made a saccade to a probe (monitored with electronic windows, ∼1° diameter around all stimuli), the trial was aborted. We interleaved six trial types. In four of six trials, the probe was bright white and appeared either in the RF or the FF of the neuron, during initial fixation or just before the saccade (one of six trials each). We implemented “just-before-saccade” trials by synchronizing probe appearance to occur ∼120 ms after onset of the saccadic target (hence, during the reaction time in Fig. 2B). The exact timing was variable and was adjusted by the investigator to keep probe appearance near saccade initiation even if reaction time varied day to day or within a session. Effectively, this procedure caused probes to appear ∼100 ms before saccade onset (median: 105 ms; minimum: 50 ms; maximum: 349 ms). For the data analyzed in this report, probe appearance was always completed before the eyes began to move; we inspected every trial offline and deleted trials in which the saccade started before the probe disappeared.
Fig. 2.
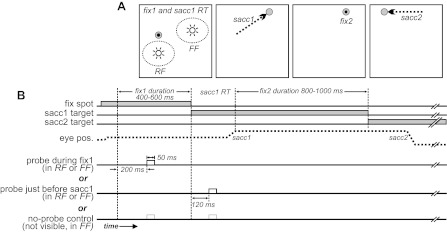
Details of the presaccadic remapping task. Diagrams show the spatial arrangement (A) and timing (B) of the task. A: the fixation (fix1/2) spots and saccade targets (sacc1 and 2) are gray. The monkey's fixations are shown with black dots, and its saccades with dashed arrows. The flashed probes for eliciting visual responses are white. See materials and methods for details. RT, reaction time.
The remaining two of six trials consisted of a “no-probe” condition. They were identical in every way to other trials, but the probe was the same luminance and chrominance of the background so that it could not be seen. The nonvisible probe appeared during fixation or just before the saccade, providing a time-matched measure of neuronal activity in the absence of visual stimulation (the probe's location was arbitrary; we placed it at the FF).
In every trial, 800–1,000 ms after the monkey completed the first saccade, the original saccade target (on which it was now fixating) disappeared, and a second saccade target appeared away from both the RF and FF locations. After the monkey made a second saccade to this target (Fig. 2), the trial ended, and a water reward was delivered. The purpose of the second saccade was to discourage covert planning of saccades to the probes by forbidding their execution. Data related to the second saccade were not analyzed.
Electrophysiology
We recorded extracellularly in the FEF using standard techniques (Sommer and Wurtz 2000). After isolating a FEF neuron, we tested whether it was activated from stimulation in the SC and if so, whether the activation was orthodromic or antidromic [Fig. 3A; for reviews of stimulation techniques, see Lemon (1984) and Lipski (1981)]. We distinguished anti- from orthodromic activation primarily with the collision test (Fig. 3, B and C). Stimulation consisted of a single, biphasic pulse of current (negative-positive, 0.15 ms/phase), applied through monopolar tungsten electrodes (FHC), implanted with their tips in the intermediate layer of the SC. For full details of our stimulation methods, see Sommer and Wurtz (1998, 2000, 2004a).
Fig. 3.
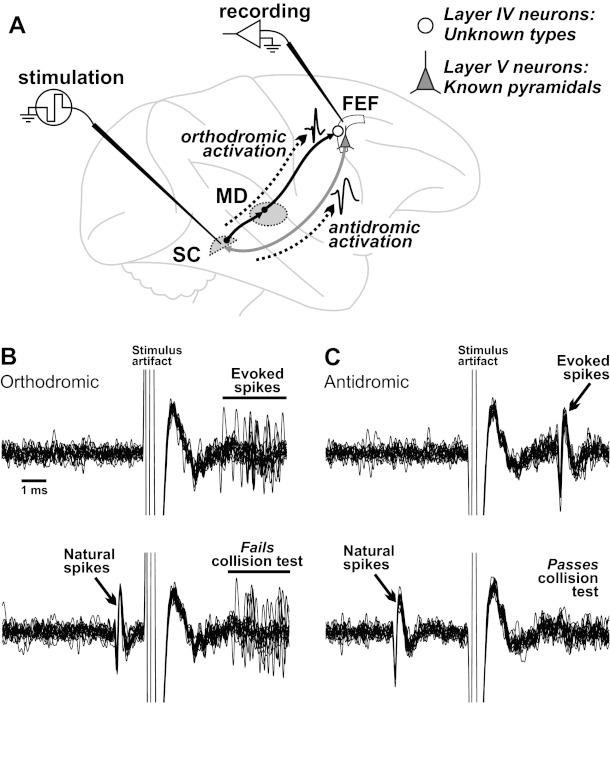
Physiological approach for identifying the laminar locations of FEF neurons. A: stimulation of the SC-activated neurons in the FEF (white, curved region) either orthodromically in layer IV or antidromically in layer V. MD, mediodorsal nucleus of the thalamus. B and C: in each of the 4 plots, FEF recordings are superimposed during 15 trials of stimulating the SC and are aligned on stimulus artifacts. B: orthodromic activation. This example FEF layer IV neuron produced action potentials at variable latency, starting 3 ms after the start of SC stimulation (top), and failed the collision test (bottom). The time calibration scale is shown (left). C: antidromic activation. This example layer V neuron produced action potentials at a fixed 3.5-ms latency (top) and passed the collision test (bottom).
Analyses
Neuronal classification.
Orthodromic activation identified neurons of FEF layer IV (Benevento and Fallon 1975; Giguere and Goldman-Rakic 1988; Goldman-Rakic and Porrino 1985; Sommer and Wurtz 1998, 2004a; Wurtz et al. 2005), which could be inhibitory or excitatory (Beierlein et al. 2003; Swadlow 2003; Tan et al. 2008). Antidromic activation identified neurons of FEF layer V that are known to be excitatory pyramidals (Fries 1984; Leichnetz et al. 1981). Therefore, we exploited the layer V neurons as a calibration set for categorizing the layer IV neurons [similar to the approaches of Swadlow (1989) and Johnston et al. (2009)]. The calibration set was especially important in light of recent evidence that large pyramidals can be mistaken for inhibitory interneurons in categorization analyses (Vigneswaran et al. 2011). For all neurons, we measured two parameters known to help distinguish excitatory from inhibitory neurons: action-potential width and spontaneous firing rate.
All neurons accepted for action-potential width analysis were well isolated; the average signal-to-noise ratio (SNR) was 5.7 for our layer IV sample and 5.8 for our layer V sample, where SNR was defined as the peak-to-peak amplitude of the action potential divided by the peak-to-peak amplitude of the background activity. We took measurements from each neuron's naturally produced action potentials [as opposed to its stimulation-evoked action potentials; artificial activation may alter action-potential shape; reviewed by Lemon (1984)]. Specifically, we analyzed the action potentials used for the collision test, which was performed on all neurons. This strategy ensured that for layer V (antidromically activated) neurons, the action potential was produced by the neuron under study, because it caused successful collision of the stimulation-activated spike. The same technique was used for layer IV (orthodromically activated) neurons to keep the methods as identical as possible between the data samples.
All of the action potentials thus collected from each neuron were averaged. Then, seven easily identifiable features of the average waveform were marked and their times of occurrence measured (Fig. 4A). We used the following time points: t1, start of action potential; t2, time of first trough; t3, time of return to baseline after first trough; t4, time of action-potential peak; t5, time of return to baseline after peak; t6, time of second trough; and t7, time of final return to baseline. Times t2–t6 were unambiguous, local minima, maxima, or zero crossings. We defined time t1 to be when the waveform dropped 10% of the way from baseline to the first trough and time t7 to be when the waveform rose 90% of the way to baseline from the second trough. Baseline was the average level for the 200-ms period prior to the action potential.
Fig. 4.
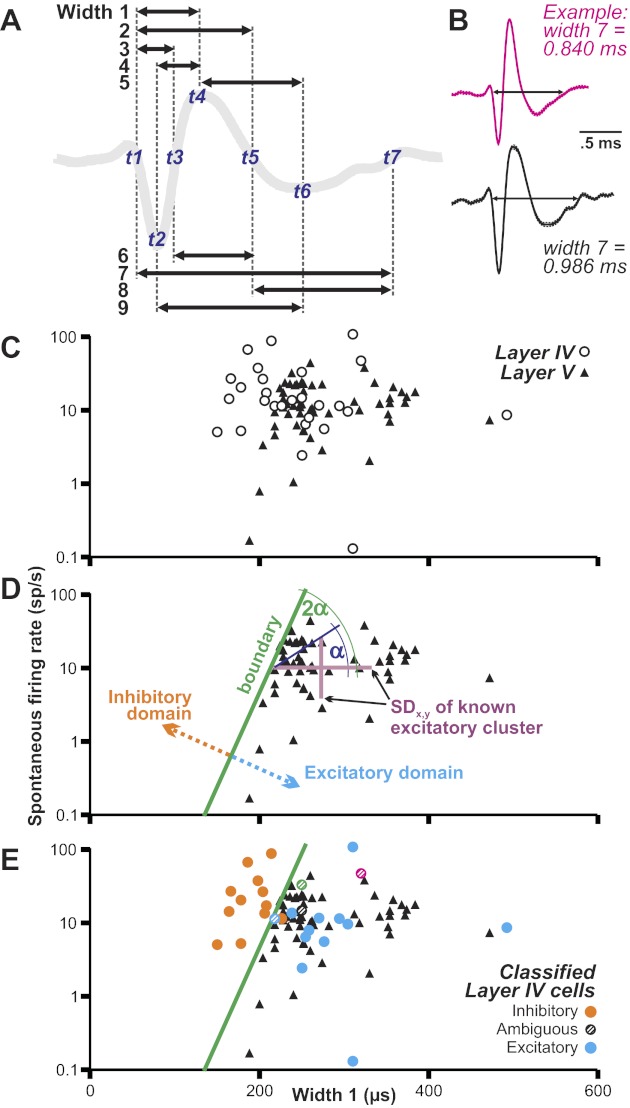
Categorization method for identifying putative neuron types in FEF layer IV. A: we measured 9 widths of each action potential (arrows), based on 7 time points (t1–t7). B: example of 1 width measure (action potential start to end; width 7) for (top) the layer IV neuron of Fig. 3B and (bottom) the layer V neuron of Fig. 3C. Each waveform is the mean (bold curve) ± SE (dashed curves, barely visible) of all action potentials collected from the neurons. C: plot of width vs. log10(spontaneous firing rate) for the layer IV and V neurons. A swath of layer IV neurons stands out clearly, at the upper left, from the layer V (known excitatory neurons) cluster. The layer IV neurons overlap partially with the calibration cluster of known pyramidals (black triangles). Data are shown for width 1 measurement. D: geometrical construction of an objective boundary at the upper-left edge of the layer V cluster to create putative inhibitory (orange) and excitatory (blue) domains for classifying layer IV neurons according to width 1. SDx,y, SDs of the layer V cluster in the x and y directions (purple lines). We drew the hypotenuse between these SDs as plotted on the graph (dark blue line), found its angle relative to the x-axis (α), doubled it (2α), and translated the resulting line to the upper-left edge of the cluster (green line). E: layer IV neurons (circles) overlaid onto the same layer V cluster and its boundary. Colors and patterns of the circles depict the final classification of each neuron, based on analysis of all of the width measures (see Fig. 6A). The 4 ambiguous neurons have different colors so that they can be tracked across graphs.
From the time points, we calculated nine width measurements based on a review of the literature (Fig. 4A). Our goal was to achieve inhibitory/excitatory neuronal discriminations with which the majority of previous investigators would agree. Width 1 was the duration from onset to peak (i.e., time t4 − time t1) (Gonzalez-Burgos et al. 2005). Width 2 was the duration from onset to end-of-the-peak phase (t5–t1) (Gonzalez-Burgos et al. 2005; Johnson and Welsh 2003; Rao et al. 1999). Following the methods of Bartho et al. (2004), width 3 was the duration from onset to end-of-first-trough phase (t3–t1) and width 4 the duration from first trough to peak [t4–t2; also used by Ding and Gold (2012); Johnston et al. (2009); Mitchell et al. (2007)]. Width 5 was the duration from peak to second trough (t6–t4) (Frank et al. 2001). Based on work from the Simons laboratory, width 6 was the duration between the end-of-the-first-trough phase to the end-of-peak phase (t5–t3) (Bruno and Simons 2002), width 7 the total duration from start to end of the waveform (t7–t1) (Simons 1978; Swadlow 1989), and width 8 the duration from end-of-the-peak phase to end of the entire waveform (t7–t5) (Bruno and Simons 2002). Width 9 was the duration between the first and second trough (t6–t2) (Constantinidis and Goldman-Rakic 2002).
Examples of one width measurement (width 7) applied to the neurons of Fig. 3, B and C, are shown in Fig. 4B. For most of our layer IV neurons (21 of 27), we were able to obtain all nine width measurements, but due to noise or truncation of the action-potential trace by the stimulus artifact (due to the collision test), in two neurons, we obtained only seven width measurements and in four neurons, five width measurements.
Following the procedure of Constantinidis and Goldman-Rakic (2002), we measured spontaneous firing rate as the average activity during initial fixation of the memory-guided saccade task (in a 300-ms epoch that ended 200 ms before the peripheral target appeared). During this period, both motor activity (fixation) and sensory input (foveal stimulation) are minimal and constant for every neuron. We excluded neurons with foveal visual responses or modulations related to the act of fixation [e.g., see Sommer and Wurtz (2000)].
Hence, for each neuron, we acquired up to nine width measures and a spontaneous firing rate. We plotted width vs. spontaneous firing rate in semilog scatterplots to compare the unknown neurons (from layer IV) with the known pyramidals (from layer V). An example plot, for width 1, is shown in Fig. 4C; the layer IV neurons overlapped partially with the calibration cluster of known pyramidals. Approximately one-half of the layer IV neurons fell within the calibration cluster and thus were candidates for being excitatory neurons. The rest fell completely outside of the calibration cluster, generally up and to the left; they had higher spontaneous firing rates and/or narrower action potentials than the known pyramidals and were candidates for being inhibitory neurons.
We quantified these observations by establishing an absolute boundary at the upper-left edge of the calibration cluster of layer V neurons. As shown in Fig. 4D, we calculated the SD of the calibration cluster in the x and y directions. We then drew the hypotenuse between these SDs, found its angle relative to the x-axis, doubled it, and translated the resulting line to the upper-left edge of the cluster. The boundary defined an inhibitory domain to the upper left (containing no layer V neurons) and an excitatory domain to the lower right (containing all of the layer V neurons). The cloud of layer IV neurons was essentially bisected by the boundary line (Fig. 4E). Plots for the other eight width measurements (widths 2–9) are shown in Fig. 5, A–H.
Fig. 5.
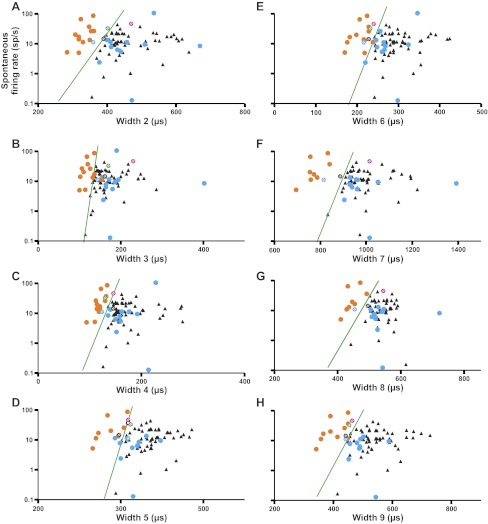
Width vs. spontaneous firing rate plots using the other 8 width measures. A–H: widths 2–9. Data symbols and other conventions as shown in Fig. 4E.
Due to two features of our methodology, we think we avoided the potential problems pointed out by Vigneswaran et al. (2011), who found that pyramidal neurons can have surprisingly short action-potential widths that resemble those of putative inhibitory neurons. First, because we recorded layer V projection neurons identified with antidromic activation, we know what excitatory neuron data look like when collected in our experimental rigs. Second, we relied not only on action-potential width but also on spontaneous firing rate, providing a second dimension for separating neurons.
The final step of our analysis was to determine how consistently each layer IV neuron fell in the inhibitory or excitatory domains across all of the width measurements. For each neuron, we examined the nine graphs to tally a “vote” as to whether it should be considered inhibitory or excitatory. The fraction of graphs for which the neuron fell in the inhibitory domain was that neuron's Inhibitory Index. The final distribution of Inhibitory Indices was bimodal (Fig. 6A), with most neurons having an Inhibitory Index of 0 or 1; the rest were spread evenly in between. We segmented the distribution by quartiles to define a putative excitatory range (Inhibitory Index ≤ 0.25), a putative inhibitory range (Inhibitory Index ≥ 0.75), and an ambiguous range (0.25 < Inhibitory Index < 0.75). The final classifications are represented in Figs. 4E and 5. In sum, our classification approach essentially performed an unbiased poll of all previously published methods for categorizing neuron types in extracellular recordings and accepted the majority opinion.
Fig. 6.
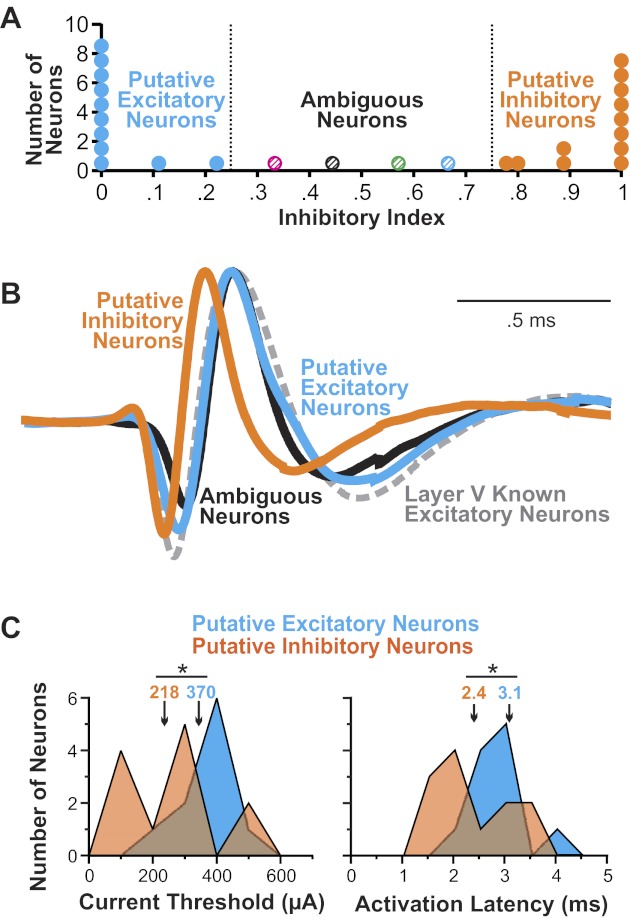
Final categorizations of the FEF layer IV neurons and their physiological properties. A: distribution of Inhibitory Indices, calculated as a vote over all of the literature-based width measurements, showing the value for every neuron. The distribution was segmented into quartiles that defined putative excitatory neurons (blue circles), putative inhibitory neurons (orange circles), and ambiguous neuron (multicolored hatched circles). B: average action-potential waveforms for the 3 classes of layer IV neurons. For comparison, the average action-potential waveform of known pyramidal (identified layer V) neurons is shown with a dashed line. The waveforms were height normalized by matching the peaks and the baseline levels. C: sensitivity of the putative excitatory and inhibitory neurons to orthodromic stimulation. Distributions of current thresholds (left) and activation latencies (right) are plotted with the use of 100-μA and 0.5-ms bins, respectively. Numbers show medians. Data for ambiguous neurons are not shown, but they were similar to the putative excitatory neurons: their median current threshold was 396 μA and activation latency, 3.1 ms. *P < .05 by Mann-Whitney rank sum test.
Task-related activity.
Neuronal activity collected during the tasks was measured using spike counts in epochs or continuous spike-density functions (Gaussians of 10 ms width). The analyses are described on a case-by-case basis in results, except for the method to quantify remapping activity, which is described next. For all analyses, significance levels were P < 0.05, corrected as necessary for multiple comparisons, and selection of parametric or nonparametric tests was guided by preliminary analysis of normality and equal variance.
We defined remapping activity as a response to a probe presented at the FF just before a saccade that significantly exceeded the activity in time-matched, no-probe trials. The start of remapping varies considerably from neuron to neuron in the FEF, from 100 ms before saccade initiation to 200 ms after [reviewed by Sommer and Wurtz (2008)], so we could not use a fixed-analysis epoch. Analysis proceeded in two steps: first, we looked for potential remapping periods, and then, if one was found, we focused our statistical analysis within it. To identify potential remapping periods, we examined spike-density functions. The criteria for such a period was that the activity in probe trials had to exceed the activity in no-probe trials for at least 100 ms, beginning within the range 100 ms before to 200 ms after saccade initiation. If a potential remapping period was found, we centered a 100-ms epoch within it to quantitatively compare spike counts in probe vs. no-probe trials. If no potential remapping period was found, we completed our statistical analysis of the neuron with the use of a default 100-ms epoch starting at saccade initiation.
RESULTS
Identification of FEF Layer IV and V Neurons
We recorded extracellularly from single neurons in the right FEF of four monkeys while stimulating the SC on the same side (Fig. 3). We studied only neurons activated by the stimulation. The primary data set consisted of 27 layer IV neurons identified by orthodromic activation in three monkeys (Fig. 3, A and B; 13 neurons from monkey “Y”, 11 from monkey “T”, and three from monkey “H”). A comparison set of 57 layer V neurons identified by antidromic activation was collected from two of the monkeys plus an additional one (Fig. 3, A and C; 42 neurons from monkey “Y”, 14 from monkey “T”, and one from monkey “C”). None of these neurons were both ortho- and antidromically activated. Orthodromic activation occurred at median latency 2.9 ms (minimum: 1.6 ms; maximum: 4.2 ms), consistent with a disynaptic route from SC to thalamus to FEF layer IV, as calculated previously in a study of each leg of the pathway (Sommer and Wurtz 2004a). Overall, the stimulation-related characteristics of orthodromic and antidromic activation conformed to previous findings (Sommer and Wurtz 1998, 2000, 2004a) and are not reported in detail here.
Categorization of Layer IV Neuronal Types
We plotted action-potential width vs. spontaneous firing rate for every layer IV neuron and for comparison, every layer V neuron. This was done for nine width measures used in previous work (Figs. 4 and 5). The graphs yielded, for every layer IV neuron, an Inhibitory Index corresponding to the evidence that it is inhibitory, based on our calibration set of known excitatory neurons and the consensus of techniques from the literature (see materials and methods).
The distribution of Inhibitory Indices is shown in Fig. 6A. Eleven neurons were considered putative excitatory (Inhibitory Index ≤ 0.25), of which most (n = 9) had an Inhibitory Index of zero. Twelve were considered putative inhibitory (Inhibitory Index ≥ 0.75), of which most (n = 8) had an Inhibitory Index of one. Four neurons had midrange Inhibitory Indices (0.25 < Inhibitory Indices < 0.75), so we termed them “ambiguous” neurons.
Some of the width measures (widths 2, 7, and 9; Fig. 4A) are sums of others. In practice, this was not a problem, because the analysis outcomes from using those widths were not predictable from the results of the component widths. For example, all of the ambiguous neurons fell in the excitatory domain for width 3 (Fig. 5B) and in the inhibitory domain for width 6 (Fig. 5E), but they segregated into differing domains for width 2 (Fig. 5A; width 2 = width 3 + width 6). If widths 2, 7, and 9 are omitted, the final classifications are nearly the same: the Inhibitory Index distribution is still sharply bimodal (including nine neurons with value zero and seven with value one), and the ambiguous neurons are still midrange (values 0.33–0.5). For closest adherence to previous work, we used the classifications based on all nine width measures (Fig. 6A).
We averaged the action-potential waveforms of neurons within each class to compare their time courses. The average action potential for the putative inhibitory neurons (Fig. 6B) was, as expected, appreciably narrower than that for the putative excitatory neurons. We compared these average waveforms with the average waveforms of the ambiguous neurons and the layer V known excitatory neurons. The average waveform of the putative excitatory neurons overlapped almost completely with that of the known excitatory neurons. The average waveform of the ambiguous neurons was similar to the waveforms of excitatory neurons except for a noticeably slower drop to first trough, a shallower first trough, and a steeper drop from peak.
As an independent check on our major classifications (putative inhibitory vs. excitatory neurons), we compared their orthodromic stimulation parameters (Fig. 6C). Inhibitory neurons would be expected to be more sensitive to afferent input than excitatory neurons, and our data seemed to reflect this difference. The sample of putative inhibitory neurons required lower threshold currents for activation (Fig. 6C) and responded at quicker activation latencies (Fig. 6C) than the sample of putative excitatory neurons. Similar threshold current results were reported by Swadlow (1989).
Neuronal Activity During Memory-Guided Saccades
We analyzed the activity of our 27 layer IV neurons with the use of a memory-guided saccade task to assess their fundamental signal characteristics (Bruce and Goldberg 1985; Mays and Sparks 1980). Figure 7A shows the average activity profiles of the three neuronal classes during the task. Early activity, 500–200 ms before target onset (Fig. 7A), was the “spontaneous firing rate” used for neuronal classification. Hence, as would be expected, it was highest for putative inhibitory neurons (mean, 28.5 sp/s), lowest for putative excitatory neurons (19.4 sp/s), and intermediate for ambiguous neurons (24.3 sp/s). Nearing target onset, the firing rates converged to ∼20 sp/s for all three classes. We used the mean activity 200–0 ms before target onset as the baseline level for evaluating later activity.
Fig. 7.
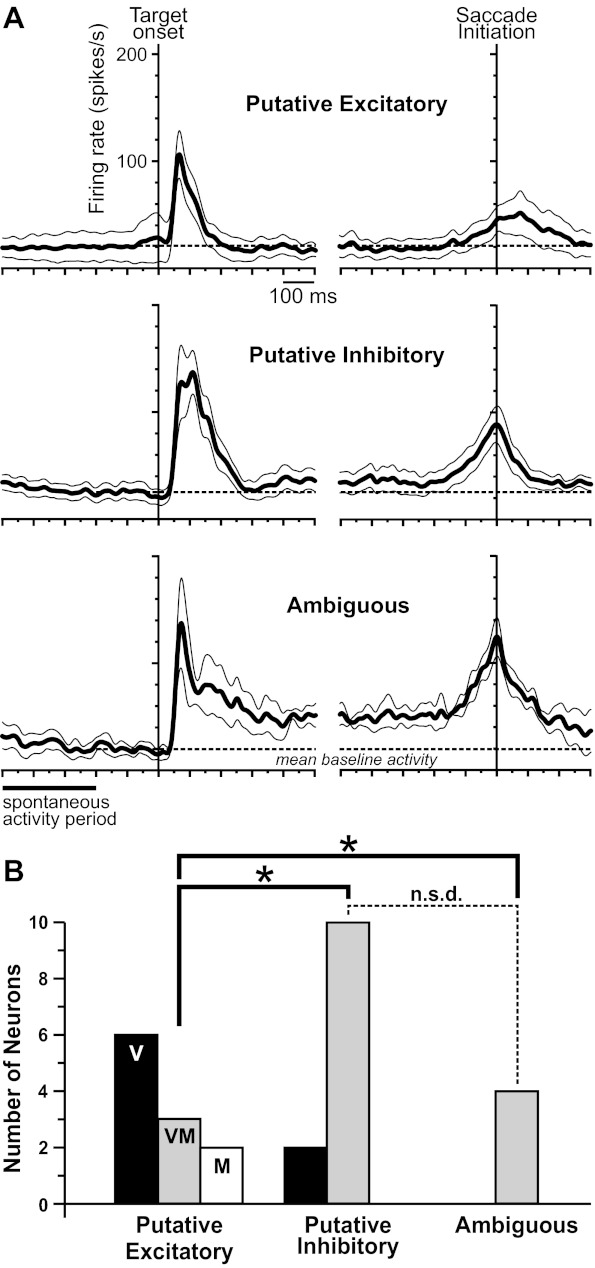
Activity profiles of the layer IV neuronal classes during memory-guided saccades. A: average spike-density functions (±SEs) of the 11 putative excitatory (top), 12 putative inhibitory (middle), and 4 ambiguous neurons (bottom). Activity profiles were aligned to visual target onset (left) and saccade initiation (right). Gaussian of each spike-density function was width 10 ms, here and in the remaining figures. We used the mean activity 200–0 ms before target onset as the baseline level (dashed lines) for evaluating later activity. B: composition of each class in terms of visual (V), visuomovement (VM), and movement (M) neurons. n.s.d., not significantly different; *P < 0.05.
All three classes of neurons had prominent visual responses (Fig. 7A). Quantitatively (50–150 ms after target onset), the mean visual responses were 72.4 sp/s for putative excitatory, 117.3 sp/s for putative inhibitory, and 94.2 sp/s for ambiguous neurons (not significantly different from each other; ANOVA, P = 0.289). The visual response for each class of neuron exceeded its respective baseline level significantly (one-sample t-tests: P = 0.0064 for putative excitatory, P = 0.00095 for putative inhibitory, and P = 0.031 for ambiguous neurons).
After the initial visual response subsided (∼400 ms after target onset), activity returned to baseline for the putative excitatory and inhibitory neurons but remained elevated for the ambiguous neurons. Quantified 400–600 ms after target onset (after the phasic visual response but before the end of the shortest delay period), mean delay activity was 16.1 sp/s for putative excitatory neurons, 36.5 sp/s for putative inhibitory neurons, and 51.1 sp/s for ambiguous neurons (significantly different between classes; ANOVA, P = 0.009). Only for ambiguous neurons did delay activity exceed baseline activity (one-sample t-test, P = 0.016; for the other two classes, P > 0.3).
After the delay period, all three classes of neurons showed saccade-related activity (Fig. 7A), although it was relatively sluggish for putative excitatory neurons. Measured 50–0 ms before saccade initiation, presaccadic activity was 37.4 sp/s for putative excitatory neurons, 80 sp/s for putative inhibitory neurons, and 106.6 sp/s for ambiguous neurons (significantly different between classes; ANOVA, P = 0.012). Presaccadic activity exceeded the delay activity level in all three classes (one-sample t-tests: P = 0.044 for putative excitatory, P = 0.0073 for putative inhibitory, and P = 0.014 for ambiguous neurons).
Individual FEF neurons can have various combinations of signals, and it is customary to categorize them as visual neurons (visual response but no saccadic activity), visuomovement neurons (visual response and saccadic activity), or movement neurons (saccadic activity but no visual response) (Bruce and Goldberg 1985). We used the memory-guided saccade task to classify signal combinations of individual neurons [as in Sommer and Wurtz (2000); in brief, this involved calculating firing rates in a variety of task epochs followed by ANOVA and multiple comparison tests]. The results are shown in Fig. 7B. Our putative excitatory class consisted primarily of visual neurons, with fewer visuomovement neurons and rare movement neurons (Fig. 7B). In contrast, our putative inhibitory and ambiguous classes contained visuomovement neurons almost exclusively (Fig. 7B). Overall, the three distributions were significantly different (Freeman-Haltan 3 × 3 extension of the Fisher exact test, P = 0.02). Specifically, putative excitatory neurons had a different distribution than each of the other two classes (Freeman-Haltan 2 × 3 extension of the Fisher exact test, P = 0.003). No other pairwise comparisons among the distributions were significant.
In sum, the putative excitatory, putative inhibitory, and ambiguous neurons were similar in having significant visual responses and presaccadic activity, but only ambiguous neurons had significant delay activity. At the individual neuron level, ambiguous and putative inhibitory neurons were relatively homogeneous—mostly visuomovement in nature—whereas putative excitatory neurons were more heterogeneous.
Neuronal Activity in the Remapping Task
Layer IV neurons.
We collected data with the remapping task (Fig. 2) for 19 of the layer IV neurons: nine of the putative excitatory neurons (the two movement neurons were excluded), six of the putative inhibitory neurons, and all four ambiguous neurons. Figure 8A shows data from an example putative excitatory neuron. It had a small visual response at the RF during fixation, which increased just before the saccade (bold spike-density functions). The neuron was essentially silent if probes appeared at the FF during fixation or just before the saccade (Fig. 8A) or if no probes appeared (Fig. 8A).
Fig. 8.
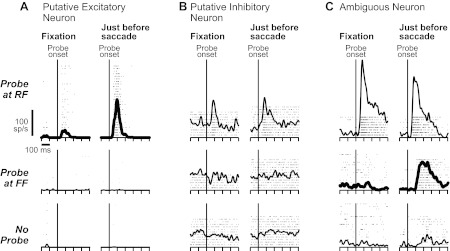
Activity of layer IV example neurons during the remapping task. A–C: in each panel, the rows show the probe condition: located at the RF (top), the FF (middle), or not presented (bottom). The columns show the probe timing: presented during initial fixation (left) or just before the saccade (right). Activity changes that represent components of remapping are emphasized with bold spike-density functions. A: example putative excitatory neuron. Its visual response increased at the RF just before the saccade. It was unresponsive at the FF and in the absence of a probe. B: example putative inhibitory neuron. Its visual responses were unchanged before the saccade. C: example ambiguous neuron. It showed an emergent visual response at the FF just before the saccade but little if any change in activity at the RF or in the absence of a probe.
An example putative inhibitory neuron (Fig. 8B) had a visual response for probes at the RF, but this response was comparable during fixation and just before the saccade. The neuron had no activity modulations for probes flashed at the FF (Fig. 8B) or in the absence of a probe (Fig. 8B).
An example ambiguous neuron (Fig. 8C) had a visual response at the RF during fixation that decreased slightly (but not significantly, as documented below) just before the saccade. Strikingly, the neuron showed a large, remapped response at the FF (bold spike-density functions). During fixation, there was no response to the probe, but just before the saccade, there was a strong response. There was meager activity in the absence of the probe.
Figure 9 shows population data for the three classes of neurons. First, we consider changes at the RF (Fig. 9, A–C). The sample of putative excitatory neurons (Fig. 9A) significantly increased its average visual response at the RF just before a saccade relative to during fixation (paired t-test, P = 0.016). No significant changes, however, were found for the samples of putative inhibitory neurons (Fig. 9B) and ambiguous neurons (Fig. 9C).
Fig. 9.
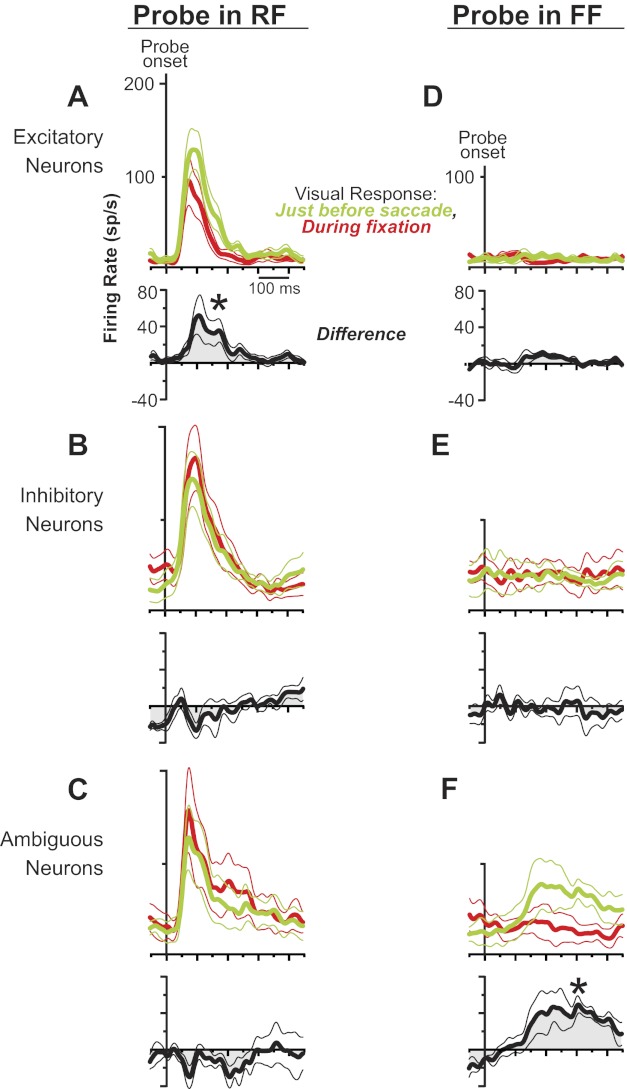
Population data for the layer IV neuronal classes during the remapping task. Data show average activity profiles (±SEs) aligned to probe onset. Black traces show differences of red and green data (green − red); *P < 0.05. When probes were presented at the RF, (A) putative excitatory neurons increased their visual response significantly just before the saccade (green) compared with during fixation (red); (B) putative inhibitory neurons and (C) ambiguous neurons showed no change. When probes were presented at the FF, (D) putative excitatory and (E) inhibitory neurons showed no change in activity just before the saccade, but (F) ambiguous neurons increased their activity significantly.
At the FF, none of the samples of neurons had a visual response during fixation (Fig. 9, D–F). Just before a saccade, putative excitatory neurons (Fig. 9D) and inhibitory neurons (Fig. 9E) remained unresponsive, but the sample of ambiguous neurons (Fig. 9F) showed a significant, nascent visual response at the FF (paired t-test, P = 0.018).
In Figs. 8 and 9, neuronal activity was aligned to probe onset, which is the simplest way to summarize the data and is appropriate for analyzing visual responses at the RF. Remapped visual responses at the FF, however, are aligned best with saccade initiation. The remapped activity, although dependent on visual stimulation, is triggered by the saccade [reviewed by Sommer and Wurtz (2008)]. Figure 10, A–C, shows example saccade-aligned data from the same example neurons of Fig. 8. Traces show responses to probes that were flashed at the FF just before the saccade, time-matched activity on no-probe trials, and the differential activity. Confirming the conclusion from Fig. 8, the putative excitatory and inhibitory neurons (Fig. 10, A and B) showed no significant response to the probe, but the ambiguous neuron did (Fig. 10C). Average data from the three populations (Fig. 10, D–F) are aligned in the same way. The samples of putative excitatory and inhibitory neurons (Fig. 10, D and E) had no significant visual response for probes at the FF, but the sample of ambiguous neurons did (Fig. 10F; P = 0.021).
Fig. 10.
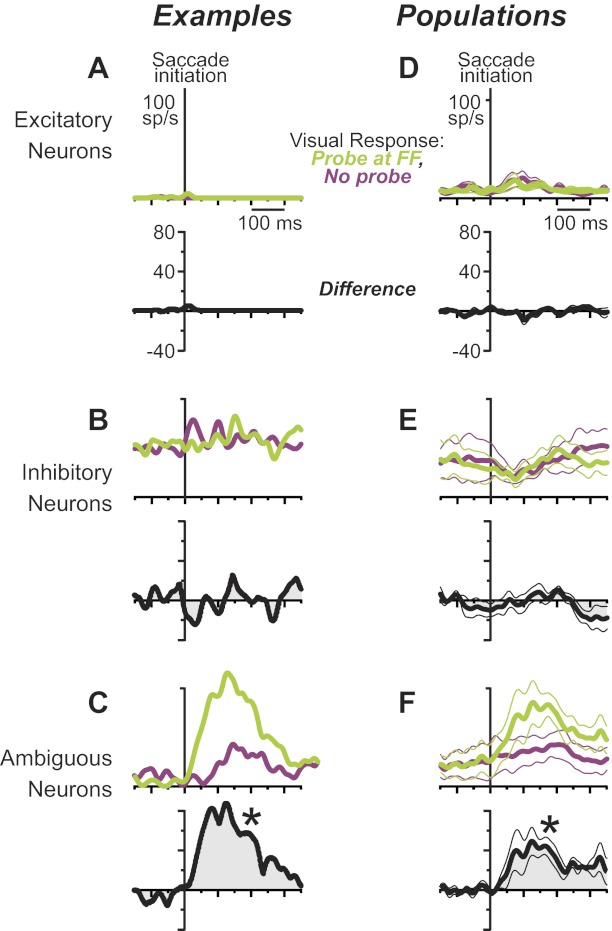
Remapped visual responses of the layer IV classes, aligned to saccade initiation. All data show visual responses to probes presented at the FF just before the saccade (green) compared with time-matched activity in no-probe trials (purple). Black traces show differences of the green and purple data (green − purple); a significant difference (*P < 0.05) defines remapping. An example putative excitatory (A) and inhibitory (B) neuron showed no remapping, but (C) an example ambiguous neuron did (these are the same neurons as shown in Fig. 8). Population data showed the same result: no remapping for (D) putative excitatory or (E) inhibitory neurons but significant remapping for (F) ambiguous neurons.
We tested whether the division of labor seen at the population level (Figs. 9 and 10) was significant for each neuron individually (Table 1). First, for each neuron, we calculated whether there was a significant increase in visual responsiveness at the RF. The mean activity, 50–150 ms after probe onset, was compared for probes flashed during fixation vs. just before the saccade. For example, the putative excitatory neuron of Fig. 8A had a visual response at the RF that increased significantly from 21 sp/s during fixation to 89 sp/s just before a saccade (Mann-Whitney rank sum test, P < 0.001). This result was found in 56% (five of nine) of putative excitatory neurons, significantly more often than in the rest of the neurons (zero occurrences in the 10 inhibitory plus ambiguous neurons; Fisher exact test, P = 0.011).
Table 1.
Distribution of remapping effects
| Component Effects (RF or FF) |
Combined Effects (RF and FF) |
||||||||
|---|---|---|---|---|---|---|---|---|---|
| Neuron Type | No. Tested | Up at RF | Up at FF | Down at RF | Down at FF | Up at both | Down at both | Up at RF; Down at FF | Down at RF; Up at FF |
| Layer IV put. exc. | 9 | 5 | 0 | 1 | 0 | 0 | 0 | 0 | 0 |
| Layer IV put. inh. | 6 | 0 | 1 | 1 | 1 | 0 | 0 | 0 | 0 |
| Layer IV ambig. | 4 | 0 | 4 | 0 | 0 | 0 | 0 | 0 | 0 |
| Layer V | 52 | 7 | 29 | 16 | 3 | 3 | 0 | 0 | 11 |
Table entries are numbers of neurons. “Up” and “Down” refer to significant increases and decreases in visual responses, respectively, just before a saccade (as described in the text). “Component Effects” are those occurring at either the receptive field (RF) or future field (FF). “Combined Effects” are those occurring at both the RF and FF in individual neurons. Layer IV neurons (top 3 rows) showed only component effects, but Layer V neurons (bottom row) often showed combined effects, the most common of which was full remapping (final column). put. exc., putative excitatory; put. inh., putative inhibitory; ambig., ambiguous.
Second, for each neuron, we examined whether there was a significant increase in visual responsiveness at the FF. We analyzed data as organized in Fig. 10: responses to probes flashed at the FF just before a saccade vs. activity in time-matched, no-probe trials. Other details of this neuron-by-neuron analysis are provided in materials and methods (Task-related activity section). The example neuron of Fig. 10C had significantly greater activity in probe trials (101 sp/s) than in no-probe trials (28 sp/s; P < 0.0001). The same result was found for all four of the ambiguous neurons, significantly more often than in the rest of the neurons (one of 15 inhibitory plus excitatory neurons; Fisher exact test, P = 0.001).
The above neuron-by-neuron analyses focused on increases in visual responses before a saccade. Presaccadic decreases in visual responses were rare. They occurred in only two neurons at the RF (one putative excitatory and one putative inhibitory neuron). No ambiguous neurons showed such a decrease (the one illustrated in Fig. 8C had visual responses of 213 sp/s during fixation and 191 sp/s just before the saccade; not significantly different; Mann-Whitney rank sum test, P = 0.19). At the FF, a presaccadic decrease in visual response occurred in only one neuron (putative inhibitory). No neurons showed altered visual responses just before a saccade at both the RF and FF, let alone the specific combination that defines full remapping (lowered activity at the RF plus elevated activity at the FF). In short, the FEF layer IV neurons carried only the components of remapping, and these components were distributed according to neuron type.
Layer V neurons.
For comparison, we studied 52 layer V neurons using the same remapping task and analytical methods as for the layer IV neurons (Table 1). FEF layer V neurons carry heterogeneous signals (Sommer and Wurtz 2000), but here, we considered only those with a visual response. We found that individual layer V neurons commonly showed a decrease in visual responsiveness at the RF just before a saccade (Fig. 11), and this was significant in the population. Moreover, individual neurons commonly showed an increase at the FF just before a saccade (Fig. 11), also significant in the population. Eleven of the neurons showed both decreased activity at the RF and increased activity at the FF, i.e., full remapping, a prevalence significantly greater than in layer IV neurons (11 of 52 vs. zero of 19; Fisher exact test, P = 0.030).
Fig. 11.
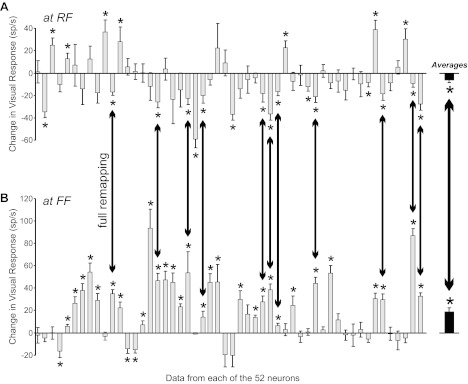
Summary of presaccadic remapping effects found in FEF layer V. Gray bars summarize the changes in visual response for 52 layer V neurons (means and SEs). The ordering of the neuronal data along the x-axis is arbitrary. *P < 0.05 significant change. (Right) Black bars show overall average (population) data for layer V. A: for the RF, we compared responses to probes flashed just before the saccade vs. during initial fixation, as in Fig. 9. The prevalent change was a decrease in visual response just before the saccade, and this decrease was significant in the population. B: for the FF, we compared saccade-aligned responses when a probe was flashed vs. when no probe appeared, as in Fig. 10. The prevalent change was an increase in activity, and this increase was significant in the population. Double-headed arrows emphasize the co-occurrence in 11 individual neurons and in the population of a decreased response at the RF and an increased response at the FF, i.e., full, bimodal remapping.
DISCUSSION
We studied the microcircuitry of presaccadic remapping by identifying layer IV and V neurons in FEF and sorting the layer IV neurons by putative class (excitatory, inhibitory, and ambiguous). In layer IV, only partial remapping was found: presaccadic changes in visual responses occurred at the RF for putative excitatory neurons, at the FF for ambiguous neurons, and were absent for putative inhibitory neurons. In layer V, however, full remapping was prevalent. The results support a hypothesis that intrinsic FEF circuits transform visual and corollary discharge inputs into a fully remapped response.
The Putative Excitatory and Inhibitory Neurons
Our classification of layer IV cell types yielded distinct subsets of putative excitatory and inhibitory neurons. Because these cell types were expected on the basis of prior work and were well segregated in our data, we discuss them first (ambiguous neurons are discussed in the next section). In our presaccadic remapping task, the defining characteristic of putative excitatory neurons was an increase in visual response at the RF but no change at the FF, an effect that is essentially “anti-remapping”. To our knowledge, such an activity pattern was not reported in prior studies of presaccadic remapping. The effect is similar to saccade-related enhancement of visual responses (Goldberg and Bushnell 1981; Wurtz and Mohler 1976), but such enhancement effects occur only for saccades made to stimuli in the RF. For our neurons, the elevated visual activity occurred for saccades made away from the visual stimulus, so the effect we described seems to be novel.
Putative inhibitory neurons showed few changes in visual response individually and no common aggregate change as a group. These neurons likely consisted of parvalbumin-expressing, fast-spiking (FS) interneurons, which have the narrowest action potentials and lowest threshold for spiking of all cortical neurons (Connors and Gutnick 1990; Kawaguchi 1993; McCormick et al. 1985; Nowak et al. 2003). Their lack of modulation during remapping was predicted by a model presented by Quaia et al. (1998), who posited that the main role of inhibitory interneurons during remapping is to shunt current in the dendrites of excitatory neurons. Corollary discharge would not change the activity of inhibitory neurons but would blunt their shunting effect, thus disinhibiting excitatory neurons to produce remapping at the FF. Whereas our data fail to support the specific proposition that excitatory neurons exhibit remapping at the FF, the model could be updated so that disinhibition from FS inhibitory interneurons affects excitatory neurons at the RF and ambiguous interneurons at the FF. Other models of presaccadic remapping did not distinguish between the potential roles of inhibitory and excitatory neurons (Keith et al. 2010; Keith and Crawford 2008; Zirnsak et al. 2010), so it is difficult to relate our work to those models.
A previous study in the FEF also provided evidence that its putative excitatory and inhibitory neurons have differing functions (Cohen et al. 2009). The investigators used a memory-guided saccade task to classify neurons into visual, visuomovement, and movement categories (as in our Fig. 7). They concluded that movement neurons had the broadest action potentials (putative excitatory) and visuomovement neurons the narrowest (putative inhibitory). Similarly, we found that movement neurons occurred only in the putative excitatory subset and that visuomovement neurons were predominantly in the putative inhibitory subset (as well as in the ambiguous subset; Fig. 7B). These similarities between the studies are reassuring, we think, considering the methodological differences; e.g., Cohen et al. (2009) used a single-width measurement (trough-to-peak; width 4 for us) and recorded from the general population of neurons (not specific layers). Cohen et al. (2009) did not test their neurons with a remapping task.
A microcircuit model of the FEF, which included excitatory and inhibitory neurons in six layers, was proposed by Heinzle et al. (2007). The results predicted that during a memory-guided saccade task, both excitatory and inhibitory neurons should carry a visual response, but only inhibitory neurons should have delay activity and a presaccadic burst (their Fig. 5). As discussed below, it is likely that our ambiguous neurons were inhibitory. If they are, then our data agree well with the predictions of Heinzle et al. (2007) in that we found visual responses in all cell types, delay activity only in inhibitory neurons (the ambiguous neuron subtype), and presaccadic activity that was stronger and better synchronized with saccade initiation in inhibitory neurons than in excitatory neurons.
The Ambiguous Neurons
The ambiguous neurons are difficult to interpret due to their small sample size, yet they are important to discuss because they consistently showed remapped visual responses at the FF. We speculate that they were a specific type of non-FS inhibitory interneuron, based on results from in vitro studies of rodent neocortex. First, the reason we think that ambiguous neurons were inhibitory rather than excitatory is because of their functional homogeneity; all of them were visuomovement neurons, and all showed remapping at the FF. Coupling of identical inhibitory interneuron subtypes via gap junctions is common, especially in layer IV (Tamas et al. 2000), and this seems to promote signal homogeneity and synchrony (Galarreta and Hestrin 1999; Gibson et al. 1999). Second, the reason we think they were not FS interneurons is because of their action-potential widths, which were distinctly broader than the widths of our putative inhibitory neurons. One recently characterized type of inhibitory interneuron, known as “low-threshold spiking” (LTS) (Beierlein et al. 2000, 2003; Gibson et al. 1999), was shown to have action-potential widths that are broader than the action-potential widths of FS interneurons (Bacci et al. 2003; Beierlein et al. 2003; Gibson et al. 1999; Tan et al. 2008) and are phenotypically distinct from FS interneurons in not expressing parvalbumin. Third, whereas it is possible that other interneurons also have broader action potentials than FS interneurons, a striking characteristic of ambiguous neurons was delay activity, which is consistent with biophysical properties of LTS interneurons. In response to thalamocortical inputs, LTS interneurons are late to reach spike threshold, but once they start firing, they keep firing (Beierlein et al. 2003; Tan et al. 2008). If the frequency of thalamic input is increased, LTS interneurons exhibit a proportionately increasing, sustained membrane depolarization due to calcium ion channels (Tan et al. 2008) that could facilitate delay activity in the form of spiking.
Fewer in vitro studies of monkey neocortex have been performed, but one by Krimer et al. (2005) is relevant. They examined neurons in slices of dorsolateral prefrontal cortex, a region near FEF, in M. fascicularis. Applying cluster analysis based on 12 physiological measures to layer II–III neurons, they found that action-potential width was the most discriminating parameter. Their analysis yielded three clusters including “intermediate spiking” (IS) neurons having action-potential widths between those of pyramidal cells and FS interneurons. The IS neurons were entirely inhibitory and had diverse firing patterns. Some showed prominent depolarizations similar to those found in rodent LTS neurons, whereas others had firing patterns with no obvious parallel in rodents (Krimer et al. 2005). Their data support our interpretation of ambiguous neurons as a dissociable category of inhibitory interneurons that may include LTS (or LTS-like) cells.
Regardless of their phenotypic identity, our ambiguous neurons were functionally unique, which has a notable implication for studies of microcircuitry in behaving primates. It is common in such studies to find overlap between distributions of parameters that distinguish putative inhibitory and excitatory neurons [e.g., Fig. 3 of Constantinidis and Goldman-Rakic (2002); Fig. 8 of Ding and Gold (2012); Fig. 11 of Song and McPeek (2010)]. Neurons in the overlap regions are usually folded into the excitatory or inhibitory categories, but our results emphasize that it may be worthwhile to analyze them explicitly.
Issues of Methodology
Our results depended on two central methods that should be considered thoroughly. First, we identified the laminar location of FEF neurons, layer IV vs. layer V, using classic physiological techniques (Lemon 1984; Lipski 1981). Antidromic activation of FEF neurons from the SC is straightforward (Everling and Munoz 2000; Segraves and Goldberg 1987; Segraves and Park 1993; Sommer and Wurtz 2000, 2001). Orthodromic activation of FEF neurons from the SC requires more care in interpretation, because in principle, it could occur through routes other than the thalamic-mediated, layer IV-terminating pathway (e.g., via collaterals of FEF output neurons). As discussed in detail previously, however (Sommer and Wurtz 1998, 2004a; Wurtz et al. 2005), activation through unexpected routes is unlikely, based on multiple lines of evidence from our work and the results of similar studies in which orthodromic activation of cortical neurons was independent of collateral routes that could be bypassed [retina-lateral geniculate nucleus-primary visual cortex (V1) pathway; e.g., Bullier and Henry (1979); Ferster and Lindström (1983); Singer et al. (1975)] or was absent [cerebellar-thalamic-primary motor cortex pathway; e.g., Holdefer et al. (2000); Sasaki et al. (1972, 1979)].
The second central method was to discriminate excitatory, inhibitory, and ambiguous cell types. Our approach was founded on methods established in many prior studies, and we improved on the usual “single-width” measurements of those studies by incorporating into our analytical design all of the action-potential width measures used by previous investigators to obtain a consensus result. Classification reliability was enhanced further by referencing our data to a calibration set of known excitatory neurons, an extra step that seems critical (Vigneswaran et al. 2011) but is rarely performed. Even so, all categorizations of in vivo recording data are inferences based on in vitro studies. Perfect identification of neuron types in behaving monkeys may not be possible until genetic techniques (e.g., optogenetic methods) advance sufficiently to endow recorded neurons with clear indicators of phenotype. Progress has been made on this front (Cardin 2012; Fenno et al. 2011), but the methods are not yet applicable to behaving monkey studies.
Assembling Full Remapping from the Parts in Layer IV
We showed that FEF layer IV contains only the components of remapping (at the RF or FF), but layer V contains full remapping (at the RF and FF). How might remapping be assembled in between? The FEF may not do it alone, given that it is but one node in a network of brain areas. Yet, an explanation based on local circuits in FEF is plausible. Figure 12 illustrates the known principles of local circuit connectivity in cerebral cortex. Layer IV excitatory neurons are known to project to layer II/III, and neurons in that layer project to layer V [for review, see Douglas and Martin (2004)]. We assume that layer II/III may effect sign reversal. For thalamic-recipient layer IV excitatory neurons, the signals relayed and inverted by layer II/III would continue to layer V as a decreased RF visual response just before a saccade. If the thalamic-recipient layer IV ambiguous neurons are LTS (or LTS-like) inhibitory interneurons, their projections would be local. They could pause the activity of neighboring excitatory neurons, which in turn, project to a layer II/III inversion network. Hence, layer II/III efferents to layer V would have an increased FF visual response just before a saccade. The end result would be RF and FF visual responses of the correct signs in layer V.
Fig. 12.
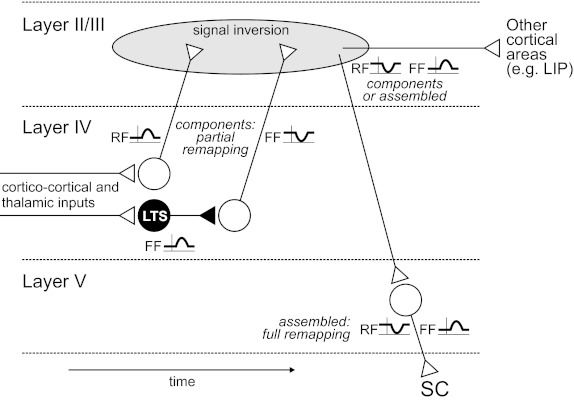
Possible microcircuit for the assembly of presaccadic remapping. The schematic depicts progression from partial to full remapping across layers of the FEF and over time [after Douglas and Martin (2004)]. Corticortical visual input and thalamocortical corollary discharge lead to partial remapping at the RF or FF in layer IV recipient neurons. The recipient neurons show only increasing modulations, because inputs from distant cortex and thalamus are glutamatergic. The thalamic-recipient excitatory layer IV neurons convey a RF increase signal directly to layer II/III. The thalamic-recipient ambiguous [presumed low-threshold spiking (LTS)] interneurons project locally to inhibit excitatory neurons, which in turn, project to layer II/III, conveying a FF decrease signal. These RF and FF components are inverted in a layer II/III network and sent, as components or assembled, down to layer V (and possibly to other cortical areas). Single neurons in layer V distribute fully assembled, bimodal remapping signals subcortically, e.g., to the SC. Note, layer IV thalamic-recipient putative inhibitory (fast-spiking) neurons are not illustrated. As addressed in discussion, they may provide a dendritic shunting influence (Quaia et al. 1998) that coordinates the incoming corticocortical and thalamic signals to achieve the RF and FF modulations found, respectively, in layer IV excitatory and presumed LTS inhibitory neurons. LIP, lateral intraparietal cortex.
If microcircuits in the FEF create full remapping, what would this imply about remapping in other brain areas? At one extreme, the FEF could be the sole source of remapping that is relayed around the brain. This simplistic view is unlikely; although the FEF is the only cortical area known to receive corollary discharge (Sommer and Wurtz 2002, 2006)—a necessary signal for remapping—areas such as LIP may receive corollary discharge as well (Hall and Colby 2011). At the other extreme, remapping could be created de novo in every cortical area. Partial remapping and full remapping are both found in LIP [Table 1 in Kusunoki and Goldberg (2003)], and a broad variety of remapping signals is found in area V3A (Nakamura and Colby 2002). Data on the timing of remapping have not provided clear answers regarding precedence. In studies using comparable methods, mean latencies of remapping relative to saccade initiation were 24 ms in FEF (Sommer and Wurtz 2006), ∼66 ms in LIP (Heiser et al. 2005), 25 ms in area V3A, 46 ms in V3, 78 ms in V2, and 103 ms in V1 (Nakamura and Colby 2002). We need more information on the intracortical distribution of remapping signals within brain areas and on the flow of remapping signals between areas.
In one circuit—the FEF–SC loop—we know something about the flow of remapping signals. The FEF layer V neurons, which we studied, project to the intermediate layers of the SC (Segraves and Goldberg 1987; Sommer and Wurtz 2000), where some neurons also exhibit presaccadic remapping (Churan et al. 2011; Dunn et al. 2010; Walker et al. 1995). Despite this direct connection, remapping in the SC differs from that in the FEF in at least two ways. In the SC, RF responses are unchanged before a saccade (Churan et al. 2011), and FF responses are transiently suppressed during saccades (Walker et al. 1995). In the FEF, in contrast, RF responses decrease before a saccade (Fig. 11), and FF responses are continuous through saccades (Sommer and Wurtz 2006; Umeno and Goldberg 1997, 2001). Hence, remapping signals from FEF are conveyed to the SC but do not seem to govern remapping there. In the reciprocal direction, the SC may transmit remapped visual responses to FEF layer IV (this is unknown), but if so, the transmitted responses would seem to influence only the ambiguous neurons. Our knowledge of the FEF–SC circuit therefore suggests that remapping signals are conveyed between areas but may be filtered or modified at the destination, perhaps to serve particular functional roles.
We are only beginning to understand the microcircuitry of the FEF, and a compelling next step would be to determine the specific intracortical targets of neurons residing in FEF layer IV, particularly its excitatory neurons and LTS (or LTS-like) inhibitory interneurons. Such a fine level of circuit analysis will require refinements of in vivo methods for behaving monkey neurophysiology. The present study provides new motivation for developing such advances through its demonstration that at least one higher-level function—presaccadic remapping—occurs in pieces at the input layer of a frontal cortical region and whole at the output layer.
GRANTS
Support for this work was provided by the National Eye Institute Grant EY017592 and an Alfred P. Sloan Research Fellowship, both to M. A. Sommer.
DISCLOSURES
The authors declare no potential conflicts of interest, financial or otherwise.
AUTHOR CONTRIBUTIONS
Author contributions: M.A.S. conception and design of research; M.A.S. performed experiments; S.S. and M.A.S. analyzed data; S.S. and M.A.S. interpreted results of experiments; S.S. and M.A.S. prepared figures; S.S. and M.A.S. drafted manuscript; S.S. and M.A.S. edited and revised manuscript; S.S. and M.A.S. approved final version of manuscript.
ACKNOWLEDGMENTS
We thank Serena M. Dudek and Erika E. Fanselow for helpful discussions, Robert H. Wurtz for advice and support, and David C. Lee for assistance with programming and analysis.
REFERENCES
- Bacci A, Rudolph U, Huguenard JR, Prince DA. Major differences in inhibitory synaptic transmission onto two neocortical interneuron subclasses. J Neurosci 23: 9664–9674, 2003 [DOI] [PMC free article] [PubMed] [Google Scholar]
- Bartho P, Hirase H, Monconduit L, Zugaro M, Harris KD, Buzsaki G. Characterization of neocortical principal cells and interneurons by network interactions and extracellular features. J Neurophysiol 92: 600–608, 2004 [DOI] [PubMed] [Google Scholar]
- Beierlein M, Gibson JR, Connors BW. A network of electrically coupled interneurons drives synchronized inhibition in neocortex. Nat Neurosci 3: 904–910, 2000 [DOI] [PubMed] [Google Scholar]
- Beierlein M, Gibson JR, Connors BW. Two dynamically distinct inhibitory networks in layer 4 of the neocortex. J Neurophysiol 90: 2987–3000, 2003 [DOI] [PubMed] [Google Scholar]
- Benevento LA, Fallon JH. The ascending projections of the superior colliculus in the rhesus monkey (Macaca mulatta). J Comp Neurol 160: 339–361, 1975 [DOI] [PubMed] [Google Scholar]
- Bruce CJ, Goldberg ME. Primate frontal eye fields. I. Single neurons discharging before saccades. J Neurophysiol 53: 603–635, 1985 [DOI] [PubMed] [Google Scholar]
- Bruno RM, Simons DJ. Feedforward mechanisms of excitatory and inhibitory cortical receptive fields. J Neurosci 22: 10966–10975, 2002 [DOI] [PMC free article] [PubMed] [Google Scholar]
- Bullier J, Henry GH. Ordinal position of neurons in cat striate cortex. J Neurophysiol 42: 1251–1263, 1979 [DOI] [PubMed] [Google Scholar]
- Cardin JA. Dissecting local circuits in vivo: integrated optogenetic and electrophysiology approaches for exploring inhibitory regulation of cortical activity. J Physiol Paris 106: 104–111, 2012 [DOI] [PMC free article] [PubMed] [Google Scholar]
- Cavanagh P, Hunt AR, Afraz A, Rolfs M. Visual stability based on remapping of attention pointers. Trends Cogn Sci 14: 147–153, 2010 [DOI] [PMC free article] [PubMed] [Google Scholar]
- Chen Y, Martinez-Conde S, Macknik SL, Bereshpolova Y, Swadlow HA, Alonso JM. Task difficulty modulates the activity of specific neuronal populations in primary visual cortex. Nat Neurosci 11: 974–982, 2008 [DOI] [PMC free article] [PubMed] [Google Scholar]
- Churan J, Guitton D, Pack CC. Context dependence of receptive field remapping in superior colliculus. J Neurophysiol 106: 1862–1874, 2011 [DOI] [PubMed] [Google Scholar]
- Cohen JY, Pouget P, Heitz RP, Woodman GF, Schall JD. Biophysical support for functionally distinct cell types in the frontal eye field. J Neurophysiol 101: 912–916, 2009 [DOI] [PMC free article] [PubMed] [Google Scholar]
- Connors BW, Gutnick MJ. Intrinsic firing patterns of diverse neocortical neurons. Trends Neurosci 13: 99–104, 1990 [DOI] [PubMed] [Google Scholar]
- Constantinidis C, Goldman-Rakic PS. Correlated discharges among putative pyramidal neurons and interneurons in the primate prefrontal cortex. J Neurophysiol 88: 3487–3497, 2002 [DOI] [PubMed] [Google Scholar]
- Crapse TB, Sommer MA. Frontal eye field neurons assess visual stability across saccades. J Neurosci 32: 2835–2845, 2012 [DOI] [PMC free article] [PubMed] [Google Scholar]
- Crapse TB, Sommer MA. The frontal eye field as a prediction map. Prog Brain Res 171: 383–390, 2008 [DOI] [PMC free article] [PubMed] [Google Scholar]
- Ding L, Gold JI. Neuronal correlates of perceptual decision making before, during, and after decision commitment in monkey frontal eye field. Cereb Cortex 22: 1052–1067, 2012 [DOI] [PMC free article] [PubMed] [Google Scholar]
- Douglas RJ, Martin KAC. Neuronal circuits of the neocortex. Annu Rev Neurosci 27: 419–451, 2004 [DOI] [PubMed] [Google Scholar]
- Duhamel JR, Colby CL, Goldberg ME. The updating of the representation of visual space in parietal cortex by intended eye movements. Science 255: 90–92, 1992 [DOI] [PubMed] [Google Scholar]
- Dunn CA, Hall NJ, Colby CL. Spatial updating in monkey superior colliculus in the absence of the forebrain commissures: dissociation between superficial and intermediate layers. J Neurophysiol 104: 1267–1285, 2010 [DOI] [PMC free article] [PubMed] [Google Scholar]
- Everling S, Munoz DP. Neuronal correlates for preparatory set associated with pro-saccades and anti-saccades in the primate frontal eye field. J Neurosci 20: 387–400, 2000 [DOI] [PMC free article] [PubMed] [Google Scholar]
- Fenno L, Yizhar O, Deisseroth K. The development and application of optogenetics. Annu Rev Neurosci 34: 389–412, 2011 [DOI] [PMC free article] [PubMed] [Google Scholar]
- Ferraina S, Paré M, Wurtz RH. Comparison of cortico-cortical and cortico-collicular signals for the generation of saccadic eye movements. J Neurophysiol 87: 845–858, 2002 [DOI] [PubMed] [Google Scholar]
- Ferster D, Lindström S. An intracellular analysis of geniculo-cortical connectivity in area 17 of the cat. J Physiol 342: 181–215, 1983 [DOI] [PMC free article] [PubMed] [Google Scholar]
- Frank LM, Brown EN, Wilson MA. A comparison of the firing properties of putative excitatory and inhibitory neurons from CA1 and the entorhinal cortex. J Neurophysiol 86: 2029–2040, 2001 [DOI] [PubMed] [Google Scholar]
- Fries W. Cortical projections to the superior colliculus in the macaque monkey: a retrograde study using horseradish peroxidase. J Comp Neurol 230: 55–76, 1984 [DOI] [PubMed] [Google Scholar]
- Galarreta M, Hestrin S. A network of fast-spiking cells in the neocortex connected by electrical synapses. Nature 402: 72–75, 1999 [DOI] [PubMed] [Google Scholar]
- Gibson JR, Beierlein M, Connors BW. Two networks of electrically coupled inhibitory neurons in neocortex. Nature 402: 75–79, 1999 [DOI] [PubMed] [Google Scholar]
- Giguere M, Goldman-Rakic PS. Mediodorsal nucleus: areal, laminar, and tangential distribution of afferents and efferents in the frontal lobe of rhesus monkeys. J Comp Neurol 277: 195–213, 1988 [DOI] [PubMed] [Google Scholar]
- Goldberg ME, Bushnell MC. Behavioral enhancement of visual responses in monkey cerebral cortex. II. Modulation in frontal eye fields specifically related to saccades. J Neurophysiol 46: 773–787, 1981 [DOI] [PubMed] [Google Scholar]
- Goldman-Rakic PS, Porrino LJ. The primate mediodorsal (MD) nucleus and its projection to the frontal lobe. J Comp Neurol 242: 535–560, 1985 [DOI] [PubMed] [Google Scholar]
- Gonzalez-Burgos G, Krimer LS, Povysheva NV, Barrionuevo G, Lewis DA. Functional properties of fast spiking interneurons and their synaptic connections with pyramidal cells in primate dorsolateral prefrontal cortex. J Neurophysiol 93: 942–953, 2005 [DOI] [PubMed] [Google Scholar]
- Hall NJ, Colby CL. Remapping for visual stability. Philos Trans R Soc Lond B Biol Sci 366: 528–539, 2011 [DOI] [PMC free article] [PubMed] [Google Scholar]
- Hays AV, Richmond BJ, Optican BJ. A UNIX-based multiple process system for real-time data acquisition and control. WESCON Conf Proc 2: 1–10, 1982 [Google Scholar]
- Heinzle J, Hepp K, Martin KAC. A microcircuit model of the frontal eye fields. J Neurosci 27: 9341–9353, 2007 [DOI] [PMC free article] [PubMed] [Google Scholar]
- Heiser LM, Berman RA, Saunders RC, Colby CL. Dynamic circuitry for updating spatial representations. II. Physiological evidence for interhemispheric transfer in area LIP of the split-brain macaque. J Neurophysiol 94: 3249–3258, 2005 [DOI] [PubMed] [Google Scholar]
- Holdefer RN, Miller LE, Chen LL, Houk JC. Functional connectivity between cerebellum and primary motor cortex in the awake monkey. J Neurophysiol 84: 585–590, 2000 [DOI] [PubMed] [Google Scholar]
- Johnson JL, Welsh JP. Independently movable multielectrode array to record multiple fast-spiking neurons in the cerebral cortex during cognition. Methods 30: 64–78, 2003 [DOI] [PubMed] [Google Scholar]
- Johnston K, DeSouza JF, Everling S. Monkey prefrontal cortical pyramidal and putative interneurons exhibit differential patterns of activity between prosaccade and antisaccade tasks. J Neurosci 29: 5516–5524, 2009 [DOI] [PMC free article] [PubMed] [Google Scholar]
- Kawaguchi Y. Groupings of nonpyramidal and pyramidal cells with specific physiological and morphological characteristics in rat frontal cortex. J Neurophysiol 69: 416–431, 1993 [DOI] [PubMed] [Google Scholar]
- Keith GP, Blohm G, Crawford JD. Influence of saccade efference copy on the spatiotemporal properties of remapping: a neural network study. J Neurophysiol 103: 117–139, 2010 [DOI] [PubMed] [Google Scholar]
- Keith GP, Crawford JD. Saccade-related remapping of target representations between topographic maps: a neural network study. J Comput Neurosci 24: 157–178, 2008 [DOI] [PubMed] [Google Scholar]
- Klier EM, Angelaki DE. Spatial updating and the maintenance of visual constancy. Neuroscience 156: 801–818, 2008 [DOI] [PMC free article] [PubMed] [Google Scholar]
- Krimer LS, Zaitsev AV, Czanner G, Kröner S, González-Burgos G, Povysheva NV, Iyengar S, Barrionuevo G, Lewis DA. Cluster analysis-based physiological classification and morphological properties of inhibitory neurons in layers 2–3 of monkey dorsolateral prefrontal cortex. J Neurophysiol 94: 3009–3022, 2005 [DOI] [PubMed] [Google Scholar]
- Kusunoki M, Goldberg ME. The time course of perisaccadic receptive field shifts in the lateral intraparietal area of the monkey. J Neurophysiol 89: 1519–1527, 2003 [DOI] [PubMed] [Google Scholar]
- Leichnetz GR, Spencer RF, Hardy SG, Astruc J. The prefrontal corticotectal projection in the monkey; an anterograde and retrograde horseradish peroxidase study. Neuroscience 6: 1023–1041, 1981 [DOI] [PubMed] [Google Scholar]
- Lemon R. Methods for Neuronal Recording in Conscious Animals. New York: Wiley, 1984 [Google Scholar]
- Lipski J. Antidromic activation of neurones as an analytic tool in the study of the central nervous system. J Neurosci Methods 4: 1–32, 1981 [DOI] [PubMed] [Google Scholar]
- Mays LE, Sparks DL. Dissociation of visual and saccade-related responses in superior colliculus neurons. J Neurophysiol 43: 207–232, 1980 [DOI] [PubMed] [Google Scholar]
- McCormick DA, Connors BW, Lighthall JW, Prince DA. Comparative electrophysiology of pyramidal and sparsely spiny stellate neurons of the neocortex. J Neurophysiol 54: 782–806, 1985 [DOI] [PubMed] [Google Scholar]
- Merriam EP, Colby CL. Active vision in parietal and extrastriate cortex. Neuroscientist 11: 484–493, 2005 [DOI] [PubMed] [Google Scholar]
- Mitchell JF, Sundberg KA, Reynolds JH. Differential attention-dependent response modulation across cell classes in macaque visual area V4. Neuron 55: 131–141, 2007 [DOI] [PubMed] [Google Scholar]
- Nakamura K, Colby CL. Updating of the visual representation in monkey striate and extrastriate cortex during saccades. Proc Natl Acad Sci USA 99: 4026–4031, 2002 [DOI] [PMC free article] [PubMed] [Google Scholar]
- Nowak LG, Azouz R, Sanchez-Vives MV, Gray CM, McCormick DA. Electrophysiological classes of cat primary visual cortical neurons in vivo as revealed by quantitative analyses. J Neurophysiol 89: 1541–1566, 2003 [DOI] [PubMed] [Google Scholar]
- Quaia C, Optican LM, Goldberg ME. The maintenance of spatial accuracy by the perisaccadic remapping of visual receptive fields. Neural Netw 11: 1229–1240, 1998 [DOI] [PubMed] [Google Scholar]
- Rao SG, Williams GV, Goldman-Rakic PS. Isodirectional tuning of adjacent interneurons and pyramidal cells during working memory: evidence for microcolumnar organization in PFC. J Neurophysiol 81: 1903–1916, 1999 [DOI] [PubMed] [Google Scholar]
- Sasaki K, Jinnai K, Gemba H, Hashimoto S, Mizuno N. Projection of the cerebellar dentate nucleus onto the frontal association cortex in monkeys. Exp Brain Res 37: 193–198, 1979 [DOI] [PubMed] [Google Scholar]
- Sasaki K, Kawaguchi S, Matsuda Y, Mizuno N. Electrophysiological studies on cerebello-cerebral projections in the cat. Exp Brain Res 16: 75–88, 1972 [DOI] [PubMed] [Google Scholar]
- Schall JD, Morel A, King DJ, Bullier J. Topography of visual cortex connections with frontal eye field in macaque: convergence and segregation of processing streams. J Neurosci 15: 4464–4487, 1995 [DOI] [PMC free article] [PubMed] [Google Scholar]
- Segraves MA, Goldberg ME. Functional properties of corticotectal neurons in the monkey's frontal eye field. J Neurophysiol 58: 1387–1419, 1987 [DOI] [PubMed] [Google Scholar]
- Segraves MA, Park K. The relationship of monkey frontal eye field activity to saccade dynamics. J Neurophysiol 69: 1880–1889, 1993 [DOI] [PubMed] [Google Scholar]
- Simons DJ. Response properties of vibrissa units in rat SI somatosensory neocortex. J Neurophysiol 41: 798–820, 1978 [DOI] [PubMed] [Google Scholar]
- Singer W, Tretter F, Cynader M. Organization of cat striate cortex: a correlation of receptive-field properties with afferent and efferent connections. J Neurophysiol 38: 1080–1098, 1975 [DOI] [PubMed] [Google Scholar]
- Sommer MA, Wurtz RH. A pathway in primate brain for internal monitoring of movements. Science 296: 1480–1482, 2002 [DOI] [PubMed] [Google Scholar]
- Sommer MA, Wurtz RH. Brain circuits for the internal monitoring of movements. Annu Rev Neurosci 31: 317–338, 2008 [DOI] [PMC free article] [PubMed] [Google Scholar]
- Sommer MA, Wurtz RH. Composition and topographic organization of signals sent from the frontal eye field to the superior colliculus. J Neurophysiol 83: 1979–2001, 2000 [DOI] [PubMed] [Google Scholar]
- Sommer MA, Wurtz RH. Frontal eye field neurons orthodromically activated from the superior colliculus. J Neurophysiol 80: 3331–3335, 1998 [DOI] [PubMed] [Google Scholar]
- Sommer MA, Wurtz RH. Frontal eye field sends delay activity related to movement, memory, and vision to the superior colliculus. J Neurophysiol 85: 1673–1685, 2001 [DOI] [PubMed] [Google Scholar]
- Sommer MA, Wurtz RH. Influence of the thalamus on spatial visual processing in frontal cortex. Nature 444: 374–377, 2006 [DOI] [PubMed] [Google Scholar]
- Sommer MA, Wurtz RH. What the brain stem tells the frontal cortex. I. Oculomotor signals sent from superior colliculus to frontal eye field via mediodorsal thalamus. J Neurophysiol 91: 1381–1402, 2004a [DOI] [PubMed] [Google Scholar]
- Sommer MA, Wurtz RH. What the brain stem tells the frontal cortex. II. Role of the SC-MD-FEF pathway in corollary discharge. J Neurophysiol 91: 1403–1423, 2004b [DOI] [PubMed] [Google Scholar]
- Song JH, McPeek RM. Roles of narrow- and broad-spiking dorsal premotor area neurons in reach target selection and movement production. J Neurophysiol 103: 2124–2138, 2010 [DOI] [PMC free article] [PubMed] [Google Scholar]
- Swadlow HA. Efferent neurons and suspected interneurons in S-1 vibrissa cortex of the awake rabbit: receptive fields and axonal properties. J Neurophysiol 62: 288–308, 1989 [DOI] [PubMed] [Google Scholar]
- Swadlow HA. Fast-spike interneurons and feedforward inhibition in awake sensory neocortex. Cereb Cortex 13: 25–32, 2003 [DOI] [PubMed] [Google Scholar]
- Tamas G, Buhl EH, Lorincz A, Somogyi P. Proximally targeted GABAergic synapses and gap junctions synchronize cortical interneurons. Nat Neurosci 3: 366–371, 2000 [DOI] [PubMed] [Google Scholar]
- Tamura H, Kaneko H, Kawasaki K, Fujita I. Presumed inhibitory neurons in the macaque inferior temporal cortex: visual response properties and functional interactions with adjacent neurons. J Neurophysiol 91: 2782–2796, 2004 [DOI] [PubMed] [Google Scholar]
- Tan Z, Hu H, Huang ZJ, Agmon A. Robust but delayed thalamocortical activation of dendritic-targeting inhibitory interneurons. Proc Natl Acad Sci USA 105: 2187–2192, 2008 [DOI] [PMC free article] [PubMed] [Google Scholar]
- Umeno MM, Goldberg ME. Spatial processing in the monkey frontal eye field. I. Predictive visual responses. J Neurophysiol 78: 1373–1383, 1997 [DOI] [PubMed] [Google Scholar]
- Umeno MM, Goldberg ME. Spatial processing in the monkey frontal eye field. II. Memory responses. J Neurophysiol 86: 2344–52, 2001 [DOI] [PubMed] [Google Scholar]
- Vigneswaran G, Kraskov A, Lemon RN. Large identified pyramidal cells in macaque motor and premotor cortex exhibit “thin spikes”: implications for cell type classification. J Neurosci 31: 14235–14242, 2011 [DOI] [PMC free article] [PubMed] [Google Scholar]
- Walker MF, Fitzgibbon EJ, Goldberg ME. Neurons in the monkey superior colliculus predict the visual result of impending saccadic eye movements. J Neurophysiol 73: 1988–2003, 1995 [DOI] [PubMed] [Google Scholar]
- Wurtz RH, Mohler CW. Enhancement of visual responses in monkey striate cortex and frontal eye fields. J Neurophysiol 39: 766–772, 1976 [DOI] [PubMed] [Google Scholar]
- Wurtz RH, Sommer MA, Cavanaugh J. Drivers from the deep: the contribution of collicular input to thalamocortical processing. Prog Brain Res 149: 207–225, 2005 [DOI] [PubMed] [Google Scholar]
- Zirnsak M, Lappe M, Hamker FH. The spatial distribution of receptive field changes in a model of peri-saccadic perception: predictive remapping and shifts towards the saccade target. Vision Res 50: 1328–1337, 2010 [DOI] [PubMed] [Google Scholar]