

Abstract
Transcranial electrical stimulation (tES) is a promising therapeutic tool for a range of neurological diseases. Understanding how the small currents used in tES spread across the scalp and penetrate the brain will be important for the rational design of tES therapies. Alternating currents applied transcranially above visual cortex induce the perception of flashes of light (phosphenes). This makes the visual system a useful model to study tES. One hypothesis is that tES generates phosphenes by direct stimulation of the cortex underneath the transcranial electrode. Here, we provide evidence for the alternative hypothesis that phosphenes are generated in the retina by current spread from the occipital electrode. Building on the existing literature, we first confirm that phosphenes are induced at lower currents when electrodes are placed farther away from visual cortex and closer to the eye. Second, we explain the temporal frequency tuning of phosphenes based on the well-known response properties of primate retinal ganglion cells. Third, we show that there is no difference in the time it takes to evoke phosphenes in the retina or by stimulation above visual cortex. Together, these findings suggest that phosphenes induced by tES over visual cortex originate in the retina. From this, we infer that tES currents spread well beyond the area of stimulation and are unlikely to lead to focal neural activation. Novel stimulation protocols that optimize current distributions are needed to overcome these limitations of tES.
Keywords: transcranial electrical stimulation, phosphenes, retinal ganglion cells, transcranial alternating current stimulation, visual latency
transcranial electrical stimulation (tES) is a promising therapeutic tool in clinical trials involving posttraumatic stress, stroke recovery, depression, and many other neurological diseases (http://clinicaltrials.gov). Although the acute effects of electrical fields in vitro are relatively well-understood (Reato et al. 2010), we have limited understanding how transcranial currents interact with neuronal dynamics in the intact brain. Kanai et al. (2008) argued that tES directly modulates neural activity underneath a stimulating electrode. They applied transcranial alternating current stimulation (tACS) over visual cortex and found that subjects reported seeing flashes of light (phosphenes). The subjective strength of these phosphenes depended on the temporal frequency of tACS and the light-adapted state of the subject. Specifically, phosphenes were strongest for tACS at 10 Hz dark but 20 Hz light. Kanai et al. (2008) interpreted this as showing that tACS could entrain the dominant brain oscillations in the dark (α) or the light (β).
Although this is an intriguing hypothesis, a number of objections have been raised to this interpretation (Schwiedrzik 2009). First, there is convincing evidence that phosphenes can be induced by electrical stimulation of the retina. Brindley (1955) passed alternating current (0.03–0.7 mA) through bipolar electrodes placed directly on the conjunctiva, which reliably evoked the perception of phosphenes. Pressure blinding of the eye caused temporary blindness to both visual stimuli and electrically induced phosphenes. Brindley (1955) concluded that voltage changes induced directly in the photoreceptors were the most likely explanation of these phosphenes. Schutter and Hortensius (2010) proposed that the supposed cortically evoked phosphenes reported by Kanai et al. (2008) could be due to volume conduction from the occipital electrode to the retina, evident in the voltage changes measured near the eye. Paulus (2010) has argued that those voltage changes were too small to evoke phosphenes.
Resolving this long-standing debate (Rohracher 1935) and determining the origin of tES phosphenes has considerable implications for the ability of tES to modulate specific brain areas (or rhythms) in clinical and basic research. The cortical entrainment hypothesis claims that neural activity below a tES electrode can be modulated relatively easily. The retinal hypothesis, on the other hand, claims that although it is indeed easy to generate phosphenes with tES, these phosphenes do not result from the direct modulation of neural activity below the electrode.
We combined experimental and computational methods to investigate the origin of tES-induced phosphenes. We first use a novel paradigm to confirm that current thresholds for phosphenes decrease when electrodes are placed away from visual cortex and closer to the eye. This is expected for a retinal origin of phosphenes. Second, we show that the frequency tuning of these phosphenes can be understood from the basic response properties of retinal ganglion cells (RGCs; Benardete and Kaplan 1999). Finally, we show that there is no difference in the time it takes to evoke phosphenes by a single current pulse through an electrode near the eye and near visual cortex. This is inconsistent with the cortical hypothesis because phosphenes generated directly in cortex should be faster than retinal phosphenes by the typical response latency of V1 neurons. Taken together, our data strongly support the view that the origin of tES-induced phosphenes is retinal.
MATERIALS AND METHODS
Subjects.
Six subjects (5 naïve and 1 experimenter; 5 subjects for the phosphene detection task and 4 subjects for the double-pulse detection task) participated in the study. Subjects gave written informed consent, and all had normal or corrected-to-normal vision. This study was conducted according to the principles expressed in the Declaration of Helsinki and approved by the Institutional Review Board of Rutgers University. S-4 is the nonnaïve subject (experimenter K. Kar).
Visual stimuli.
The phosphene detection and the double-pulse detection task were done in a room lit only by the background luminance (0.4 cd/m2) of a monitor (Sony FD Trinitron CRT monitor; resolution of 1,024 × 768 pixels; refresh rate of 120 Hz).
Apparatus.
We used an STG4002 stimulus generator (Multi Channel Systems, Reutlingen, Germany) to deliver the tES. We used saline-soaked sponges attached to conductive rubber as electrodes (3-in. diameter). All events in a trial were synchronized and triggered using in-house software (neurostim; http://neurostim.sourceforge.net). A head-mounted EyeLink II eye tracker system (SR Research, Mississauga, Ontario, Canada) recorded eye movements by tracking the pupils of both eyes at a sampling rate of 500 Hz.
Procedures.
All subjects sat in a dark room at a distance of 57 cm from the center of the monitor. Head movements were restricted by using a chin rest or a bite bar. The subjects indicated their response using the keyboard.
Electrode placement.
We placed the stimulating electrode at three regions of interest: the occipital lobe (Oz), the temporal lobe (T5), and the frontal lobe (Fpz) according to the international 10–20 system of electrode placement. The reference electrode was always at the vertex (Cz). The maximum current density used was 0.02 mA/cm2 (current intensity = 1 mA; electrode surface area = 45.6 cm2).
Phosphene detection task.
This experiment was designed to determine the threshold intensity of stimulation to elicit phosphenes. The stimulation was limited to −0.5 to 0.5 mA of sinusoidal current. We used 8, 10, 15, 20, 30, and 60 Hz as the tES frequencies. The voltage was limited to 20 V. Each trial in the experiment began with a “START” sound followed by two intervals of 1,000 ms separated by a beep. Stimulation was delivered for the full duration of either of the two intervals, and the subjects reported the interval in which they saw phosphenes. We used a Bayesian adaptive threshold estimation algorithm (Kontsevich and Tyler 1999) to select the intensity of tES for each trial and defined threshold as the current at which the subjects' performance reached 75% correct. Subjects performed a minimum of 30 trials per condition (i.e., per montage and frequency).
Double-pulse detection task.
This experiment was designed to estimate the time interval required to perceive two phosphenes when two electrical pulses were applied in succession. Subjects fixated a small dot on an otherwise dark screen. All trials in which the subjects broke fixation from a 2 × 2° window were discarded from the analysis. After a START sound to indicate the beginning of the trial, we applied two 20-ms unipolar electrical pulses and varied the onset time between the pulses (dt) over a range of 20–160 ms. One pulse was applied at the frontal electrode (Fpz), and the other at the occipital electrode (Oz). Catch trials containing only a single pulse were randomly interleaved. To create phosphenes with approximately equal perceived brightness, we adjusted the currents at the Oz and Fpz electrodes. Specifically, we determined the average (across subjects and frequencies) ratio of the threshold currents in experiment 1, chose a suprathreshold current value for Fpz (0.3 mA), and, using the ratio (3.2), calculated 1 mA as the current for the Oz electrode.
We determined subjects' sensitivity (d′) as: d′ = norminv(HIT) − norminv(FA) where the hit rate (HIT) is the fraction of trials in which the subject reported perceiving both of the two applied pulses, and the false alarm rate (FA) is the fraction of trials in which one pulse was applied but the subject reported perceiving two pulses. Norminv(.) denotes the inverse of the cumulative normal distribution. We fitted a straight line to d′ as a function of dt and estimated the threshold delay as the delay required to achieve a d′ of 1.5.
To test whether threshold delays were significantly different in the two conditions, we performed a permutation test of the null hypothesis that the Oz-Fpz and Fpz-Oz data belonged to the same distribution (Efron and Tibshirani 1994). In this procedure, we combined the responses from all Fpz-Oz and Oz-Fpz trials, drew (with replacement) two complete data sets from this distribution, and determined the difference in threshold delays. We repeated this resampling process 1,000 times to obtain a null distribution of threshold delay differences. We then determined the P value of the test as the fraction of values in the null distribution that were larger than the actual difference in threshold delay between the Fpz-Oz and Oz-Fpz experimental data (Efron and Tibshirani 1994).
Because the retinal hypothesis predicts that the threshold delays are not different, we wanted to be sure that our test had sufficient power to detect differences in delays if they existed. Therefore, we determined the power of the permutation test. The power is defined as one minus the probability that the test failed to detect a significant difference if the cortical hypothesis were correct. Specifically, we calculated the probability that the observed latency differences could come from a distribution of latency differences with a mean equal to the expected effect size under the cortical hypothesis (2 × ΔV1 = 120 ms) and a standard deviation given by the error in our estimate of the threshold. We determined the latter by bootstrap resampling (n = 1,000) the individual subject data (Efron and Tibshirani 1994). The values of the power for subjects S-3, S-4, S-5, and S-6 were 0.87, 0.86, 0.98, and 0.81, respectively.
RGC model.
To investigate whether known properties of RGCs could quantitatively explain the frequency tuning of phosphene current thresholds, we adapted the linear cascade filter model proposed by Victor (1987). Benardete and Kaplan (1999) estimated the parameters of the model by recording from macaque retinal ganglion M cells (Benardete and Kaplan 1999). In the model, the firing rate of each RGC depends on visual contrast (c) and stimulation frequency .
where A is overall gain per unit contrast (impulses per second per unit contrast), D is initial delay (in milliseconds), Hs is strength of the high-pass filter, τS is time constant of the high-pass stage (in milliseconds), τL is time constant of the low-pass stage (in milliseconds), T0 is time constant of high-pass stage for zero contrast (in milliseconds), C1/2 is contrast at which τS is half of its initial value, and NL is approximate number of low-pass filters.
We supplemented this RGC model with a front end and a back end. The front end modeled the relationship between the stimulation current, I, and the effective visual contrast, c(M) for montage, M, as:
where β is a scaling parameter and δ is the equivalent electrotonic distance between the eyes and the stimulating electrode for M. Note that β and δ were not measured directly; they were estimated from the behavioral responses using an optimization procedure (see below). We furthermore assumed that detection performance was a Weibull function of the RGC firing rate, R (back end).
where P is the predicted fraction correct, g is a Weibull function, and θ and ξ are the threshold and slope of the sigmoid psychometric function, respectively. Note that none of these assumptions about the front or back end of the model introduces frequency tuning; all frequency tuning in the model arises from the properties of the RGCs.
The model predicted the fraction correct for any stimulation current and frequency. Using MATLAB fmincon, we varied the four free model parameters (β, δ, ξ, and θ) and the constrained RGC parameters to obtain the best fit of the complete psychometric function (3 montages, 4 temporal frequencies, and a large number of current intensities, not just the threshold) for each subject. The values of the RGC model parameters were constrained to fall within the range estimated for primate ganglion cells by Benardete and Kaplan (1999). In other words, each model contained RGCs for which properties were within the measured range of macaque ganglion cells.
RESULTS
When stimulated with a weak alternating current through a primary electrode placed on Oz and a reference electrode on Cz, subjects report perceiving a widely distributed peripheral flicker for which temporal frequency varies with stimulation frequency (Brindley 1955; Kanai et al. 2008; Rohracher 1935). The subjective brightness of this flicker increases when the first electrode is placed more anterior. This property of tACS-induced phosphenes has been known for some time (Rohracher 1935) and is inconsistent with the cortical hypothesis but strongly suggests a retinal origin.
Phosphene thresholds.
To measure these phenomena in an objective manner, we used a two-interval, forced-choice task (Fig. 1) and an adaptive method to determine current levels required to evoke phosphenes reliably from electrodes placed over Oz, T5, or Fpz, each with a reference on Cz. Figure 2 shows data from all subjects. The current thresholds decreased for electrodes closer to the eye and therefore further away from the visual cortex. This supports the view that the phosphenes originate in the eye and not from direct stimulation of the cortex.
Fig. 1.
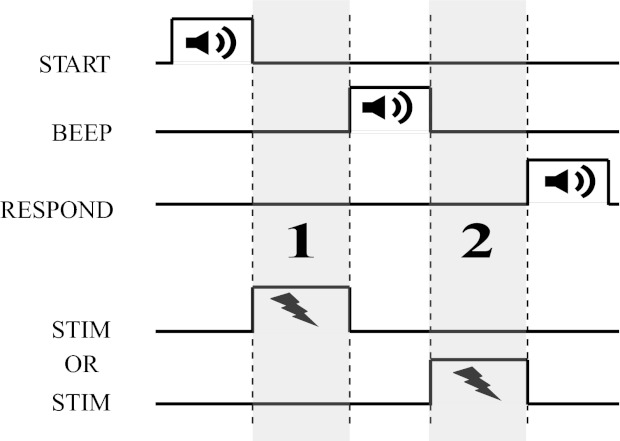
Design of the phosphene detection task. Trials consisted of 2 intervals (1 and 2) separated by a beep; transcranial alternating current stimulation (tACS) was applied in 1 of the 2 intervals. Subjects reported the interval in which they saw phosphenes, and we determined the current level at which the subject's phosphene detection performance reached 75% correct. “STIM” refers to the time of application of transcranial electrical stimulation as indicated by the lightning bolt.
Fig. 2.
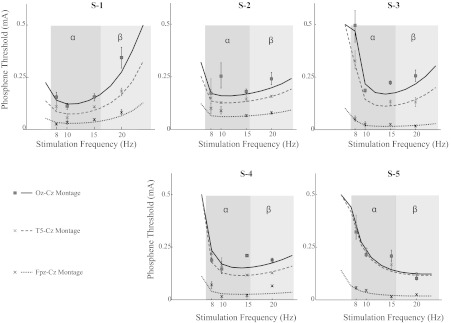
Threshold measurement and frequency tuning. Dependence of phosphene thresholds on stimulation frequency (8–20 Hz) and electrode position for 5 subjects (S-1, S-2, S-3, S-4, and S-5). The α- and β-frequency bands are shaded in dark and light gray, respectively. Consistent with the findings of Kanai et al. (2008), the optimal stimulation frequency for these experiments done in near darkness was typically in the α-range. The box and “x” markers are the estimated thresholds; error bars indicate 95% confidence intervals, and the lines represent the model fit based on the retinal ganglion cell model. The figure shows that current thresholds decreased as the electrode was moved closer to the eye, consistent with a retinal origin. Moreover, it shows that the temporal frequency tuning is consistent with the known properties of primate retinal ganglion cells.
Frequency tuning.
Figure 2 also shows that the phosphene thresholds were tuned for the temporal frequency of stimulation. This feature has previously been attributed to the entrainment of cortical oscillations (Kanai et al. 2008). We investigated whether this temporal frequency tuning could instead be interpreted in terms of retinal response properties. Qualitatively, this interpretation is supported by the fact that RGCs have a temporal frequency tuning with peak sensitivity in the α-range in the dark; see, for instance, Fig. 1 in Benardete and Kaplan (1999). Moreover, the peak sensitivity of RGCs shifts toward the β-frequency band in the light (Purpura et al. 1990), which matches the shift in the optimal stimulation frequency for phosphenes in a lit room (Kanai et al. 2008).
To provide quantitative support for the match between phosphene thresholds and RGC properties, we used a well-established model for RGCs (Victor 1987). This model provides a quantitative description of the relation between visual contrast and the firing rate of RGCs, including their temporal frequency tuning.
We developed a simple, descriptive front end to this model to relate tES current (the independent variable in our study) to the effective visual contrast generated at the retina (the input to the RGC model). Specifically, we assumed that the effective visual contrast decreased with the electrotonic distance between the electrode and the eye. The parameters describing this decrease were estimated from the data. Similarly, we added a descriptive back end to the RGC model that described how firing rate was related to behavioral performance (see materials and methods). The parameters of the front and back end were unconstrained and determined by optimization to produce the best fit to the individual performance curves. The parameters of the RGC model, however, were constrained to lie within the ranges measured in the primate retina (Benardete and Kaplan 1999).
The curves in Fig. 2 show the best fits of the model to the individual subject data (for details, see materials and methods). We could not estimate the thresholds at stimulation frequencies of 30 Hz and higher as they were above the predetermined range of our current stimulation amplitude (0.5 mA); we did not use those data for the model fits. Note however, that this implies that thresholds >30 Hz were at least 0.5 mA, hence all subjects had U-shaped response curves, as expected qualitatively from the RGC properties.
Double-pulse detection task.
When a single 20-ms pulse of 1 mA was applied to Oz, subjects reliably reported seeing a brief flash of peripheral light. On the one hand, this shows that entrainment of cortical oscillations is not necessary to evoke phosphenes from an electrode on the occipital lobe. However, more importantly, it provides us with a tool to determine whether currents injected at the occipital lobe spread to the eye.
A single pulse through a frontal electrode (Fpz) also evokes a phosphene, and it is generally accepted that these phosphenes have a retinal origin (Brindley 1955; Rohracher 1935). We asked whether the phosphene evoked by occipital stimulation could have a direct cortical origin instead. The distinguishing feature we use is that retinal stimulation, unlike direct cortical stimulation, requires some time to reach visual cortex. We call this latency ΔV1, and we estimate it as ∼60 ms based on EEG data (Jeffreys and Axford 1972). In the experiment, we applied one frontal pulse (Fpz) and one occipital pulse (Oz) and asked the subjects to report whether they saw one or two pulses.
To perceive two phosphenes requires a minimum time (δT) between the two corresponding bursts of neural activity in visual cortex. Under the cortical hypothesis, the current pulses in an Fpz-Oz sequence (Fig. 3) would have to be apart by δFO = δT + ΔV1 to create V1 activity separated by δT. In an Oz-Fpz sequence, however, the Oz pulse gets a head start, hence the current pulses would only have to be δOF = δT − ΔV1 apart. Under the retinal hypothesis, there is no difference between the conditions because both phosphenes originate at the retina with negligible time delays due to electrical conduction from Oz to Fpz.
Fig. 3.
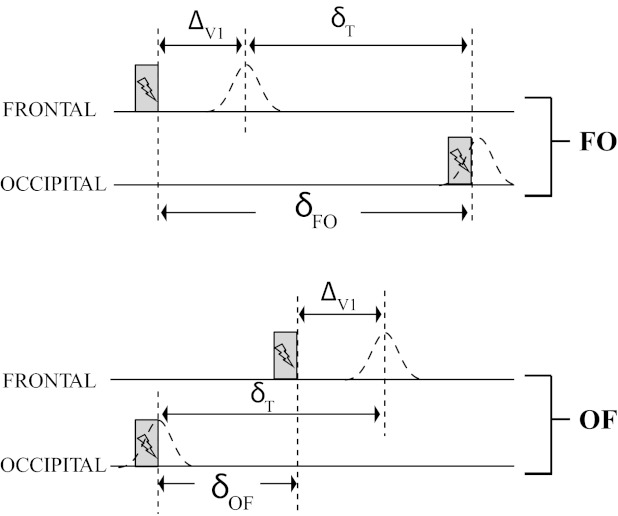
Predictions for the double-pulse detection task based on the hypothesis that occipital stimulation evokes neural activity directly in the underlying cortex. Gray bars represent the stimulation, and dashed curves the activity in V1 under the cortical hypothesis. This figure illustrates why the cortical hypothesis predicts large differences in the time needed to distinguish 2 phosphenes between Oz-Fpz (OF) and Fpz-Oz (FO) stimulation. ΔV1, the time it takes for a stimuli to reach the visual cortex from the retina; δT, the minimum time to perceive 2 consecutive phosphenes. See main text for a full description.
Figure 4 shows the sensitivity to detect two pulses using the signal detection measure d′. As expected, sensitivity to detect two pulses increased with the delay between the pulses. Importantly, sensitivity for Oz-Fpz sequences was indistinguishable from sensitivity for Fpz-Oz sequences. Statistically, none of the subjects had a significant difference between the minimal delay needed to distinguish reliably (d′ = 1.5) two pulses in the Oz-Fpz and Fpz-Oz sequences. This is consistent with the retinal hypothesis. The cortical hypothesis, on the other hand, predicts that these curves should be shifted laterally by 2 × ΔV1 ≈ 120 ms. We used this estimate of the expected effect to determine the statistical power of our test (see materials and methods); the power was >0.8 for each subject. Hence, our data do not allow us to reject the null hypothesis that the phosphenes have the same source, and this is not likely to be due to a lack of power in the statistical analysis. We infer that Oz and Fpz stimulation have the same source. Because Fpz stimulation is generally agreed to have a retinal origin (Brindley 1955; Rohracher 1935), we conclude that Oz stimulation does, too.
Fig. 4.
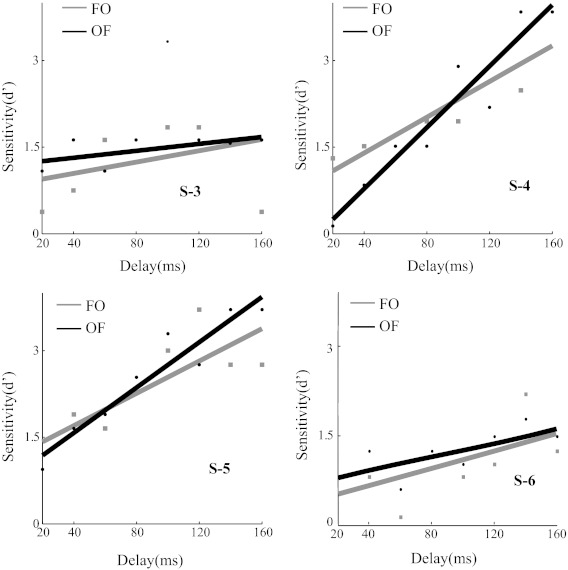
Double-pulse detection sensitivity. Behavioral report for 4 subjects (S-3, S-4, S-5, and S-6) in the double-pulse detection task. The sensitivity (d′) of the subject to detect 2 flashes is shown as a function of the time between the 2 stimulation pulses. The bold lines are lines fitted to the data points. Threshold delay is defined as the delay at which d′ reached 1.5. The threshold delays for OF and FO conditions were statistically indistinguishable for all subjects (permutation test, P > 0.05).
DISCUSSION
We investigated the origins of phosphenes induced by tES. Consistent with the previous literature (Rohracher 1935; Schutter and Hortensius 2010), we found that phosphene thresholds increased with the distance between the electrodes and the eye. Furthermore, we showed that the temporal frequency tuning of current thresholds is consistent with the known properties of RGCs. Finally, we found no difference in the time it takes to elicit a phosphene by stimulating over visual cortex compared with frontal cortex even though a direct cortical effect of electrical stimulation predicts a time difference as large as 120 ms. Taken together, these data strongly argue that tACS-induced phosphenes originate in or before RGCs and are unlikely to be caused by the entrainment of cortical oscillations (Kanai et al. 2008).
We will first discuss the possible mechanisms underlying phosphene generation in the retina and then the implications of our findings for the use of tES in clinical applications and basic research.
Within the retina, several mechanisms could contribute to the generation of phosphenes by the application of electrical fields (Attwell 2003). Clinical observations help to narrow down the likely locus for phosphene generation by tACS. For instance, electrical stimulation of the conjunctiva induces phosphenes even in patients with damaged photoreceptors (retinitis pigmentosa or ablatio retinae), and in these patients the frequency tuning of the phosphene threshold is preserved (Meier-Koll 1973). Frequency tuning is lost, however, in patients whose optic nerve is severed or those in which occluded blood vessels lead to the degeneration of bipolar and ganglion cells (e.g., in retinopathia diabetica; Meier-Koll 1973). Given that models of volume conduction in the human head predict that tES can generate high current densities in the optic nerve, stimulation of the axons of RGCs is a candidate mechanism. However, pressure blinding abolishes phosphenes generated by direct stimulation of the cornea (Brindley 1955). Because pressure blinding is unlikely to affect the optic nerve, Brindley (1955) concluded from this observation that electrical stimulation directly affects the photoreceptors. More recently, it has been shown that direct electrical stimulation of the optic nerve of a blind patient with severe retinitis pigmentosa (Delbeke et al. 2003) resulted in phosphenes without the typical band-pass temporal frequency tuning shown in Fig. 2. Although invasive experiments may be needed to answer this mechanistic question conclusively, these observations strongly suggest that the characteristic frequency tuning found in tES originates before the optic nerve.
Our experiments used objective measures of phosphene detection. This minimized the influence of observer bias and avoided relying on the subjective report of observers' phenomenal experience, which we found to be variable across subjects and somewhat difficult to describe. This ephemeral quality of the phosphenes makes it difficult to compare the effect of electrical stimulation with matched visual stimuli. Informal experiments showed that most visual stimuli mask tES-induced phosphenes more effectively than tES phosphenes mask visual stimuli. However, this finding is difficult to interpret quantitatively as any visual property that was not matched between the stimuli could contribute to this asymmetry. For instance, the phosphenes extended farther into the periphery and had a subjectively weaker appearance than any visual stimulus we could present. An additional explanation for this asymmetry is that tES polarizes the membrane of photoreceptors only transiently, whereas the signaling cascade started by light typically changes the membrane for a much longer period of time (Baylor et al. 1984; Schneeweis and Schnapf 1999).
Our claim is not that transcranial stimulation cannot affect the brain. Given enough current, it is inevitable that an electrode placed on the scalp will modulate brain activity. Moreover, recent studies suggest that even at low current levels tACS can entrain EEG signals (Polanía et al. 2012). This does not imply, however, that tACS entrainment of cortical oscillations plays a causal role in the induction of phosphenes. First, we have shown that even a single 1-mA pulse over visual cortex can evoke a phosphene. This shows that synchronization with ongoing oscillations is not necessary. Second, we have provided a novel interpretation of the temporal frequency tuning of phosphenes in terms of the well-known physiological properties of RGCs. The conclusion we draw from these findings is that there is no convincing evidence that tES modulates neural activity underneath the electrode enough to generate a phosphene percept.
The broader conclusion we draw is that currents induced at the occipital pole spread widely across the scalp, well beyond the location of the electrode and outside of the direct path between electrode and reference. This is consistent with predictions of detailed models that simulate the current spread in the human head during tDCS (Datta et al. 2009). Taken together, these findings imply that tES in its current form is unlikely to lead to focal neural activation. tES in a therapeutic setting would benefit from the ability to target specific areas, hence novel stimulation protocols that optimize current distributions (Dmochowski et al. 2011) are needed to overcome this limitation.
GRANTS
This work was supported by the Charles and Johanna Busch Foundation and the National Eye Institute (Grant EY-017605).
DISCLOSURES
A patent application has been filed on subject matter disclosed in this manuscript.
AUTHOR CONTRIBUTIONS
K.K. and B.K. conception and design of research; K.K. performed experiments; K.K. analyzed data; K.K. and B.K. interpreted results of experiments; K.K. prepared figures; K.K. drafted manuscript; K.K. and B.K. edited and revised manuscript; K.K. and B.K. approved final version of manuscript.
ACKNOWLEDGMENTS
We thank Adam Morris, Alex Casti, and other members of the Krekelberg Laboratory for helpful comments and discussion.
REFERENCES
- Attwell D. Interaction of low frequency electric fields with the nervous system: the retina as a model system. Radiat Prot Dosimetry 106: 341–348, 2003 [DOI] [PubMed] [Google Scholar]
- Baylor DA, Nunn BJ, Schnapf JL. The photocurrent, noise and spectral sensitivity of rods of the monkey Macaca fascicularis. J Physiol 357: 575–607, 1984 [DOI] [PMC free article] [PubMed] [Google Scholar]
- Benardete EA, Kaplan E. The dynamics of primate M retinal ganglion cells. Vis Neurosci 16: 355–368, 1999 [DOI] [PubMed] [Google Scholar]
- Brindley GS. The site of electrical excitation of the human eye. J Physiol 127: 189–200, 1955 [DOI] [PMC free article] [PubMed] [Google Scholar]
- Datta A, Bansal V, Diaz J, Patel J, Reato D, Bikson M. Gyri-precise head model of transcranial direct current stimulation: improved spatial focality using a ring electrode versus conventional rectangular pad. Brain Stimul 2: 201–207, 207.e1, 2009 [DOI] [PMC free article] [PubMed] [Google Scholar]
- Delbeke J, Oozeer M, Veraart C. Position, size and luminosity of phosphenes generated by direct optic nerve stimulation. Vision Res 43: 1091–1102, 2003 [DOI] [PubMed] [Google Scholar]
- Dmochowski JP, Datta A, Bikson M, Su Y, Parra LC. Optimized multi-electrode stimulation increases focality and intensity at target. J Neural Eng 8: 046011, 2011 [DOI] [PubMed] [Google Scholar]
- Efron B, Tibshirani RJ. An Introduction to the Bootstrap. Boca Raton, FL: Chapman & Hall/CRC, 1994 [Google Scholar]
- Jeffreys DA, Axford JG. Source locations of pattern-specific components of human visual evoked potentials. I. Component of striate cortical origin. Exp Brain Res 16: 1–21, 1972 [DOI] [PubMed] [Google Scholar]
- Kanai R, Chaieb L, Antal A, Walsh V, Paulus W. Frequency-dependent electrical stimulation of the visual cortex. Curr Biol 18: 1839–1843, 2008 [DOI] [PubMed] [Google Scholar]
- Kontsevich LL, Tyler CW. Bayesian adaptive estimation of psychometric slope and threshold. Vision Res 39: 2729–2737, 1999 [DOI] [PubMed] [Google Scholar]
- Meier-Koll A. [Electric stimulation of the retina in ophthalmologic differential diagnosis]. Biomed Tech (Berl) 18: 92–97, 1973 [DOI] [PubMed] [Google Scholar]
- Paulus W. On the difficulties of separating retinal from cortical origins of phosphenes when using transcranial alternating current stimulation (tACS). Clin Neurophysiol 121: 987–991, 2010 [DOI] [PubMed] [Google Scholar]
- Polanía R, Nitsche MA, Korman C, Batsikadze G, Paulus W. The importance of timing in segregated theta phase-coupling for cognitive performance. Curr Biol 22: 1314–1318, 2012 [DOI] [PubMed] [Google Scholar]
- Purpura K, Tranchina D, Kaplan E, Shapley RM. Light adaptation in the primate retina: analysis of changes in gain and dynamics of monkey retinal ganglion cells. Vis Neurosci 4: 75–93, 1990 [DOI] [PubMed] [Google Scholar]
- Reato D, Rahman A, Bikson M, Parra LC. Low-intensity electrical stimulation affects network dynamics by modulating population rate and spike timing. J Neurosci 30: 15067–15079, 2010 [DOI] [PMC free article] [PubMed] [Google Scholar]
- Rohracher H. Uber subjektive Lichterscheinungen bei Reizung mit Wechselstromen. Zeitschrift für Sinnesphysiologie 66: 164–181, 1935 [Google Scholar]
- Schneeweis DM, Schnapf JL. The photovoltage of macaque cone photoreceptors: adaptation, noise, and kinetics. J Neurosci 19: 1203–1216, 1999 [DOI] [PMC free article] [PubMed] [Google Scholar]
- Schutter DJ, Hortensius R. Retinal origin of phosphenes to transcranial alternating current stimulation. Clin Neurophysiol 121: 1080–1084, 2010 [DOI] [PubMed] [Google Scholar]
- Schwiedrzik CM. Retina or visual cortex? The site of phosphene induction by transcranial alternating current stimulation. Front Integr Neurosci 3: 6, 2009 [DOI] [PMC free article] [PubMed] [Google Scholar]
- Victor JD. The dynamics of the cat retinal X cell centre. J Physiol 386: 219–246, 1987 [DOI] [PMC free article] [PubMed] [Google Scholar]