

Abstract
Deficits in contrast sensitivity (CS) have been reported in Alzheimer’s disease (AD). However, the extent of these deficits in prodromal AD stages, including mild cognitive impairment (MCI) or even earlier, has not been investigated. In this study, CS was assessed using frequency doubling technology (FDT) in older adults with AD (n=10), amnestic MCI (n=28), cognitive complaints without performance deficits (CC, n=20), and healthy controls (HC, n=29). The association between CS and cognition was also evaluated. Finally, the accuracy of CS measures for classifying MCI versus HC was evaluated.
CS deficits were found in AD and MCI, while CC showed intermediate performance between MCI and HC. Upper right visual field CS showed the most significant difference among groups. CS was also associated with cognitive performance. Finally, CS measures accurately classified MCI versus HC. The CS deficits in AD and MCI, and intermediate performance in CC, indicate that these measures are sensitive to early AD-associated changes. Therefore, FDT-based measures of CS may have promise as a novel AD biomarker.
Keywords: contrast sensitivity (CS), frequency doubling technology (FDT), Alzheimer’s disease (AD), mild cognitive impairment (MCI), cognitive complaints, biomarker, vision
1. Introduction
Alzheimer’s disease (AD) is the most common form of dementia, affecting more than five million Americans over the age of 65 (Alzheimer’s Association, 2011). Characterized by memory deficits, cognitive impairment, and dementia, AD is a progressive neurodegenerative disease that evolves over many years (Alzheimer’s Association, 2011, McKhann, et al., 1984). In addition to cognitive deficits, patients with AD also show alterations in sensory perception, such as visual processing (Cronin-Golomb, 1995, Jackson and Owsley, 2003, Valenti, 2010), auditory processing (Idrizbegovic, et al., 2011, Iliadou and Kaprinis, 2003), and olfaction (Djordjevic, et al., 2008, Schiffman, 1997). AD patients show deficits in only some types of visual processing, while other types are relatively spared. Specifically, patients with AD show deficits in visual contrast sensitivity (CS), color discrimination (lower spectral wavelengths), motion discrimination, and other visual field (VF) deficits (Cronin-Golomb, 1995, Cronin-Golomb, et al., 1991a, Cronin-Golomb, et al., 1991b, Gilmore, et al., 1994, Gilmore and Whitehouse, 1995, Katz and Rimmer, 1989, Pache, et al., 2003). Patients with AD also show degeneration of the visual pathway in both the brain and the retina, including central degeneration of the magnocellular pathway in the lateral geniculate nucleus (LGN) and the visual cortex (Armstrong, 1996, Hof and Morrison, 1990, Leuba and Saini, 1995, McKee, et al., 2006, Mielke, et al., 1995), and loss of retinal ganglion cells (RGC) within the retinal nerve fiber layer, respectively (Blanks, et al., 1989, Curcio and Drucker, 1993, Hinton, et al., 1986, Paquet, et al., 2007, Parisi, et al., 2001, Sadun and Bassi, 1990, Tsai, et al., 1991, Valenti, 2007).
Frequency doubling technology (FDT) is an automated tool that can detect alterations in CS and other VF defects (Anderson and Johnson, 2003, Zeppieri and Johnson, 2008). FDT is commonly used in glaucoma testing (Cello, et al., 2000, Tatemichi, et al., 2002). This technique utilizes an optical illusion called “frequency doubling,” which occurs when an achromatic, low spatial frequency sinusoidal grating undergoes counterphased flickering at high temporal frequency, resulting in an apparent doubling of the spatial frequency of the grating (Anderson and Johnson, 2003, Kelly, 1981, Richards and Felton, 1973, Zeppieri and Johnson, 2008). Processing of the FDT signal is thought to involve activation in the magnocellular pathway and visual association areas (Richards and Felton, 1973, White, et al., 2002).
In an effort to understand the development of AD and assist with early identification of at-risk individuals, prodromal stages of AD have been defined and extensively studied. Mild cognitive impairment (MCI), which is characterized by significant deficits in one or more cognitive domains (typically memory) in the absence of dementia, is the most commonly studied disorder considered to be an early stage of AD (Petersen, 2004). With an annual conversion of 10-15% of MCI patients to probable AD, MCI also represents the most widely accepted pre-AD stage (Petersen, et al., 1999). In order to identify patients who are likely to progress to AD before significant cognitive impairments are evident, recent studies have attempted to define earlier stages of AD than MCI using genetic background (i.e., apolipoprotein E ε4 status) (Dik, et al., 2001, Scarmeas and Stern, 2006), family history of AD (Mosconi, et al., 2007, Smith, et al., 2002), presence of significant amyloid deposition measured using positron emission tomography (PET) or cerebrospinal fluid measures (CSF) (Sperling, et al., 2011), and/or the presence of cognitive complaints (Ahmed, et al., 2008, Saykin, et al., 2006). For example, Saykin et al. (2006) demonstrated that older adults with cognitive complaints have significant hippocampal atrophy, supporting this classification as a “pre-MCI” stage (Saykin, et al., 2006).
To date, functional alterations in visual CS have not been evaluated in patients with MCI or older adults with “pre-MCI” symptoms (e.g., patients with cognitive complaints). Therefore, the goals of the present study were: (1) to assess whether AD participants in our sample demonstrate the expected deficits in CS using the FDT-2 24-2 VF contrast sensitivity test; (2) to determine the extent to which patients with MCI and older adults with cognitive complaints show CS deficits relative to healthy older controls (HC); (3) to evaluate whether CS deficits are equally distributed across the VF or focally impaired; (4) to assess the association between CS and psychometric performance; and, (5) to evaluate the accuracy of CS measures for the classification of MCI patients versus HC.
2. Methods
2.1. Participants
106 participants from an ongoing study of aging and cognition at two academic medical centers, Dartmouth-Hitchcock Medical Center and the Indiana University School of Medicine, received a comprehensive ophthalmologic examination, including the FDT-2 24-2 VF contrast sensitivity test, as well as an extensive protocol of structural and functional neuroimaging scans, clinical evaluation, and neuropsychological assessment. Of the 111 participants who underwent the ophthalmological examination and FDT-2 testing, 24 participants were excluded, including 10 participants with evidence of glaucoma, 11 participants with co-morbid visual problems and health disorders which would significantly affect visual CS (e.g., significant cataracts, poor visual acuity, amblyopia, nystagmus, Graves’ disease, significant epiretinal membrane), and three healthy controls who were performance outliers on one or more of the FDT-2 summary variables (mean deviation and/or pattern standard deviation), scoring significantly below the expected performance for their age as determined by an independent sample of healthy participants (Anderson, et al., 2005) (<0.5% probability that normal participants would show age-adjusted performance at that level). In addition, each of these HC participants was significantly impaired in only one eye, suggesting undiagnosed unilateral optic nerve disease. Finally, the inclusion of these participants in the reported analyses did not alter the pattern of significant results (data not shown). Consequently, the sample used for all analyses reported here includes 87 participants: 10 patients diagnosed with probable Alzheimer’s disease (AD); 28 patients diagnosed with amnestic mild cognitive impairment (MCI); 20 euthymic individuals with significant cognitive complaints (CC) but normal cognitive performance on psychometric tests; and 29 age-matched healthy controls (HC). All participants provided written informed consent in accordance with the Declaration of Helsinki via protocols approved by the appropriate Institutional Review Board.
2.2. FDT-2 contrast sensitivity threshold visual field test (24-2)
All participants were tested with a standard FDT-2 24-2 VF contrast sensitivity threshold exam protocol which evaluates 55 VF regions in the right eye, followed by 55 regions in the left eye (Zeppieri and Johnson, 2008). This test provides a single measure of CS threshold (in decibels (dB)) at each of the 110 regions, using a maximum likelihood threshold strategy known as ZEST (Zippy Estimate of Sequential Testing) (McKendrick and Turpin, 2005, Turpin, et al., 2003). The 24-2 exam features 24-degree coverage with stimulus size of five degrees, spatial frequency of 0.5 cycles per degree, and a temporal frequency of 18 Hertz (Hz) (Zeppieri and Johnson, 2008). In addition to the threshold values for each region, two summary measures of general CS across the VF are also reported, including mean deviation and pattern standard deviation. Mean deviation is a measure of the overall CS in each eye, while pattern standard deviation indicates how each of the 55 VF test locations deviates from the expected value from the age-adjusted normative database after adjustment for any general reduction or enhancement of CS. In addition, since the 24-2 threshold VF test is iterative, exam duration also potentially represents a general measure of CS performance. Finally, reliability tests are completed, including estimations of fixation errors, false positive errors, and false negative errors. Fixation errors are tested by a stimulus of 50% contrast in the location of the blind spot (Heijl-Krakau method), which should not be detected if proper fixation is maintained. False positive errors are tested by presenting stimuli at 0% contrast, with any responses to these stimuli considered false positive errors. False negative errors are tested by presenting stimuli at 100% contrast, such that no response would be a false negative error (Anderson and Johnson, 2003, Zeppieri and Johnson, 2008). In the 24-2 test, 10 fixation error trials, 10 false positive trials, and six false negative trials are included.
2.3. Neuropsychological and clinical assessments
All participants received a detailed clinical exam, as well as a number of clinical, psychometric, and neuropsychiatric assessments (Saykin, et al., 2006). Measures examined in this study included: the Mini-Mental State Examination (MMSE) (Cockrell and Folstein, 1988, Folstein, et al., 1975) and Mattis Dementia Rating Scale-2 (DRS) (Jurica, et al., 2001) to assess general cognition; the California Verbal Learning Test-II (CVLT) (Delis, et al., 1987, Delis, et al., 2000) to evaluate memory performance; and the Wisconsin Card Sorting Test (WCST) (Heaton, et al., 1993) to determine executive functioning. Cognitive complaints were evaluated using ratings from both from the participant and an informant with a comprehensive set assessment measures as described previously (Saykin, et al., 2006). Specifically, assessments from the participant and informant included: the Memory Self-Rating Questionnaire, the Neurobehavioral Function and activities of Daily Living Rating Scale, the Informant Questionnaire on Cognitive Decline in the Elderly, cognitive items from the Geriatric Depression Scale (GDS), and selected items from a telephone-based screening for MCI, from the Memory Assessment Questionnaire, and from the Functional Activities Questionnaire. Complete references to see all measures are presented in Saykin et al. (2006) (Saykin, et al., 2006).
Clinical diagnoses for all participants were done using group consensus of clinicians and clinically trained research scientists, and the Clinical Dementia Rating Scale (CDR) (Morris, 1993) was used to quantify the severity of clinical symptoms and complaints. AD participants were diagnosed according to the criteria in McKhann et al. (1987) (McKhann, et al., 1984), while MCI participants were diagnosed using Petersen criteria (Petersen, 2004, Petersen, et al., 1999). All participants included in the present study were amnestic or multi-domain (including the amnestic domain) MCI. Non-amnestic MCI participants were not included in the present study. Inclusion and exclusion criteria have been previously described (Saykin, et al., 2006). Briefly, participants were screened for eligibility using a standardized phone interview with memory assessment and an in-person interview. Inclusion criteria included an age of 60-90 years, right-handedness, fluent English speaking, and at least 10 years of formal education. Participants were also required to have an informant who knew them well and would complete questionnaires about the participant’s cognition and overall health. Exclusion criteria were the presence of a major medical, psychiatric, and/or neurologic condition (other than AD or MCI) that could significantly affect brain structure and/or cognition, a history of head trauma (with a loss of consciousness for more than 5 minutes), history of substance abuse, and/or factors contraindicating MRI.
2.4. Statistical analyses
All continuous variables, including demographic information, psychometric performance, visual acuity, intraocular pressure (IOP), and FDT-2 visual CS performance, exam duration, and exam errors were evaluated for the effect of diagnostic group (AD, MCI, CC, HC) using one-way analysis of variance (ANOVA) or covariance (ANCOVA). FDT-2 performance values for the left and right eye, as well as bilateral mean values were evaluated independently. Post-hoc testing used a Bonferroni correction for multiple comparisons to assess between-group differences. A chi-square test was used to evaluate the effect of diagnostic group on categorical variables (e.g., gender, cataract history). PASW version 18.0.0 (SPSS Inc., Chicago, IL) was used for all statistical analyses.
Statistical analyses assessing psychometric performance and FDT-2 exam errors, exam duration, and all regional VF contrast sensitivity thresholds included age at visit, gender, and years of education as covariates. Since FDT-2 mean deviation and pattern standard deviation are reported as age-adjusted values, the analyses for these variables included only education and gender as covariates. Previous studies have reported an association between the presence of cataracts and/or visual acuity with CS performance (Elliott, 1993, Elliott, et al., 1989, Neargarder, et al., 2003); however, other studies have suggested these may not significantly influence FDT performance (Anderson and Johnson, 2003, Johnson and Samuels, 1997, Sponsel, et al., 1998). We investigated the role of a history of cataracts or cataract surgery and/or visual acuity (raw and/or corrected) as covariates and found no significant effects (see results).
In addition to comparing FDT-2 contrast sensitivity results among diagnostic groups, we evaluated the relationship between CS deficits and cognitive impairment, including impaired cognitive performance on global functioning and memory tests. The relationships between FDT-2 performance (exam duration; mean deviation in CS; mean CS threshold in the bilateral upper right VF) and clinical performance variables (MMSE total score (general cognition); CVLT total score and long delay recall scores (memory performance)) were assessed using a bivariate Pearson correlation. Mean deviation in CS was adjusted for gender and education prior to the correlation analysis. Clinical performance scores, exam duration, and mean contrast threshold in the bilateral upper right VF were adjusted for age at visit, gender and education prior to the correlation analysis.
Logistic regression models were used to calculate sensitivity, specificity, and overall accuracy of MCI vs. HC classification using visual CS measures, which were pre-adjusted and entered as independent predictors. FDT-2 summary measures (mean deviation, pattern standard deviation) were pre-adjusted for gender and education. Visual CS thresholds (single VF regions (1-55) and four VF quadrants for each eye), exam duration, and memory performance were pre-adjusted for age at visit, gender, and education. Receiver operating characteristic (ROC) curves were then created for the best independent classifiers from the logistic regression model. Finally, the ability of FDT-2 contrast sensitivity performance to improve diagnostic classification provided by standard psychometric performance was assessed by entering memory performance (CVLT total score, pre-adjusted for age, gender, and education) into a logistic regression model as an independent classifier of MCI vs. HC and in combination with the best FDT-2 visual CS classifier. We chose to evaluate only the classification of MCI vs. HC because of a relatively balanced number of participants in each of these groups, while the other clinical groups were smaller in size.
3. Results
3.1. Demographics, ophthalmologic exam variables, and psychometric performance
Demographic information, selected variables from the ophthalmological exam, and mean psychometric performance are presented in Table 1. Age at visit and years of education differed among groups (p<0.05). Post-hoc analyses indicated that MCI participants were older than HC participants (trend significance, p=0.069). In addition, post-hoc analyses suggested a trend level significant difference in educational level, with HC participants more educated than MCI participants (trend significance, p=0.09). No other pairs show significant differences in either age or years of education. Gender distribution was not significantly different among diagnostic groups or between any group pairs.
Table 1.
Demographics, Ophthalmologic Exam Variables, and Psychometric Performance (Mean +/− SE)
| AD (n=10) |
MCI (n=28) |
CC (n=20) |
HC (n=29) |
AN(C)OVA p-value |
Significant Post-hoc Comparisons (p<0.05) |
|
|---|---|---|---|---|---|---|
| Age (years) | 76.70 (2.2) | 76.36 (1.3) | 71.00 (1.6) | 72.41 (1.3) | 0.028 | None |
| Education (years) | 15.3 (0.8) | 15.54 (0.5) | 16.80 (0.6) | 17.38 (0.5) | 0.033 | None |
| Gender (Male, Female) | 3, 7 | 14, 14 | 4, 16 | 9, 20 | NS | None |
| IOP (mmHg) – Right | 13.6 (0.9) | 13.8 (0.5) | 13.4 (0.6) | 14.6 (0.5) | NS | None |
| IOP (mmHg) – Left | 14.3 (0.8) | 13.3 (0.5) | 13.1 (0.6) | 14.3 (0.5) | NS | None |
| Cataracts – Right and/or Left (mild, none/removal) |
8, 2 | 8, 20 | 7, 13 | 14, 15 | NS | None |
| Cup-to-Disc Ratio - Right1 | 0.42 (0.05) | 0.36 (0.03) | 0.32 (0.03) | 0.32 (0.02) | NS | None |
| Cup-to-Disc Ratio - Left1 | 0.39 (0.05) | 0.36 (0.03) | 0.29 (0.03) | 0.31 (0.02) | NS | None |
| Uncorrected Acuity – Right | 20/30.5 (2.6) | 20/25.4 (1.6) | 20/27.3 (1.9) | 20/27.6 (1.5) | NS | None |
| Uncorrected Acuity – Left | 20/30.5 (2.9) | 20/26.6 (1.7) | 20/27.5 (2.0) | 20/26.5 (1.7) | NS | None |
| Corrected Acuity – Right | 20/27.0 (1.7) | 20/22.5 (1.0) | 20/23.3 (1.2) | 20/23.6 (1.0) | NS | None |
| Corrected Acuity – Left | 20/27.5 (2.0) | 20/23.8 (1.2) | 20/23.8 (1.4) | 20/24.5 (1.2) | NS | None |
| CDR-GL2,7 | 0.94 (0.07) | 0.53 (0.04) | 0.45 (0.05) | 0.06 (0.04) | p<0.001 | AD>MCI,CC>HC |
| CDR-SB2,7 | 4.30 (0.4) | 1.40 (0.3) | 0.89 (0.3) | 0.27 (0.2) | p<0.001 | AD>MCI>HC; AD>CC |
| MMSE3,7 | 24.18 (0.5) | 27.82 (0.3) | 28.57 (0.4) | 28.82 (0.3) | p<0.001 | HC, CC, MCI>AD |
| WCST4,7 | 1.29 (0.4) | 2.85 (0.3) | 3.81 (0.3) | 3.60 (0.2) | p<0.001 | HC, CC, MCI>AD |
| CVLT Total7 | 25.57 (2.8) | 36.26 (1.8) | 50.06 (2.0) | 51.76 (1.7) | p<0.001 | HC, CC>MCI>AD |
| CVLT-SD7 | 3.18 (0.8) | 7.06 (0.5) | 10.95 (0.6) | 11.95 (0.5) | p<0.001 | HC, CC>MCI>AD |
| CVLT-LD7 | 2.40 (0.8) | 7.05 (0.5) | 10.90 (0.6) | 12.30 (0.5) | p<0.001 | HC, CC>MCI>AD |
| DRS Total5,7 | 125.60 (1.9) | 136.68 (1.2) | 139.27 (1.3) | 140.59 (1.1) | p<0.001 | HC, CC, MCI>AD |
| GDS (15-item)6,7 | 5.49 (1.0) | 4.17 (0.7) | 2.13 (0.8) | 1.46 (0.6) | 0.004 | AD, MCI>HC |
Missing 14 participants (2 AD, 9 MCI, 3 HC)
Missing 1 AD participant
Missing 1 HC participant
Missing 1 AD participant and 1 MCI participant
Missing 1 AD participant
Missing 1 AD participant, 2 MCI participants, and 2 CC participants
Group means are adjusted for selected covariates (age, gender, and years of education)
AD = Alzheimer’s disease; ANCOVA = analysis of covariance; ANOVA = analysis of variance; CC = cognitive complaints; CDR = Clinical Dementia Rating Scale; CDR-GL = global CDR score; CDR-SB = CDR sum of boxes score; CVLT = California Verbal Learning Test; CVLT-LD = CVLT long delay recall score; CVLT-SD = CVLT short delay recall score; DRS = Mattis Dementia Rating Scale; GDS = Geriatric Depression Scale; HC = healthy age-matched control; IOP = intraocular pressure; MCI = mild cognitive impairment; MMSE = Mini-Mental State Examination; NS = not significant; SE = standard error of the mean; WCST = Wisconsin Card Sorting Task
Psychometric performance showed the expected pattern of significant differences among diagnostic groups. Clinical Dementia Rating scale (CDR) global score (CDR-GL, Range: 0-2.0), CDR sum of boxes (CDR-SB, Range: 0-14), Mini-Mental State Examination (MMSE) total score (Range: 15-30), Wisconsin Card Sorting Task (WCST) total categories correct (Range: 0-5), Dementia Rating Scale-2 (DRS) total score (Range: 94-144), and California Verbal Learning Test-II (CVLT) total score (Range: 17-72), short delay recall score (CVLT-SD, Range: 0-16), and long delay recall score (CVLT-LD, Range: 0-16), were different among groups (p<0.001). Post-hoc analyses showed significant impairment in patient groups (AD and MCI) relative to HC (see Table 1 for all post-hoc comparison results; all p<0.05). Specifically, AD patients had greater CDR-GL and CDR-SB scores and lower MMSE, WCST, DRS, and CVLT (total, CVLT-SD, and CVLT-LD) scores than all other groups (MCI, CC, and HC; p<0.05). MCI participants had greater CDR scores (CDR-GL, CDR-SB) and lower CVLT scores (total, CVLT-SD, CVLT-LD) than HC participants (p<0.05), as well as lower CVLT total, CVLT-SD, and CVLT-LD scores than CC participants (p<0.05). By definition, CC participants showed performance that was clinically within normal limits on psychometric assessment and thus, no significant differences on neuropsychological test performance from HC (Table 1; (Saykin, et al., 2006)). However, CC participants did show a significantly greater CDR-GL than HC participants (p<0.05). Although AD and MCI patients reported more depressive symptoms on the Geriatric Depression Scale (GDS, Range: 0-17) than HC (p<0.05), most of these scores do not represent a clinically significant level of symptomatology and none met criteria for major depression. No other differences between group pairs in GDS total score were observed in the post-hoc analysis.
Cataract history, cup-to-disc ratio, and visual acuity (raw or corrected) were not different among diagnostic groups (Table 1, p>0.05). Due to the known association between cataracts and visual acuity with FDT-2 test performance, we evaluated whether the inclusion of these variables as additional covariates in the assessment of the effect of diagnostic group on FDT-2 performance (presented below) altered the findings. We found no significant effects of cataract history or visual acuity on FDT-2 performance after accounting for diagnostic group effects (data not shown). Furthermore, the effects of diagnostic group on FDT-2 performance described below were not altered by the inclusion of cataract history and/or visual acuity as additional covariates (data not shown). Therefore, the reported analyses below did not include cataract history or visual acuity as covariates.
3.2. FDT-2 performance errors
Fixation errors did not differ among groups (Figure 1A). However, false positive and false negative errors were different among groups for the left eye only (p<0.05; Figure 1B and 1C). Post-hoc comparisons indicated more false positive and false negative errors in AD patients than in CC participants for the left eye (both p<0.05). All other post-hoc pair comparisons were not significant.
Figure 1.

FDT-2 24-2 Performance Errors
Measures of FDT-2 24-2 performance errors, including fixation errors (A), false positive errors (B) and false negative errors (C) are shown in Figure 1. False positive (B) and false negative (C) errors differed among groups in the left eye only (both p<0.05), with post-hoc comparisons indicating more false positive and false negative errors in AD patients relative to CC in the left eye (both p<0.05). See experimental procedures section for a description of how FDT-2 performance errors are tested. In all graphs, bars represent raw (unadjusted) mean performance errors +/− standard error. However, all statistical models (A-C) included age at visit, gender, and years of education as covariates.
3.3. FDT-2 exam duration and summary variables
The duration of the FDT-2 exam for both the left and right eyes was different among diagnostic groups (p<0.001; Figure 2A). Post-hoc comparisons indicated that AD patients took longer to complete the exam on average than HC participants for both eyes (all p<0.001). Additionally, AD participants had greater mean exam durations than CC participants in both eyes (both p<0.01) and MCI participants in the right eye (p<0.01). No other differences were observed between group pairs upon post-hoc analysis.
Figure 2.

FDT-2 Exam Duration and Mean Deviation and Pattern Standard Deviation in Visual Contrast Sensitivity
Summary measures of visual contrast sensitivity (CS) performance, including exam duration (A), mean deviation (B), which is a measure of general CS, and pattern standard deviation (C), which measures the variability of CS across the retina, were significantly different among groups in both eyes (all p<0.001). See text for complete discussion of significant post-hoc comparisons. Briefly, AD patients showed impairment in nearly all FDT-2 test performance variables relative to CC and HC participants. In addition, MCI patients showed impairment in selected FDT-2 measures relative to HC participants. Bars represent adjusted group mean values +/− standard error (exam duration (A) was adjusted for age at visit, gender, and years of education; mean deviation (B) and pattern standard deviation (C) were adjusted for gender and years of education).
Mean deviation in FDT-2 contrast sensitivity was different among groups in both eyes (both p<0.0001; Figure 2B). Post-hoc comparisons demonstrated more impairment in both eyes (lower mean deviation) in AD patients relative to CC and HC (all p<0.001), as well as lower mean deviation relative to MCI patients in the right eye (p<0.05). MCI patients also showed lower mean deviation than HC participants in both eyes (L: p<0.01; R: p<0.05) and CC participants in the left eye (p<0.05). CC participants also showed slight impairments in mean deviation relative to HC, with intermediate performance between MCI and HC groups, although the comparisons did not reach statistical significance.
Pattern standard deviation in FDT-2 contrast sensitivity also differed among groups in both eyes (both p<0.001; Figure 2C). AD patients had more variability in CS across the retina (larger mean pattern standard deviation value) in both eyes than CC (both p<0.01) and HC participants (both p<0.001). MCI participants also had significantly greater variability (higher mean pattern standard deviation) than HC in the right eye only (p<0.05). Similar to the results for the mean deviation comparison, CC participants demonstrated slightly elevated variability in CS relative to HC in both eyes, but this finding did not reach statistical significance.
3.4. Regional contrast sensitivity performance across the visual field
CS thresholds in 51 of the 55 VF regions in the left eye (Figure 3A) and 47 of the 55 VF regions in the right eye (Figure 3B) were different among diagnostic groups (see significance values in Figures 3A and 3B). Post-hoc comparisons indicated that 92 of the 110 VF regions were impaired in AD patients relative to HC, while MCI patients showed significant impairment in 24 of the 110 VF regions relative to HCs (p<0.05).
Figure 3.

Group Differences in FDT-2 Contrast Sensitivity Thresholds across the Visual Field
Significant differences among diagnostic groups were observed in contrast sensitivity (CS) thresholds in 93 of 110 regions across the visual field (VF) in the left (A) and right (B) eyes. In addition to evaluating single VF regions, mean contrast thresholds for four VF quadrants within each eye were assessed. All VF quadrants of the left (C) and right (D) eyes were significantly different among diagnostic groups. See text for discussion of between-group differences. All statistical models represented in this figure included age at visit, gender, and education as covariates.
Differences among diagnostic groups in mean CS were also detected in the four VF quadrants bilaterally (significance shown in Figures 3C and 3D), with the upper right VF quadrant showing the largest difference among groups in both eyes. Post-hoc comparisons demonstrated impaired mean CS in all VF quadrants of both eyes in AD patients relative to CC (all p<0.05) and HC participants (all p<0.005), and relative to MCI patients in the upper right VF quadrants of both eyes (both p<0.01) and the upper left VF quadrant of the left eye (p<0.05). MCI patients also demonstrated a reduced mean CS relative to HCs in both upper VF quadrants and the lower left VF quadrant of the left eye (all p<0.05) and the upper right VF quadrant of the right eye (p<0.05), as well as an impaired mean CS relative to CC participants in the upper right and lower left VF quadrants of the left eye (both p<0.05).
3.5. Relationship between contrast sensitivity and cognitive performance
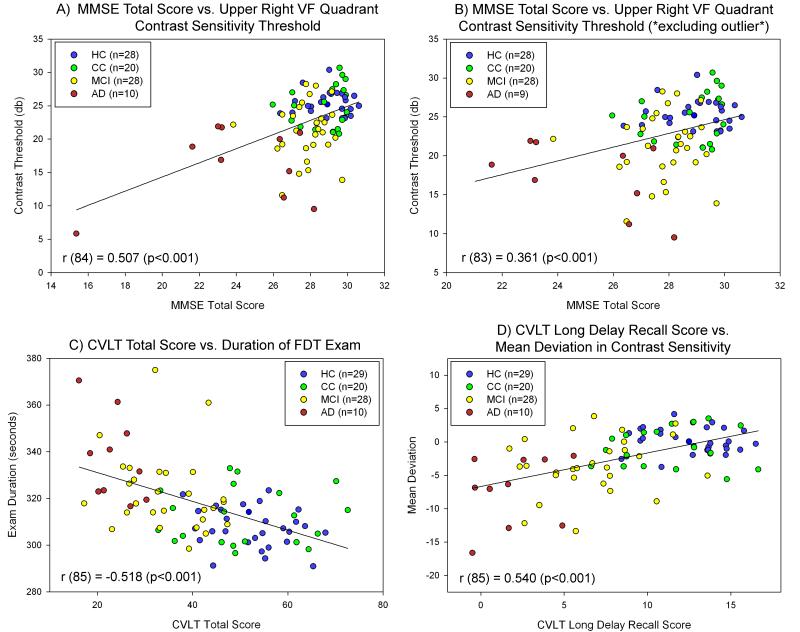
Impaired FDT-2 contrast sensitivity performance was associated with performance deficits on cognitive screening and memory measures. MMSE total score was significantly associated with the mean CS threshold in the bilateral upper right VF quadrant (Figure 4A; r (84) = 0.507, p<0.001). In this association one AD participant appeared to be a significant outlier with a MMSE total score of 15. After excluding this participant the association remained, with mild attenuation (Figure 4B; r (83) = 0.361, p<0.001). Memory performance on the CVLT was also significantly associated with FDT-2 contrast sensitivity performance, including associations between CVLT total score and bilateral exam duration (Figure 4C; r (85) = -0.518, p<0.001), as well as between CVLT-LD and the mean CS threshold in the bilateral mean deviation (Figure 4D; r (85) = 0.540, p<0.001). The associations between memory performance and CS remained significant when the AD participant discussed above was excluded, so all participants were included in Figures 4C & 4D.
Figure 4.
Relationship between Contrast Sensitivity and Cognition
Significant associations between visual contrast sensitivity (CS) performance measured with the FDT-2 24-2 exam and cognitive performance were observed. General cognition (MMSE total score) was significantly associated with the mean bilateral contrast threshold of the upper right visual field (VF) quadrant (A). Upon visual inspection, one AD participant appeared to be a significant outlier and significantly more impaired, with an MMSE total score well below all other participants. However, when this participant was excluded (B), MMSE total score was still significantly associated with CS performance as measured by the mean bilateral contrast threshold of the upper right VF quadrant. Memory performance was also significantly associated with visual CS, including significant associations between CVLT total score and bilateral mean exam duration (C) and between CVLT long delay recall score and the mean deviation in CS (D). All participants were included in panels A, C, and D, while 1 AD participant was excluded (due to low MMSE total score) from panel B. Exclusion of the AD outlier did not affect the results in panels C and D. Psychometric and CS performance variables were adjusted for age at visit (all variables except for mean deviation), gender (all variables), and years of education (all variables). Different colors for each diagnostic group are included as indicated in the figure legend.
3.6. Logistic regression and ROC curves for diagnostic classification of MCI versus HC
Univariate and multivariate classification capabilities of the FDT-2 variables were examined in a preliminary manner considering the available sample sizes and non-independence of some variables. Logistic regression models demonstrated significant predictive ability of summary and threshold CS variables. Mean CS threshold in the bilateral lower right VF quadrant was the best MCI vs. HC classifier with 80.7% overall accuracy (specificity = 87.0%, sensitivity = 76.5%; Figure 5A, AUC = 0.791), while the mean CS threshold in the bilateral upper right VF quadrant had 78.9% accuracy (specificity = 80.7%, sensitivity = 77.4%; Figure 5B, AUC = 0.825). Bilateral mean exam duration and mean deviation were also sensitive for predicting MCI vs. HC, with overall accuracies of 71.5% (specificity = 70.0%, sensitivity = 74.1%; Figure 5C, AUC = 0.805) and 73.7% (specificity = 78.3%, sensitivity = 70.6%; Figure 5D, AUC = 0.783), respectively. Finally, the classification accuracy for MCI vs. HC using a measure of memory performance (CVLT total score) was improved by adding a measure of CS performance. CVLT total score alone showed an overall accuracy for MCI vs. HC of 86.0% (specificity = 85.7%, sensitivity = 86.2%). The addition of bilateral mean contrast threshold in the upper right VF quadrant as a second classifier raised the overall accuracy to 91.2% (specificity = 92.9%, sensitivity = 89.7%).
Figure 5.

ROC Curves of MCI vs. HC Classification for Selected FDT-2 Variables
Visual contrast sensitivity (CS) measures effectively classified patients with MCI and HC by diagnostic group. The bilateral mean contrast threshold in the lower right visual field (VF) quadrant (A) was the best classifier of MCI vs. HC, with an overall accuracy of 80.7% (specificity = 87.0%, sensitivity = 76.5%; AUC = 0.791). In addition, the bilateral mean contrast threshold in the upper right VF quadrant (B) successfully classified MCI vs. HC with an overall accuracy of 78.9% (specificity = 80.7%, sensitivity = 77.4%; AUC = 0.825). Summary measures of CS performance were also good classifiers, with bilateral mean exam duration (C) showing an overall accuracy of 71.5% (specificity = 70.0%, sensitivity = 74.1%; AUC = 0.805) and bilateral mean deviation in visual CS (D) showing an overall accuracy of 73.7% (specificity = 78.3%, sensitivity = 70.6%; AUC = 0.783). Prior to evaluation for classification accuracy, bilateral mean deviation was adjusted for gender and years of education. All other variables (contrast thresholds in the bilateral mean lower left VF and bilateral mean upper right VF, exam duration) were adjusted for age at visit, gender, and years of education.
4. Discussion
The present study was designed to evaluate visual CS in patients with MCI and AD, as well as in older adults with cognitive complaints. The results demonstrated that patients with both AD and MCI show marked deficits in CS with increased exam time, reduced general sensitivity (lower mean deviation), and abnormal variability (higher pattern standard deviation). Significant differences were detected in the majority of the 110 regions tested in the FDT-2 24-2 exam, with the most notable differences in the upper right VF quadrant. In addition to showing differences among diagnostic groups, CS deficits were also associated with impaired cognitive performance, including in global functioning (MMSE total score) and memory performance (CVLT total score and long delay recall score). Finally, in a preliminary assessment using the available data set, measures of CS demonstrated significant capability to classify MCI and HC by diagnostic group.
These results suggest that CS deficits are a feature of AD and AD-related changes, even in early prodromal stages of the disease (i.e., MCI and CC). However, the biological and/or neuropathological basis of this deficit in CS is currently unknown. These deficits could result from a number of pathological changes in the visual system of AD patients, including (but not limited to): (1) sub-threshold glaucomatous damage; (2) performance deficits due to cognitive inability to complete the task; (3) degeneration and/or dysfunction of retinal ganglion cells (RGC); and/or, (4) degeneration and/or dysfunction of visual pathways within the brain. However, our findings are unlikely to result from either of the first two explanations. Although previous reports have shown a high co-occurrence of glaucoma and AD (Bayer, et al., 2002, Tamura, et al., 2006, Wostyn, et al., 2009), as well as an association between the primary genetic predictor of late-onset AD (i.e., apolipoprotein E genotype) and glaucoma (Al-Dabbagh, et al., 2009, Mabuchi, et al., 2005, Vickers, et al., 2002), participants in our cohort who showed even mild glaucoma symptoms were excluded. Additionally, no significant differences among diagnostic groups in cup-to-disc ratio or intraocular pressure (IOP) were observed (Table 1), suggesting that glaucomatous symptoms do not likely underlie the differences among groups. In addition, it is unlikely, although possible, that impaired CS was due solely to impaired cognition, as participants in the present study show relatively mild cognitive deficits and showed minimal errors on the FDT-2 24-2 exam (Table 1 and Figure 1).
Therefore, the observed deficits in CS are most likely reflecting changes associated with neuropathological and/or functional changes in the retina and/or central visual processing pathways. Further the abnormal variability suggests that patients have inconsistent CS across the visual field, which may result from regional loss of RGCs or higher FDT-2 errors in patient populations. Patients with AD have previously been shown to have extensive retinal and optic nerve degeneration with loss of RGC, measured as thinning of the retinal nerve fiber layer in vivo using optical coherence tomography (OCT) and other techniques (Guo, et al., 2010, Iseri, et al., 2006, Kergoat, et al., 2001, Paquet, et al., 2007, Parisi, et al., 2001, Valenti, 2007), as well as RGC loss noted in post-mortem retinal tissues (Blanks, et al., 1989, Blanks, et al., 1996a, Blanks, et al., 1996b, Curcio and Drucker, 1993, Sadun, 1989, Sadun and Bassi, 1990), changes in retinal vasculature (Berisha, et al., 2007), and functional changes in retinal activation (Katz and Rimmer, 1989, Katz, et al., 1989, Martinelli, et al., 1996, Parisi, et al., 2001). In addition, MCI patients have also been shown to have intermediate thinning of the nerve fiber layer using OCT (Paquet, et al., 2007).
RGC loss in AD and MCI may result from amyloid pathology in the eye and/or retina. Both amyloid-beta (Aβ) plaques and oligomers have been reported in post-mortem retinal tissue from patients with AD and a mouse model of AD (Koronyo-Hamaoui, et al., 2011, Koronyo, et al., 2012), as well as in vivo human retinal tissue (i.e., vitreous humor) from patients with glaucoma (Janciauskiene and Krakau, 2001, Yin, et al., 2008, Yoneda, et al., 2005). In addition, amyloid has been shown to be associated with degeneration of RGC in a mouse model of glaucoma (Guo, et al., 2007). Aβ has also been shown to be present in the lenses of patients with AD, at levels comparable to the brain (Goldstein, et al., 2003). Therefore, in AD patients, amyloid accumulation in the eye and/or retina may result in degeneration of RGC in parallel to amyloid accumulation and Aβ-related neurodegeneration in the brain. In fact, in a mouse model of AD, plaque accumulation in the retina was not only significantly associated with amyloid plaques in the brain, but actually preceded extensive brain amyloid deposition (Koronyo-Hamaoui, et al., 2011).
Degeneration of RGC may also result retrograde from AD pathology in the central visual pathways. AD patients show degeneration of the primary and secondary visual cortex (Armstrong, 1996, Hof and Morrison, 1990, Katz and Rimmer, 1989, McKee, et al., 2006, Mielke, et al., 1995), as well as degeneration of subcortical regions comprising parts of the visual pathway (e.g., LGN) (Leuba and Saini, 1995). The magnocellular visual pathway appears to be particularly vulnerable to degeneration in AD, with magnocellular cortical layers showing more degeneration than neighboring regions (Hof and Morrison, 1990, Leuba and Saini, 1995). Interestingly, FDT contrast sensitivity performance has been shown to heavily involve the magnocellular visual pathway (Anderson and Johnson, 2003, Zeppieri and Johnson, 2008) and changes in magnocellular function have been suggested to underlie CS deficits in AD (Gilmore, et al., 2004). Thus, degeneration of RGC and/or visual pathways in the brain may individually affect or combine to underlie the functional deficits in CS seen in patients with AD and MCI, as well as CC, in this study. Future studies utilizing advanced neuroimaging techniques, including amyloid PET imaging, diffusion tensor imaging of white matter tracts, and potentially functional neuroimaging of CS paradigms, may help to identify the neurobiological basis for the observed deficits.
The trend for more significant right rather than left VF deficits, particularly in the upper right VF quadrant, is notable. These results suggest that left visual pathways and/or calcarine cortex impairments may underlie some of the observed deficits in CS. AD and MCI patients have been shown to have significant left inferior and medial temporal neurodegeneration, possibly related to the dependence of the cognitive tests on the left hemisphere (i.e., verbal episodic memory). Therefore, the observation of more significant deficits in CS which are mediated by left hemisphere visual pathways in this sample of patients diagnosed using verbal episodic memory tests may indicate more degeneration in the left than right hemisphere in these patients. Future studies to further investigate changes in brain structure using in vivo imaging and its relationship to FDT measures of CS, as well as a more extensive battery of visual testing to evaluate the role of infracalcarine deficits, are warranted.
Despite the strong effects and novel observations, the present study has several limitations. We did not assess RGC loss or nerve fiber layer changes directly using OCT or other techniques. The association of RGC loss to CS performance would be beneficial in elucidating the neurobiological substrates of the observed CS deficits (i.e., retinal and/or central basis). Future studies utilizing both FDT-2 measures of retinal function and OCT measures of retinal morphology would be ideal. Second, in the present report the group of patients with AD was small relative to the other groups. This shortcoming is not surprising and somewhat unavoidable due to our exclusion of patients with glaucoma and the high co-occurrence of glaucoma and AD (Bayer, et al., 2002, Tamura, et al., 2006, Wostyn, et al., 2009). In addition, the focus of our study was to evaluate CS in prodromal stages of AD. Third, despite their relatively mild impairment, AD participants may have had difficulty with some aspects of the FDT-2 task, which could impact their overall performance. Therefore, future studies should more explicitly investigate whether task difficulty and/or biological changes underlie the deficits observed in this group would be beneficial. Additionally, a number of participants included in each group were found to have mild cataracts, which may have adversely affected FDT-2 performance in these participants. Future studies to more fully characterize the role of mild cataracts on FDT-2 performance in patients with MCI and AD, as well as pre-MCI, would be beneficial. In addition, we included only correlations between FDT-2 measures of CS and neuropsychological performance that were evaluated across all participants, rather than within each diagnostic group, due to the relatively small sample size. However, these associations may not accurately reflect the actual relationship between CS and cognition, since there are known diagnostic differences in both measures. Additional analyses did suggest some significant and diagnosis-independent relationships between CS and cognition (partial correlations adjusted for diagnostic group, data not shown). Therefore, future studies with larger samples should consider the association between FDT-2 measures of CS and cognition both across all participants and within each diagnostic group. Finally, the cross-sectional nature of the study design precludes assessment of the ability of FDT-2 contrast sensitivity deficits to predict and/or monitor future disease progression. Future studies designed to determine the sensitivity of FDT-2 to longitudinal change and clinical outcome, as well as those including larger AD cohorts, will be informative.
The presence of CS deficits in patients with MCI and even some individuals who show normal cognitive function but have complaints about their cognition is noteworthy and warrants additional investigation. The results of this cross-sectional design study suggest that visual CS performance, as measured by FDT-2, may represent a novel biomarker for early detection of AD and AD-related changes. However, the ability of impaired CS to predict future progression to AD in patients in early stages of disease or even in cognitively normal elders at-risk for progression to AD due to genetics, high amyloid accumulation, and/or cognitive complaints is presently unknown. Future studies to determine whether CS can be used effectively as a biomarker for differential diagnosis and prediction of disease progression are needed. In particular, studies evaluating longitudinal CS performance monitoring as a screening tool or outcome variable would be particularly beneficial. FDT-2 measures of CS performance have previously been shown to be relatively stable, despite a learning effect, in healthy adults (Iester, et al., 2000). If proven to be dynamically sensitive to changes associated to disease progression, CS and/or other ocular biomarkers of AD would be particularly useful in early detection and disease monitoring due to the fact that they are relatively non-invasive, inexpensive, and widely available (Frost, et al., 2010).
In conclusion, patients with MCI and AD show deficits in CS measured using FDT-2. Older adults with cognitive complaints but no clinically significant memory impairments also show some mild alterations in CS performance. The deficits in CS are generally distributed across the entire retina, although the greatest difference between patients with MCI and AD and HC is observed in the upper right VF quadrant. Impairments in CS are significantly associated with cognitive deficits, including general cognition and memory impairments. Finally, measures of CS can effectively categorize MCI patients versus HC. These results suggest that visual CS measured using FDT-2 may be a useful biomarker for AD, even in early clinical stages. Future studies are needed to help elucidate the biological basis of the observed CS deficits, as well as to examine the utility of this measure in detecting and predicting disease progression to AD.
Supplementary Material
Acknowledgments
This study was supported by an investigator-initiated research grant from Welch Allyn, Inc. (AJS), the National Institutes of Health (R01 AG19771), Alzheimer’s Association (IIRG-99-1653 from the Hedco Foundation), and Indiana Economic Development Corporation (IEDC 87884) to AJS, National Institute on Aging (P30 AG10133-18S1 Core Supplement to Drs. B. Ghetti and AJS), National Institutes of Health Clinical and Translational Sciences Institute Pre-doctoral Training Fellowship to SLR (Training Grant TL1 RR025759), as well as the National Institutes of Health/National Center for Research Resources Indiana Clinical and Translational Sciences Institute (U54 RR025761; C06-RR020128).
The authors gratefully acknowledge the help of the ophthalmology technicians at Indiana University School of Medicine (Linda Morgan, CCRC and Joni Hoop, CCRC, COA) and Dartmouth-Hitchcock Medical Center (Kimberly McQuaid, COMT) for assistance with the FDT exams; Drs. Vanessa Taler and Katherine Nutter-Upham, and Margaret Nordstrom for assistance with cognitive assessment and cohort follow-up; and Drs. Edward O’Neil and Greg Gdowski of Blue Highway, LLC, a subsidiary of Welch Allyn, Inc. Finally, we thank the participants and family members from New England and Indiana without whom this study would not have been possible.
Abbreviations
- Aβ
amyloid-beta
- AD
Alzheimer’s disease
- ANCOVA
analysis of covariance
- ANOVA
analysis of variance
- AUC
area under the curve
- CC
older adults with cognitive complaints
- CDR
Clinical Dementia Rating Scale
- CDR-GL
CDR global score
- CDR-SB
CDR sum of boxes
- CS
contrast sensitivity
- CSF
cerebrospinal fluid
- CVLT
California Verbal Learning Test
- CVLT-LD
CVLT long delay recall score
- CVLT-SD
CVLT short delay recall score
- dB
decibels
- DRS
Mattis Dementia Rating Scale
- FDT
frequency doubling technology
- GDS
Geriatric Depression Scale
- HC
healthy older adults
- Hz
hertz
- IOP
intraocular pressure
- LGN
lateral geniculate nucleus
- MCI
mild cognitive impairment
- MMSE
Mini-Mental State Examination
- NS
not significant
- OCT
optical coherence tomography
- PET
positron emission tomography
- RGC
retinal ganglion cells
- ROC
receiver operating characteristic
- SE
standard error of the mean
- VF
visual field
- WCST
Wisconsin Card Sorting Task
- ZEST
zippy estimate of sequential testing
Footnotes
Publisher's Disclaimer: This is a PDF file of an unedited manuscript that has been accepted for publication. As a service to our customers we are providing this early version of the manuscript. The manuscript will undergo copyediting, typesetting, and review of the resulting proof before it is published in its final citable form. Please note that during the production process errors may be discovered which could affect the content, and all legal disclaimers that apply to the journal pertain.
5.1. Disclosure Statement RW Newman is formerly an employee of Welch Allyn, Inc.
All other authors report no conflicts or commercial interests applicable to the present work.
6. References
- Ahmed S, Mitchell J, Arnold R, Dawson K, Nestor PJ, Hodges JR. Memory complaints in mild cognitive impairment, worried well, and semantic dementia patients. Alzheimer Dis Assoc Disord. 2008;22(3):227–35. doi: 10.1097/WAD.0b013e31816bbd27. [DOI] [PubMed] [Google Scholar]
- Al-Dabbagh NM, Al-Dohayan N, Arfin M, Tariq M. Apolipoprotein E polymorphisms and primary glaucoma in Saudis. Mol Vis. 2009;15:912–9. [PMC free article] [PubMed] [Google Scholar]
- Anderson AJ, Johnson CA. Frequency-doubling technology perimetry. Ophthalmol Clin North Am. 2003;16(2):213–25. doi: 10.1016/s0896-1549(03)00011-7. [DOI] [PubMed] [Google Scholar]
- Anderson AJ, Johnson CA, Fingeret M, Keltner JL, Spry PG, Wall M, Werner JS. Characteristics of the normative database for the Humphrey matrix perimeter. Invest Ophthalmol Vis Sci. 2005;46(4):1540–8. doi: 10.1167/iovs.04-0968. [DOI] [PMC free article] [PubMed] [Google Scholar]
- Armstrong RA. Visual field defects in Alzheimer’s disease patients may reflect differential pathology in the primary visual cortex. Optom Vis Sci. 1996;73(11):677–82. doi: 10.1097/00006324-199611000-00001. [DOI] [PubMed] [Google Scholar]
- Association A.s. Alzheimer’s disease facts and figures. Alzheimers Dement. 2011;7(2):208–44. doi: 10.1016/j.jalz.2011.02.004. [DOI] [PubMed] [Google Scholar]
- Bayer AU, Ferrari F, Erb C. High occurrence rate of glaucoma among patients with Alzheimer’s disease. Eur Neurol. 2002;47(3):165–8. doi: 10.1159/000047976. [DOI] [PubMed] [Google Scholar]
- Berisha F, Feke GT, Trempe CL, McMeel JW, Schepens CL. Retinal abnormalities in early Alzheimer’s disease. Invest Ophthalmol Vis Sci. 2007;48(5):2285–9. doi: 10.1167/iovs.06-1029. [DOI] [PubMed] [Google Scholar]
- Blanks JC, Hinton DR, Sadun AA, Miller CA. Retinal ganglion cell degeneration in Alzheimer’s disease. Brain Res. 1989;501(2):364–72. doi: 10.1016/0006-8993(89)90653-7. [DOI] [PubMed] [Google Scholar]
- Blanks JC, Schmidt SY, Torigoe Y, Porrello KV, Hinton DR, Blanks RH. Retinal pathology in Alzheimer’s disease. II. Regional neuron loss and glial changes in GCL. Neurobiol Aging. 1996a;17(3):385–95. doi: 10.1016/0197-4580(96)00009-7. [DOI] [PubMed] [Google Scholar]
- Blanks JC, Torigoe Y, Hinton DR, Blanks RH. Retinal pathology in Alzheimer’s disease. I. Ganglion cell loss in foveal/parafoveal retina. Neurobiol Aging. 1996b;17(3):377–84. doi: 10.1016/0197-4580(96)00010-3. [DOI] [PubMed] [Google Scholar]
- Cello KE, Nelson-Quigg JM, Johnson CA. Frequency doubling technology perimetry for detection of glaucomatous visual field loss. Am J Ophthalmol. 2000;129(3):314–22. doi: 10.1016/s0002-9394(99)00414-6. [DOI] [PubMed] [Google Scholar]
- Cockrell JR, Folstein MF. Mini-Mental State Examination (MMSE) Psychopharmacol Bull. 1988;24(4):689–92. [PubMed] [Google Scholar]
- Cronin-Golomb A. Vision in Alzheimer’s disease. Gerontologist. 1995;35(3):370–6. doi: 10.1093/geront/35.3.370. [DOI] [PubMed] [Google Scholar]
- Cronin-Golomb A, Corkin S, Rizzo JF, Cohen J, Growdon JH, Banks KS. Visual dysfunction in Alzheimer’s disease: relation to normal aging. Ann Neurol. 1991a;29(1):41–52. doi: 10.1002/ana.410290110. [DOI] [PubMed] [Google Scholar]
- Cronin-Golomb A, Rizzo JF, Corkin S, Growdon JH. Visual function in Alzheimer’s disease and normal aging. Ann N Y Acad Sci. 1991b;640:28–35. doi: 10.1111/j.1749-6632.1991.tb00186.x. [DOI] [PubMed] [Google Scholar]
- Curcio CA, Drucker DN. Retinal ganglion cells in Alzheimer’s disease and aging. Ann Neurol. 1993;33(3):248–57. doi: 10.1002/ana.410330305. [DOI] [PubMed] [Google Scholar]
- Delis D, Kramer J, Kaplan E, Ober B. California Verbal Learning Test: adult version research edition manual. The Psychological Corporation; San Antonio, TX: 1987. [Google Scholar]
- Delis D, Kramer J, Kaplan E, Ober B. California Verbal Learning Test-second edition: adult version manual. The Psychological Corporation; San Antonio, TX: 2000. [Google Scholar]
- Dik MG, Jonker C, Comijs HC, Bouter LM, Twisk JW, van Kamp GJ, Deeg DJ. Memory complaints and APOE-epsilon4 accelerate cognitive decline in cognitively normal elderly. Neurology. 2001;57(12):2217–22. doi: 10.1212/wnl.57.12.2217. [DOI] [PubMed] [Google Scholar]
- Djordjevic J, Jones-Gotman M, De Sousa K, Chertkow H. Olfaction in patients with mild cognitive impairment and Alzheimer’s disease. Neurobiol Aging. 2008;29(5):693–706. doi: 10.1016/j.neurobiolaging.2006.11.014. [DOI] [PubMed] [Google Scholar]
- Elliott DB. Evaluating visual function in cataract. Optom Vis Sci. 1993;70(11):896–902. doi: 10.1097/00006324-199311000-00006. [DOI] [PubMed] [Google Scholar]
- Elliott DB, Gilchrist J, Whitaker D. Contrast sensitivity and glare sensitivity changes with three types of cataract morphology: are these techniques necessary in a clinical evaluation of cataract? Ophthalmic Physiol Opt. 1989;9(1):25–30. doi: 10.1111/j.1475-1313.1989.tb00800.x. [DOI] [PubMed] [Google Scholar]
- Folstein MF, Folstein SE, McHugh PR. “Mini-mental state”. A practical method for grading the cognitive state of patients for the clinician. J Psychiatr Res. 1975;12(3):189–98. doi: 10.1016/0022-3956(75)90026-6. [DOI] [PubMed] [Google Scholar]
- Frost S, Martins RN, Kanagasingam Y. Ocular biomarkers for early detection of Alzheimer’s disease. J Alzheimers Dis. 2010;22(1):1–16. doi: 10.3233/JAD-2010-100819. [DOI] [PubMed] [Google Scholar]
- Gilmore GC, Morrison S, Groth K. Magnocellular deficit hypothesis in Alzheimer’s disease. In: Cronin-Golomb A, Hof PR, editors. Interdisciplinary Topics in Gerontology: Vision in Alzheimer’s Disease and Related Disorders. Karger, Basel: 2004. pp. 173–98. [Google Scholar]
- Gilmore GC, Wenk HE, Naylor LA, Koss E. Motion perception and Alzheimer’s disease. J Gerontol. 1994;49(2):52–7. doi: 10.1093/geronj/49.2.p52. [DOI] [PubMed] [Google Scholar]
- Gilmore GC, Whitehouse PJ. Contrast sensitivity in Alzheimer’s disease: a 1-year longitudinal analysis. Optom Vis Sci. 1995;72(2):83–91. doi: 10.1097/00006324-199502000-00007. [DOI] [PubMed] [Google Scholar]
- Goldstein LE, Muffat JA, Cherny RA, Moir RD, Ericsson MH, Huang X, Mavros C, Coccia JA, Faget KY, Fitch KA, Masters CL, Tanzi RE, Chylack LT, Jr., Bush AI. Cytosolic beta-amyloid deposition and supranuclear cataracts in lenses from people with Alzheimer’s disease. Lancet. 2003;361(9365):1258–65. doi: 10.1016/S0140-6736(03)12981-9. [DOI] [PubMed] [Google Scholar]
- Guo L, Duggan J, Cordeiro MF. Alzheimer’s disease and retinal neurodegeneration. Curr Alzheimer Res. 2010;7(1):3–14. doi: 10.2174/156720510790274491. [DOI] [PubMed] [Google Scholar]
- Guo L, Salt TE, Luong V, Wood N, Cheung W, Maass A, Ferrari G, Russo-Marie F, Sillito AM, Cheetham ME, Moss SE, Fitzke FW, Cordeiro MF. Targeting amyloid-beta in glaucoma treatment. Proc Natl Acad Sci U S A. 2007;104(33):13444–9. doi: 10.1073/pnas.0703707104. [DOI] [PMC free article] [PubMed] [Google Scholar]
- Heaton R, Chelune G, Talley J, Kay G, Curtis G. Wisconsin Card SortingTest manual revised and expanded. Psychological Assessment Resources; Odessa, FL: 1993. [Google Scholar]
- Hinton DR, Sadun AA, Blanks JC, Miller CA. Optic-nerve degeneration in Alzheimer’s disease. N Engl J Med. 1986;315(8):485–7. doi: 10.1056/NEJM198608213150804. [DOI] [PubMed] [Google Scholar]
- Hof PR, Morrison JH. Quantitative analysis of a vulnerable subset of pyramidal neurons in Alzheimer’s disease: II. Primary and secondary visual cortex. J Comp Neurol. 1990;301(1):55–64. doi: 10.1002/cne.903010106. [DOI] [PubMed] [Google Scholar]
- Idrizbegovic E, Hederstierna C, Dahlquist M, Kampfe Nordstrom C, Jelic V, Rosenhall U. Central auditory function in early Alzheimer’s disease and in mild cognitive impairment. Age Ageing. 2011;40(2):249–54. doi: 10.1093/ageing/afq168. [DOI] [PubMed] [Google Scholar]
- Iester M, Capris P, Pandolfo A, Zingirian M, Traverso CE. Learning effect, short-term fluctuation, and long-term fluctuation in frequency doubling technique. Am J Ophthalmol. 2000;130(2):160–4. doi: 10.1016/s0002-9394(00)00464-5. [DOI] [PubMed] [Google Scholar]
- Iliadou V, Kaprinis S. Clinical psychoacoustics in Alzheimer’s disease central auditory processing disorders and speech deterioration. Ann Gen Hosp Psychiatry. 2003;2(1):12. doi: 10.1186/1475-2832-2-12. [DOI] [PMC free article] [PubMed] [Google Scholar]
- Iseri PK, Altinas O, Tokay T, Yuksel N. Relationship between cognitive impairment and retinal morphological and visual functional abnormalities in Alzheimer disease. J Neuroophthalmol. 2006;26(1):18–24. doi: 10.1097/01.wno.0000204645.56873.26. [DOI] [PubMed] [Google Scholar]
- Jackson GR, Owsley C. Visual dysfunction, neurodegenerative diseases, and aging. Neurol Clin. 2003;21(3):709–28. doi: 10.1016/s0733-8619(02)00107-x. [DOI] [PubMed] [Google Scholar]
- Janciauskiene S, Krakau T. Alzheimer’s peptide: a possible link between glaucoma, exfoliation syndrome and Alzheimer’s disease. Acta Ophthalmol Scand. 2001;79(3):328–9. doi: 10.1034/j.1600-0420.2001.790327.x. [DOI] [PubMed] [Google Scholar]
- Johnson CA, Samuels SJ. Screening for glaucomatous visual field loss with frequency-doubling perimetry. Invest Ophthalmol Vis Sci. 1997;38(2):413–25. [PubMed] [Google Scholar]
- Jurica P, Leitten C, Mattis S. Dementia Rating Scale - 2. Psychological Assessment Resources, Inc.; Lutz, FL: 2001. [Google Scholar]
- Katz B, Rimmer S. Ophthalmologic manifestations of Alzheimer’s disease. Surv Ophthalmol. 1989;34(1):31–43. doi: 10.1016/0039-6257(89)90127-6. [DOI] [PubMed] [Google Scholar]
- Katz B, Rimmer S, Iragui V, Katzman R. Abnormal pattern electroretinogram in Alzheimer’s disease: evidence for retinal ganglion cell degeneration? Ann Neurol. 1989;26(2):221–5. doi: 10.1002/ana.410260207. [DOI] [PubMed] [Google Scholar]
- Kelly DH. Nonlinear visual responses to flickering sinusoidal gratings. J Opt Soc Am. 1981;71(9):1051–5. doi: 10.1364/josa.71.001051. [DOI] [PubMed] [Google Scholar]
- Kergoat H, Kergoat MJ, Justino L, Chertkow H, Robillard A, Bergman H. An evaluation of the retinal nerve fiber layer thickness by scanning laser polarimetry in individuals with dementia of the Alzheimer type. Acta Ophthalmol Scand. 2001;79(2):187–91. doi: 10.1034/j.1600-0420.2001.079002187.x. [DOI] [PubMed] [Google Scholar]
- Koronyo-Hamaoui M, Koronyo Y, Ljubimov AV, Miller CA, Ko MK, Black KL, Schwartz M, Farkas DL. Identification of amyloid plaques in retinas from Alzheimer’s patients and noninvasive in vivo optical imaging of retinal plaques in a mouse model. Neuroimage. 2011;54(Suppl 1):S204–17. doi: 10.1016/j.neuroimage.2010.06.020. [DOI] [PMC free article] [PubMed] [Google Scholar]
- Koronyo Y, Salumbides BC, Black KL, Koronyo-Hamaoui M. Alzheimer’s Disease in the Retina: Imaging Retinal Ab Plaques for Early Diagnosis and Therapy Assessment. Neurodegenerative Diseases. 2012:1–9. doi: 10.1159/000335154. [DOI] [PubMed] [Google Scholar]
- Leuba G, Saini K. Pathology of subcortical visual centres in relation to cortical degeneration in Alzheimer’s disease. Neuropathol Appl Neurobiol. 1995;21(5):410–22. doi: 10.1111/j.1365-2990.1995.tb01078.x. [DOI] [PubMed] [Google Scholar]
- Mabuchi F, Tang S, Ando D, Yamakita M, Wang J, Kashiwagi K, Yamagata Z, Iijima H, Tsukahara S. The apolipoprotein E gene polymorphism is associated with open angle glaucoma in the Japanese population. Mol Vis. 2005;11:609–12. [PubMed] [Google Scholar]
- Martinelli V, Locatelli T, Comi G, Lia C, Alberoni M, Bressi S, Rovaris M, Franceschi M, Canal N. Pattern visual evoked potential mapping in Alzheimer’s disease: correlations with visuospatial impairment. Dementia. 1996;7(2):63–8. doi: 10.1159/000106855. [DOI] [PubMed] [Google Scholar]
- McKee AC, Au R, Cabral HJ, Kowall NW, Seshadri S, Kubilus CA, Drake J, Wolf PA. Visual association pathology in preclinical Alzheimer disease. J Neuropathol Exp Neurol. 2006;65(6):621–30. doi: 10.1097/00005072-200606000-00010. [DOI] [PubMed] [Google Scholar]
- McKendrick AM, Turpin A. Advantages of terminating Zippy Estimation by Sequential Testing (ZEST) with dynamic criteria for white-on-white perimetry. Optom Vis Sci. 2005;82(11):981–7. [PubMed] [Google Scholar]
- McKhann G, Drachman D, Folstein M, Katzman R, Price D, Stadlan EM. Clinical diagnosis of Alzheimer’s disease: report of the NINCDS-ADRDA Work Group under the auspices of Department of Health and Human Services Task Force on Alzheimer’s Disease. Neurology. 1984;34(7):939–44. doi: 10.1212/wnl.34.7.939. [DOI] [PubMed] [Google Scholar]
- Mielke R, Kessler J, Fink G, Herholz K, Heiss WD. Dysfunction of visual cortex contributes to disturbed processing of visual information in Alzheimer’s disease. Int J Neurosci. 1995;82(1-2):1–9. doi: 10.3109/00207459508994285. [DOI] [PubMed] [Google Scholar]
- Morris JC. The Clinical Dementia Rating (CDR): current version and scoring rules. Neurology. 1993;43(11):2412–4. doi: 10.1212/wnl.43.11.2412-a. [DOI] [PubMed] [Google Scholar]
- Mosconi L, Brys M, Switalski R, Mistur R, Glodzik L, Pirraglia E, Tsui W, De Santi S, de Leon MJ. Maternal family history of Alzheimer’s disease predisposes to reduced brain glucose metabolism. Proceedings of the National Academy of Sciences. 2007;104:19067–72. doi: 10.1073/pnas.0705036104. [DOI] [PMC free article] [PubMed] [Google Scholar]
- Neargarder SA, Stone ER, Cronin-Golomb A, Oross S., 3rd The impact of acuity on performance of four clinical measures of contrast sensitivity in Alzheimer’s disease. J Gerontol B Psychol Sci Soc Sci. 2003;58(1):54–62. doi: 10.1093/geronb/58.1.p54. [DOI] [PubMed] [Google Scholar]
- Pache M, Smeets CH, Gasio PF, Savaskan E, Flammer J, Wirz-Justice A, Kaiser HJ. Colour vision deficiencies in Alzheimer’s disease. Age Ageing. 2003;32(4):422–6. doi: 10.1093/ageing/32.4.422. [DOI] [PubMed] [Google Scholar]
- Paquet C, Boissonnot M, Roger F, Dighiero P, Gil R, Hugon J. Abnormal retinal thickness in patients with mild cognitive impairment and Alzheimer’s disease. Neurosci Lett. 2007;420(2):97–9. doi: 10.1016/j.neulet.2007.02.090. [DOI] [PubMed] [Google Scholar]
- Parisi V, Restuccia R, Fattapposta F, Mina C, Bucci MG, Pierelli F. Morphological and functional retinal impairment in Alzheimer’s disease patients. Clin Neurophysiol. 2001;112(10):1860–7. doi: 10.1016/s1388-2457(01)00620-4. [DOI] [PubMed] [Google Scholar]
- Petersen RC. Mild cognitive impairment as a diagnostic entity. J Intern Med. 2004;256(3):183–94. doi: 10.1111/j.1365-2796.2004.01388.x. [DOI] [PubMed] [Google Scholar]
- Petersen RC, Smith GE, Waring SC, Ivnik RJ, Tangalos EG, Kokmen E. Mild cognitive impairment: clinical characterization and outcome. Arch Neurol. 1999;56(3):303–8. doi: 10.1001/archneur.56.3.303. [DOI] [PubMed] [Google Scholar]
- Richards W, Felton TB. Spatial frequency doubling: retinal or central? Vision Res. 1973;13(11):2129–37. doi: 10.1016/0042-6989(73)90190-9. [DOI] [PubMed] [Google Scholar]
- Sadun AA. The optic neuropathy of Alzheimer’s disease. Metab Pediatr Syst Ophthalmol. 1989;12(1-3):64–8. [PubMed] [Google Scholar]
- Sadun AA, Bassi CJ. Optic nerve damage in Alzheimer’s disease. Ophthalmology. 1990;97(1):9–17. doi: 10.1016/s0161-6420(90)32621-0. [DOI] [PubMed] [Google Scholar]
- Saykin AJ, Wishart HA, Rabin LA, Santulli RB, Flashman LA, West JD, McHugh TL, Mamourian AC. Older adults with cognitive complaints show brain atrophy similar to that of amnestic MCI. Neurology. 2006;67(5):834–42. doi: 10.1212/01.wnl.0000234032.77541.a2. [DOI] [PMC free article] [PubMed] [Google Scholar]
- Scarmeas N, Stern Y. Imaging studies and APOE genotype in persons at risk for Alzheimer’s disease. Curr Psychiatry Rep. 2006;8(1):11–7. doi: 10.1007/s11920-006-0076-1. [DOI] [PMC free article] [PubMed] [Google Scholar]
- Schiffman SS. Taste and smell losses in normal aging and disease. JAMA. 1997;278(16):1357–62. [PubMed] [Google Scholar]
- Smith CD, Andersen AH, Kryscio RJ, Schmitt FA, Kindy MS, Blonder LX, Avison MJ. Women at risk for AD show increased parietal activation during a fluency task. Neurology. 2002;58(8):1197–202. doi: 10.1212/wnl.58.8.1197. [DOI] [PubMed] [Google Scholar]
- Sperling RA, Aisen PS, Beckett LA, Bennett DA, Craft S, Fagan AM, Iwatsubo T, Jack CR, Jr., Kaye J, Montine TJ, Park DC, Reiman EM, Rowe CC, Siemers E, Stern Y, Yaffe K, Carrillo MC, Thies B, Morrison-Bogorad M, Wagster MV, Phelps CH. Toward defining the preclinical stages of Alzheimer’s disease: recommendations from the National Institute on Aging-Alzheimer’s Association workgroups on diagnostic guidelines for Alzheimer’s disease. Alzheimers Dement. 2011;7(3):280–92. doi: 10.1016/j.jalz.2011.03.003. [DOI] [PMC free article] [PubMed] [Google Scholar]
- Sponsel WE, Trigo Y, Hendricks J, Lloyd C. Frequency doubling perimetry. Am J Ophthalmol. 1998;126(1):155–6. doi: 10.1016/s0002-9394(98)00235-9. [DOI] [PubMed] [Google Scholar]
- Tamura H, Kawakami H, Kanamoto T, Kato T, Yokoyama T, Sasaki K, Izumi Y, Matsumoto M, Mishima HK. High frequency of open-angle glaucoma in Japanese patients with Alzheimer’s disease. J Neurol Sci. 2006;246(1-2):79–83. doi: 10.1016/j.jns.2006.02.009. [DOI] [PubMed] [Google Scholar]
- Tatemichi M, Nakano T, Tanaka K, Hayashi T, Nawa T, Miyamoto T, Hiro H, Iwasaki A, Sugita M. Performance of glaucoma mass screening with only a visual field test using frequency-doubling technology perimetry. Am J Ophthalmol. 2002;134(4):529–37. doi: 10.1016/s0002-9394(02)01684-7. [DOI] [PubMed] [Google Scholar]
- Tsai CS, Ritch R, Schwartz B, Lee SS, Miller NR, Chi T, Hsieh FY. Optic nerve head and nerve fiber layer in Alzheimer’s disease. Arch Ophthalmol. 1991;109(2):199–204. doi: 10.1001/archopht.1991.01080020045040. [DOI] [PubMed] [Google Scholar]
- Turpin A, McKendrick AM, Johnson CA, Vingrys AJ. Properties of perimetric threshold estimates from full threshold, ZEST, and SITA-like strategies, as determined by computer simulation. Invest Ophthalmol Vis Sci. 2003;44(11):4787–95. doi: 10.1167/iovs.03-0023. [DOI] [PubMed] [Google Scholar]
- Valenti DA. Neuroimaging of retinal nerve fiber layer in AD using optical coherence tomography. Neurology. 2007;69(10):1060. doi: 10.1212/01.wnl.0000280584.64363.83. [DOI] [PubMed] [Google Scholar]
- Valenti DA. Alzheimer’s disease: visual system review. Optometry. 2010;81(1):12–21. doi: 10.1016/j.optm.2009.04.101. [DOI] [PubMed] [Google Scholar]
- Vickers JC, Craig JE, Stankovich J, McCormack GH, West AK, Dickinson JL, McCartney PJ, Coote MA, Healey DL, Mackey DA. The apolipoprotein epsilon4 gene is associated with elevated risk of normal tension glaucoma. Mol Vis. 2002;8:389–93. [PubMed] [Google Scholar]
- White AJ, Sun H, Swanson WH, Lee BB. An examination of physiological mechanisms underlying the frequency-doubling illusion. Invest Ophthalmol Vis Sci. 2002;43(11):3590–9. [PubMed] [Google Scholar]
- Wostyn P, Audenaert K, De Deyn PP. Alzheimer’s disease and glaucoma: is there a causal relationship? Br J Ophthalmol. 2009;93(12):1557–9. doi: 10.1136/bjo.2008.148064. [DOI] [PubMed] [Google Scholar]
- Yin H, Chen L, Chen X, Liu X. Soluble amyloid beta oligomers may contribute to apoptosis of retinal ganglion cells in glaucoma. Med Hypotheses. 2008;71(1):77–80. doi: 10.1016/j.mehy.2008.01.030. [DOI] [PubMed] [Google Scholar]
- Yoneda S, Hara H, Hirata A, Fukushima M, Inomata Y, Tanihara H. Vitreous fluid levels of beta-amyloid((1-42)) and tau in patients with retinal diseases. Jpn J Ophthalmol. 2005;49(2):106–8. doi: 10.1007/s10384-004-0156-x. [DOI] [PubMed] [Google Scholar]
- Zeppieri M, Johnson CA. Frequency Doubling Techology (FDT) Perimetry. 2008.
Associated Data
This section collects any data citations, data availability statements, or supplementary materials included in this article.