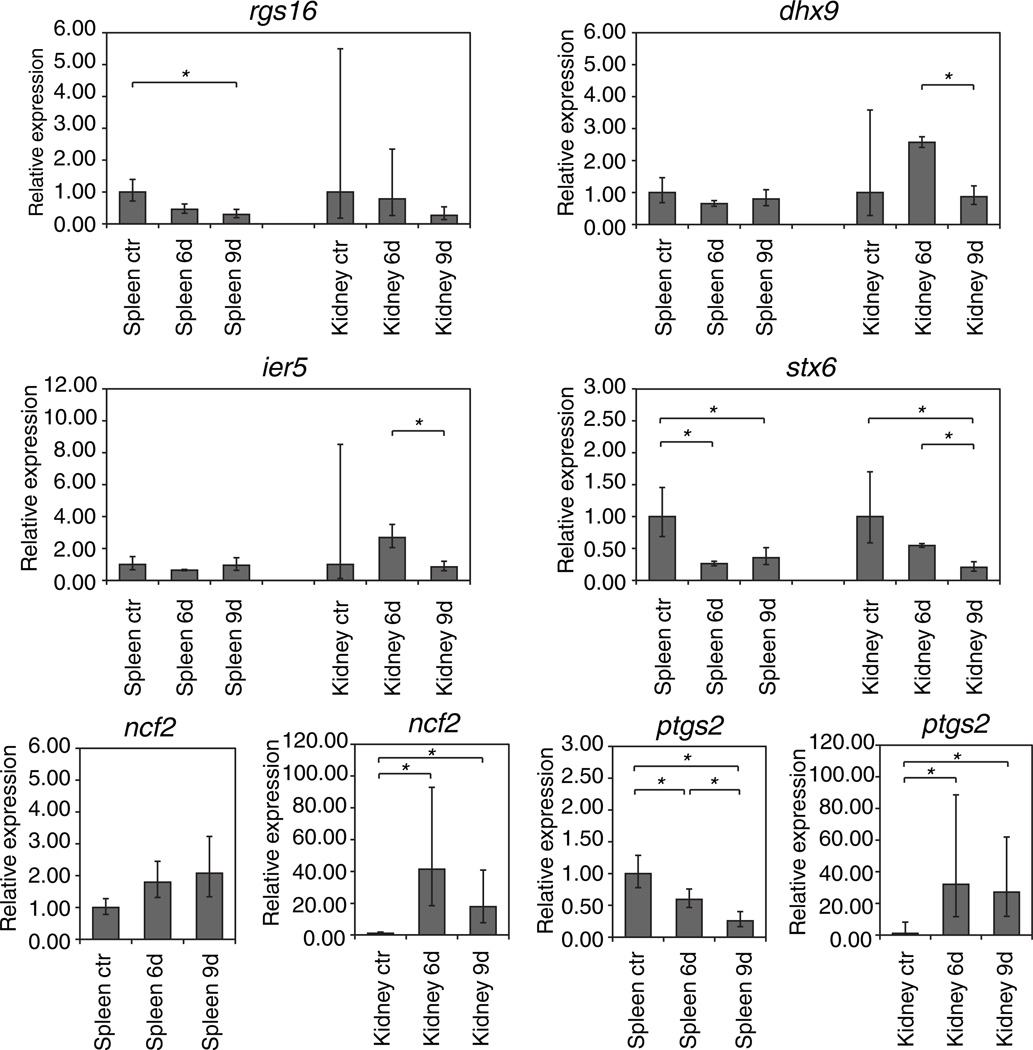
Figure 4. Expression of rgs1/rgs16 region genes in FV3-infected frogs.

6d - 6 days post infection. 9d - 9 days post infection. ctr - control (non-infected) frogs. The expression of markers of interest was normalized on gapdh expression. Error bars represent standard deviation of results obtained from 3 similarly treated frogs. p values were calculated using the unpaired two-tailed Student’s t-test. Asterisks indicate significant changes in gene expression (p<0.05).
