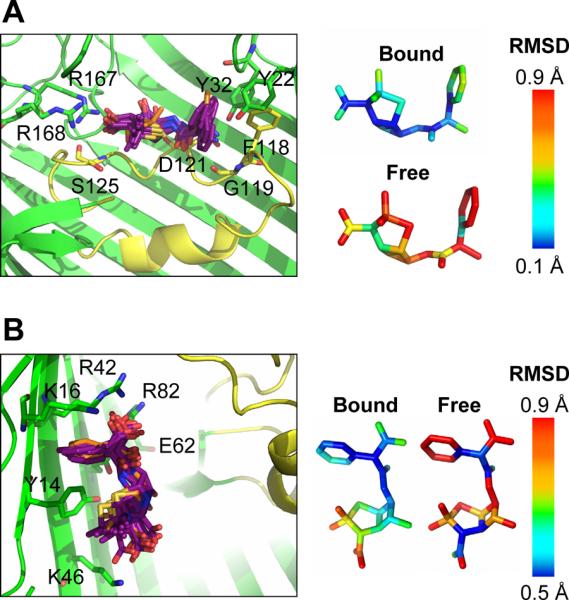
Figure 3.

Antibiotic dynamics in the OmpF binding site. Left: A superposition of 1 ns snapshots shows ampicillin (A) or carbenicillin (B) conformations (purple sticks with the X-ray conformation shown in orange sticks) along the 10 ns MD trajectory. OmpF protein is depicted as ribbons with residues that form hydrogen bonds (within 3.3 Å) with the antibiotic shown as sticks. L3 is colored yellow. Right: The average RMSD along the MD trajectory for the antibiotic in its OmpF binding site was calculated and compared with the RMSD for free antibiotic simulated in a water box (10 ns). A snapshot of the MD system is shown in Figure S4.
