

Abstract
Neural activity in several limbic areas varies as a function of the animal's head direction (HD) in the horizontal plane. Lesions of the vestibular periphery abolish this HD cell signal, suggesting an essential role for vestibular afference in HD signal generation. The organization of brain stem pathways conveying vestibular information to the HD circuit is poorly understood; however, recent anatomical work has identified the supragenual nucleus (SGN) as a putative relay. To test this hypothesis, we made lesions of the SGN in rats and screened for HD cells in the anterodorsal thalamus. In animals with complete bilateral lesions, the overall number of HD cells was significantly reduced relative to control animals. In animals with unilateral lesions of the SGN, directional activity was present, but the preferred firing directions of these cells were unstable and less influenced by the rotation of an environmental landmark. In addition, we found that preferred directions displayed large directional shifts when animals foraged for food in a darkened environment and when they were navigating from a familiar environment to a novel one, suggesting that the SGN plays a critical role in projecting essential self-motion (idiothetic) information to the HD cell circuit.
Keywords: head direction, orientation, place cell, spatial navigation, vestibular system
the ability to navigate accurately is dependent on a network of cells and pathways that determine an animal's spatial location and orientation within an environment (Moser et al. 2008; Taube 2007). A critical component of this network is the head direction (HD) cells, which specifically fire as a function of the animal's HD in the horizontal plane (Taube 2007). Each HD cell is preferentially tuned to a single direction (preferred firing direction) such that each directional heading is represented within a small population of cells, collectively forming a neural compass that tracks the moment-to-moment changes in an animal's orientation. Preferred firing directions can be anchored to external cues such that the rotation of salient landmarks can evoke corresponding rotations in the preferred firing directions (Taube 1995; Taube et al. 1990b). Moreover, preferred directions can be maintained in the absence of visual information and when the animal is locomoting into unfamiliar environments, suggesting that idiothetic information, such as vestibular and motor cues (efference copy and/or proprioception), can also control directional tuning (Goodridge et al. 1998; Taube and Burton 1995; Yoder et al. 2011b). HD cell activity has been studied most extensively in the anterodorsal thalamus (ADN) (Taube 1995), but large populations of HD cells have been observed in several other brain regions particularly within the limbic system, including the para- and postsubiculum (Boccara et al. 2010; Taube et al. 1990a), medial entorhinal cortex (Sargolini et al. 2006), lateral mammillary nuclei (LMN) (Blair et al. 1998; Stackman and Taube 1998), retrosplenial cortex (Chen et al. 1994; Cho and Sharp 2001), and dorsal tegmental nuclei (DTN) (Sharp et al. 2001b).
Because directional heading can be derived from angular head velocity information, models of the HD signal have pointed to the vestibular system as a critical input (McNaughton et al. 1991; Redish et al. 1996; reviewed in Taube and Bassett 2003). Supporting this view, lesions of the peripheral vestibular system severely disrupt directional firing in the ADN (Muir et al. 2009; Stackman and Taube 1997; Yoder and Taube 2009). The organization of brain stem pathways from the vestibular system to HD cell circuitry is poorly understood, but anatomical work has identified pathways stemming from the medial vestibular nucleus → supragenual nucleus (SGN) and nucleus prepositus hypoglossi (NPH) → DTN → LMN → ADN (see Fig. 1; Biazoli et al. 2006; Brown et al. 2005; Taube 2007). The DTN and LMN contain neurons that are modulated by angular head velocity (Bassett and Taube 2001; Blair et al. 1998; Stackman and Taube 1998), and lesion studies show that damage to either structure abolishes directional activity in the ADN (Bassett et al. 2007; Blair et al. 1998). Nonetheless, whether the DTN and LMN receive angular head velocity information via the SGN, the nucleus prepositus, or both is presently unclear.
Fig. 1.
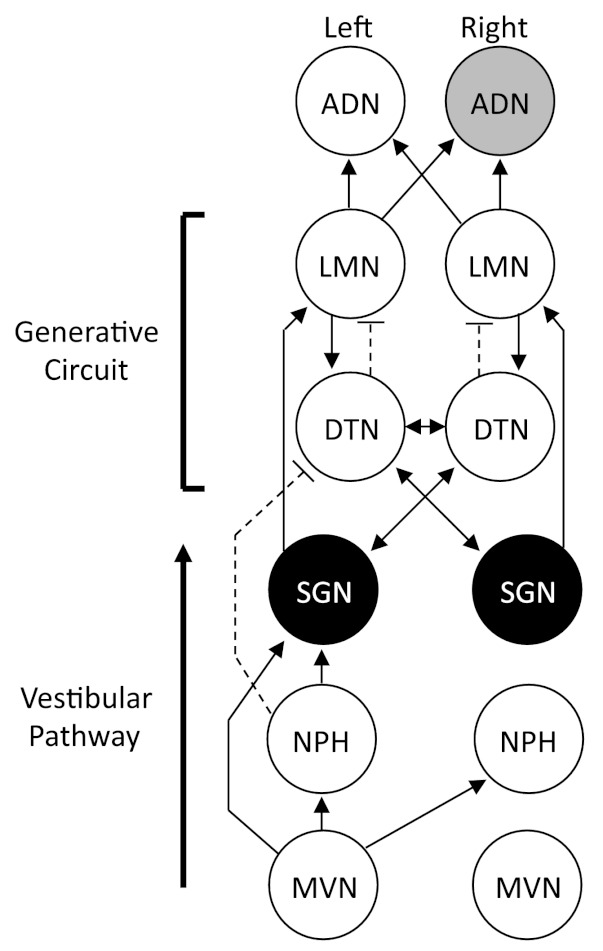
Schematic diagram showing the principal connections between the supragenual nucleus (SGN) and the head direction (HD) cell circuit (reviewed in Taube 2007). The SGN, which is depicted in black, sends projections to the contralateral dorsal tegmental nucleus (DTN) and the ipsilateral lateral mammillary nuclei (LMN; Biazoli et al. 2006; Brown et al. 2005), both of which contain neurons sensitive to HD and angular head velocity. The connections between the DTN and LMN are central to the generation of HD cell activity in the ADN, as well as other cortical and hippocampal areas containing HD cells (Bassett et al. 2007; Blair et al. 1999; Sharp and Koester 2008). Because the SGN receives inputs from the nucleus prepositus hypoglossi (NPH) and the medial vestibular nuclei (MVN), the SGN is a likely source of angular head velocity information to the DTN. Arrows represent direction of information flow between connected areas. Although most connections are excitatory, projections from the NPH → DTN and DTN → LMN are thought to be inhibitory and are indicated by broken lines. Note that in the present study electrodes were implanted in the ADN of the right hemisphere, which is depicted in gray.
The SGN, which is located ventral to the cerebellum and fourth ventricle, sends topographically organized output to the DTN and LMN such that each SGN nucleus sends contralateral projections to the DTN and ipsilateral projections to the LMN (Fig. 1). One interesting feature of this connectivity is that SGN input to the DTN is much stronger than input to LMN (Biazoli et al. 2006). Thus it is possible that projections to the DTN are more significant with respect to the HD circuit. In two experiments, we tested the functional relationship between bilateral SGN output to the HD cell circuit, as well as the importance of the distinct ipsilateral/contralateral output to the tegmento-mammillary circuit. In experiment 1, we produced bilateral lesions electrolytically, thereby completely disconnecting the HD cell circuit of ascending projections from the SGN, and monitored cellular activity downstream (i.e., efferently) in the rodent ADN. In experiment 2, we produced unilateral neurotoxic lesions aimed either to the SGN located contralateral to the ADN electrode implant, thereby disconnecting SGN output to DTN, or ipsilateral to the ADN implant, thereby disconnecting output to the LMN (Fig. 1). It was hypothesized that lesions to the contralateral SGN would have a greater impact on HD signal processing than ipsilateral lesions. In experiment 1 we show that large bilateral lesions of the SGN abolish the HD signal in the ADN, while in experiment 2 we show that unilateral lesions of the SGN significantly impair the stability of their preferred firing directions. Importantly, the latter result demonstrates that unilateral SGN lesions, either ipsilateral or contralateral to the ADN electrode implant, equally disrupt HD cell activity, particularly the capacity of the HD cell system to accurately update directional orientation based on idiothetic information. Previous work has shown that disruption of ascending vestibular input to the HD cell system produces “bursting” cellular activity in the ADN (Muir et al. 2009; Yoder and Taube 2009), which has the appearance of HD cells passing through their preferred directions but is completely uncorrelated with the animal's current HD (see Clark and Taube 2012 for review). Here, we confirm that a subpopulation of ADN neurons also exhibit bursting activity in animals with SGN lesions, further implicating this structure in the processing of idiothetic information. Taken together, these findings provide the first evidence that the SGN plays a pivotal role in processing the limbic HD cell signal and its influence over HD signal processing is distributed across the DTN-LMN generative circuit.
METHODS
Subjects
Adult female Long-Evans rats (n = 42) weighing 300–350 g were used in this experiment. Rats were group housed preoperatively and individually housed postoperatively in plastic cages and kept on a 12:12-h light-dark cycle, with food and water available ad libitum. Subjects were divided into SGN-lesioned (n = 21) and unlesioned control (n = 21) groups. Some of the data from the control group were reported in recent studies (Clark and Taube 2011; Clark et al. 2010) but were collected simultaneously with the present study. All animal procedures were performed with an institutionally approved Institutional Animal Care and Use Committee (IACUC) protocol and in compliance with standards described by the National Institutes of Health Guide for the Care and Use of Laboratory Animals.
Lesions and Electrode Implantation
In the present study, the anatomical boundaries of the SGN were defined on the basis of the plates provided by Paxinos and Watson (1998). It is important to point out that the SGN is sometimes classified as a rostral extension of the NPH (Klop et al. 2005). However, the anatomical study of Klop et al. was conducted in cats, and because the present study used rodents we confine our discussion of SGN to the anatomical studies that have been conducted in rodents. Furthermore, some recent work has confirmed that the input/output relationship of the SGN with HD cell circuitry is particularly distinct from the NPH. Specifically, output from the NPH is restricted to the ipsilateral DTN (Biazoli et al. 2006; Brown et al. 2005), while output from the SGN is largely directed to the contralateral DTN and ipsilateral LMN. Other anatomical studies in rodents (Liu et al. 1984) and rabbits (Hayakawa and Zyo 1985) and other rodent brain atlases (Swanson 1998), as well as a review on the NPH (McCrea 2006), are all in agreement with the anatomical parcellation of SGN and NPH.
To avoid unintentional damage to the DTN or NPH, and to sufficiently damage the SGN, lesions were placed at the following stereotaxic coordinates: −2 mm posterior to lambda (roughly between 10 and 10.3 posterior to bregma) (anterior-posterior), ±0.45 mm from midline (medial-lateral), and −6.9 mm ventral to the surface of the cerebellum (dorsal-ventral) (Paxinos and Watson 1998). Rats received bilateral electrolytic (n = 9) lesions of the SGN in experiment 1 and unilateral neurotoxic (n = 12) lesions in experiment 2. We tried performing several bilateral SGN lesions with a neurotoxin. Unfortunately, however, we were unsuccessful, as many of the animals died—presumably from spread of the toxin to adjacent brain areas critical for sustaining vital physiological processes. Prior to surgery, animals were anesthetized with Nembutal (40 mg/kg ip) and given atropine sulfate (5 mg/kg ip) to prevent respiratory distress. Animals were then placed in a Kopf stereotaxic instrument (David Kopf Instruments, Tujunga, CA), and an incision was made to expose the skull. A craniotomy was made over the SGN, and an insect pin or syringe was lowered to the SGN on one side and left in place for 1 min. Electrolytic lesions were produced by passing 0.3 mA of anodal direct current for 25 s via no. 0 stainless steel insect pins that were insulated to within 1 mm of the tip with Epoxylite. The insect pin was then removed and placed in the contralateral SGN, where the procedure was repeated. Unilateral neurotoxic lesions (left SGN: n = 8; right SGN: n = 4) were produced by injecting 0.15 μl of an 100 mM solution of N-methyl d-aspartate (NMDA; dissolved in 0.9% saline) into each SGN at a rate of 0.05 μl/min through a blunt-tipped 1-μl Hamilton syringe (Hamilton, Reno, NV). To aid diffusion, the syringe was left in place for 3 min. The needle was wiped with distilled water between each injection and was tested to ensure that it was not clogged before being lowered to the next injection site.
As described in previous work from our laboratory (Taube 1995), recording electrodes were implanted in the right ADN of lesioned and control animals. Briefly, a craniotomy was made over the right ADN, and the electrode was implanted at the following coordinates: −1.7 or −1.9 mm posterior to bregma, 1.3 mm right of the midline, and −3.7 mm from the cortical surface (Paxinos and Watson 1998). Electrodes were built as described previously (Kubie 1984) and consisted of a bundle of ten 25-μm nichrome wires insulated to the tip. The wires were threaded through a 26-gauge stainless steel cannula and connected to a modified Augat plug that was fixed to the skull with dental acrylic but could be manipulated in the dorsal/ventral plane. Rats were given postsurgical analgesia with buprenorphine (0.015 mg/kg).
Cell Screening Procedures
To allow comparison with prior studies from our laboratory (e.g., Clark and Taube 2011; Clark et al. 2010; Goodridge and Taube 1997; Taube 1995), a 7-day recovery period was provided before electrodes were screened for cellular activity. Cell screening was performed while rats foraged for 20-mg food pellets (Bio-Serv, Frenchtown, NJ) scattered on the floor of a high-walled gray cylinder (76-cm diameter, 50-cm height). A white cue card attached to the inside wall of the cylinder (∼100° of arc) served as the sole visual landmark, and black floor-to-ceiling curtains surrounding the cylinder minimized extramaze cues. The cylinder floor was lined with gray paper and was changed between screening sessions. To detect cell activity, electrical signals were passed through a field-effect transistor in a source-follower configuration. Signals were amplified by a factor of 10,000–50,000 (Grass Instruments, West Warwick, RI), band-pass filtered (300–10,000 Hz, ≥3 dB/octave), and sent through a dual-window discriminator (BAK Electronics) for spike discrimination. A color video camera was centered above the cylinder (model XC-711; Sony, Tokyo, Japan). The position and directional orientation of the rat were determined by an automated video tracking system (Ebtronics, Elmont, NY). This video tracking hardware provided x and y coordinates of red and green light-emitting diodes (LEDs) secured 10 cm apart above the head and back of the animal, respectively. The HD of the animal was determined by the relative position of the red and green LEDs. Monitoring of cellular activity continued until each of the 10 implanted wires had been examined for HD cells or other cellular activity. If no isolatable cells were detected, the electrode was advanced 25–50 μm and the animal was returned to its home cage and monitored again either 4 h later or the next day. If an isolatable cell was identified, the cell was recorded for an 8-min session and its firing properties were evaluated. In cases in which HD cells were recorded, the animal was removed from the cylinder and placed in a cardboard box located outside the curtained-off area (without detaching the recording cable) and the apparatus was prepared for three different tests of landmark and idiothetic cue processing (Fig. 2). For each experiment below, the floor paper was replaced between testing sessions to control for olfactory cues, and white noise was played from an overhead speaker to help mask surrounding auditory cues.
Fig. 2.
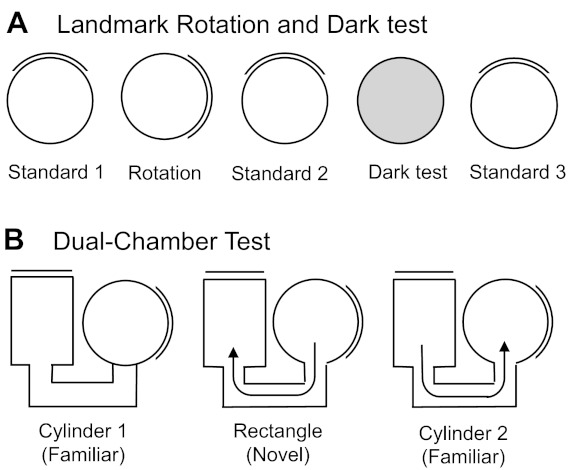
A: overhead view of the landmark rotation and dark test sessions. Each session, except the dark test, was separated by disorientation treatment. B: overhead view of the dual-chamber test sessions. The door to the rectangle was closed when the animal entered the rectangle. The door to the cylinder was closed during both cylinder sessions (cylinder 1 and cylinder 2). Because the rats had no prior experience in the rectangle enclosure, this environment was considered novel.
Landmark rotation test.
The experiment consisted of three separate 8-min sessions (Fig. 2A). First, a standard session (standard 1) was performed in which HD cell activity was recorded while the rat foraged for food pellets in the cylinder. This session was followed by a rotation session in which the visual landmark was rotated 90° in either the clockwise (CW) or counterclockwise (CCW) direction. The rotation of the cue always occurred while the animal was in the cardboard box. Finally, the third session consisted of returning the cue card to its original position during the first session (standard 2). Animals were given disorientation treatments prior to each recording session, which consisted of placing the animal in a cardboard box and rotating it slowly (0.2–0.5 Hz) while the experimenter simultaneously walked around the testing room twice. This disorientation was used to prevent the animal from using idiothetic cues to maintain orientation from one session to the next.
Dark test.
This test consisted of recording HD cell activity with the visual landmark removed and the room lights turned off (Fig. 2A). Prior to the dark test, the animals were removed from the cylinder and placed in a cardboard box while the floor paper was replaced and the cue card removed from the cylinder. To start the test, the room lights were turned off and the rat was gently placed in the cylinder and allowed to forage for food pellets for 8 min. Animals were not disoriented prior to being placed in the cylinder for dark testing. To track the HD of the rat, the red and green LEDs remained on during the dark session. Although rats cannot see well in the red color spectrum (Neitz and Jacobs 1986), they can see green light. It is important to note, however, that the gray cylinder was largely homogeneous and did not contain obvious environmental cues that could be used for orientation. Thus it is likely that animals, in large part, relied on idiothetic cues to maintain orientation in darkened conditions (Goodridge et al. 1998).
Standard 3.
After the 8-min dark test was complete, animals were removed from the cylinder and a final 8-min standard session (standard 3) was conducted in which the room lights were turned back on, the floor paper replaced, and the cue card returned to its original position from the previous standard sessions (Fig. 2A). Rats were given a disorientation treatment before being placed in the cylinder for standard 3.
Dual-chamber test.
Figure 2B illustrates an overhead view of the dual-chamber apparatus, which is composed of two gray-colored compartments, a cylinder similar to those used in the previous experiments (76 cm in diameter) and a rectangle (51 cm × 69 cm), interconnected by a narrow U-shaped passageway (41 cm × 15 cm). The walls along one side of the alleyway were slanted by ∼15° in order for the overhead video camera to view all areas of the passageway. A section of wall in each enclosure could be removed to control access between the two compartments and passageway. The walls of the rectangle were featureless except for a white cue card positioned along the wall such that it was rotated 90° CCW with respect to the cue card in the cylindrical compartment. The floors of the cylinder and rectangle were composed of gray photographic backdrop paper that was changed between animals; however, the passageway contained a gray painted wooden floor.
The cylinder enclosure in the dual-chamber apparatus was similar to the cylinder in which the rats had been trained and screened in for several weeks; thus it was considered a familiar environment to the animals. The passageway and the rectangle represented a novel environment because the animals had no previous exposure to them. HD cells in control animals typically maintain a similar preferred firing direction between both compartments of the dual-chamber apparatus (Taube and Burton 1995), and it is has been shown that idiothetic cues available during the animal's journey from the cylinder to the rectangle are crucial for maintaining a stable preferred direction (Stackman et al. 2003). The procedure for the dual-chamber experiment consisted of three phases. First, the animal was placed in the cylinder portion of the apparatus with the door to the passageway closed (cylinder 1 session). After the animal was allowed to forage for food pellets scattered on the floor for 4 min, the cylinder compartment door was opened and the animal was free to walk into the passageway and enter the rectangle. Upon the animal entering the rectangle, the hidden door was closed, trapping the animal inside the rectangle environment while the activity of the HD cell was monitored for 10 min (rectangle session). After the rectangle session, the door to the rectangular compartment was opened and the rats were allowed to locomote back through the passageway to the cylinder, where they were again trapped while HD cell activity was monitored for another 4 min (cylinder 2 session). The dual-chamber apparatus experiment was conducted only once per animal since the task requires the rectangular compartment to be novel. Thus only one HD cell recording session was collected per animal in this task.
Data Analysis
An automated video computer tracking system, sampling at 60 Hz, recorded the number of spikes occurring during each sample period while simultaneously recording the x, y positions of each LED. Data analysis was accomplished off-line with custom software (LabVIEW, National Instruments, Austin, TX). The animal's HD was sorted into sixty 6° bins. Neural activity was classified as HD cell activity when the firing clearly correlated with a single direction, independent of the animal's ongoing behavior. To determine whether putative HD cells were significantly modulated by the animal's directional heading, we performed Rayleigh tests (Batschelet 1981) on the recorded cell's firing rate vs. HD tuning curve (Bassett et al. 2007; Muir et al. 2009; Yoder and Taube 2009). This statistical test involves computing the mean vector length, r, based on the cell's firing over 360° (Batschelet 1981). Mean vector lengths range between 0 and 1, with higher values indicating that spike occurrence is clustered around a particular direction. The critical significance level of r is then determined by the number of observations (which was defined as the sum of all firing rates from the 60 directional bins), and if the r value meets this significance level, the distribution is considered to be directional. Similar to recent studies, we adopted a criterion of r ≥ 0.40 for a cell to be considered directionally modulated, although r values from “classic” HD cells typically fall in the range of 0.5–0.9 (Muir et al. 2009; Yoder and Taube 2009). HD cells from lesioned and control animals were compared on several basic directional characteristics measured during the standard 1 session: peak firing rate, background firing rate, directional firing range, directional information content, and anticipatory time interval. The preferred direction was defined as the directional bin with the highest firing rate. The peak firing rate was the firing rate corresponding to the preferred direction. The directional firing range was defined as the width at the base of a triangle fit to a firing rate vs. HD plot. The background firing rate was the mean firing rate of all bins ≥18° outside the cell's directional firing range. Directional information content is a measure of how many bits of HD information is conveyed by each spike (Skaggs et al. 1993) and was calculated by the following formula: directional information content =∑pi(li/l)log2(li/l), where pi is the probability that the head pointed in the ith directional bin, li is the mean firing rate for bin i, and l is the mean firing rate across all directional bins.
The anticipatory time interval is a measure of the amount of time that cell firing best predicts where the animal will be pointing its head in the future. Previous work has estimated that the activity of ADN HD cells anticipates future head directions by ∼25 ms (Blair and Sharp 1995; Taube and Muller 1998). We compared the anticipatory time interval of cells from control and lesioned animals, using the methods of Blair and Sharp (1995). First, firing rate vs. HD plots were constructed for each HD cell by dividing the 360° directional range into sixty 6° bins and then calculating the average firing rate for each bin. Firing rate vs. HD plots were then constructed for CW and CCW directions, and the difference between the preferred firing directions for the two functions (i.e., separation angle) was determined. The spike record was then shifted forward and backward in time in steps of 16.67 ms (the maximum temporal resolution of the recording hardware), and the separation angle between the CW and CCW functions for head movements ≥90°/s was computed for each shift. The spike series was shifted incrementally ±6 times (±100 ms) relative to the HD series, providing 13 values of CW-CCW separation angles. A scattergram was then constructed from the 13 CW-CCW separation angles and their corresponding time shift. The x-intercept of the best-fit line of this plot is referred to as the anticipatory time interval and is equivalent to the amount of time that the spike series has to be shifted to achieve overlapping CW and CCW functions. Cells with insufficient CW and CCW sampling (≥1 directional bin with no data) were not included in this analysis. With this criterion, nine cells were removed from the control group and six cells were removed from the lesion group for the analysis conducted on session 1 data in experiment 2.
The spike trains of HD cells and in some cases nondirectional cells generally included periods of high activity resembling bursts punctuated by periods of low activity. In the case of HD cells, the occurrence of bursting activity is nonperiodic because the spikes are modulated by the animal's HD. Thus to quantify the bursting characteristics of HD cells as well as nondirectional cells, we used a “burst index” measure introduced by Yoder and Taube (2009). The burst index computes the amount of time a cell fires in high-frequency bursts or is inactive. Burst index scores are measured on a scale of 0 to 1, with higher values representing cells that are “bursting” and lower values representing cells that fire at a relatively constant rate. For this measure, spikes were sorted into 1-s bins from the beginning to the end of the recording session. The burst index was calculated using the following formula: burst index = (no. of bins > 1.75 × mean firing rate) + (no. of bins < 0.25 × mean firing rate)/no. of total bins. The mean firing rate was defined as the total number of spikes in the session divided by the total time.
Circular statistics (Batschelet 1981) were used to determine the stability of the directional signal between the landmark rotation sessions, standard sessions, and the three dual-chamber sessions. Angular shift scores across testing sessions were calculated with a cross-correlation method. This approach involves shifting the firing rate vs. HD function of the first session in 6° increments while correlating this shifted function with the nonshifted function from the other session. The amount of shift required to produce the maximal Pearson r correlation between the two sessions is defined as the angular shift score between the sessions. These values were then subjected to Rayleigh tests to determine whether the scores were distributed randomly or the preferred directions tended to shift in the same direction and amount. ANOVAs and t-tests were utilized for group comparisons of the basic directional characteristics and absolute angular shift scores produced during the different test sessions. For ANOVAs, violations of homogeneity of variance were corrected with Welch's F-test. All statistical analyses were performed with SPSS (Statistical Package for the Social Sciences) version 20.0.
Histology
Animals were deeply anesthetized with an overdose of pentobarbital sodium. The locations of the recording electrodes were marked by passing anodal current through an electrode wire (20 μA, 15 s) for a Prussian blue reaction. The rats were perfused intracardially with saline followed by a 10% formalin solution. Brains were removed from the skulls and postfixed in a 10% formalin solution with 2% potassium ferrocyanide for 24 h. The brains were cryoprotected in a 20% sucrose solution for at least 48 h and then frozen and sectioned in the coronal plane in 30-μm slices with a cryostat. Every section through the SGN was taken, as well as every other section through the ADN. Sections were mounted on glass slides, stained with thionin, and examined under a microscope to determine electrode location and extent of the lesion.
Electrolytic damage to the SGN resulted in the complete loss of tissue residing above the dorsal surface of the VIIth cranial nerve, and was therefore easily quantified (i.e., if no tissue was observed in this region then the SGN was considered fully lesioned). Successful NMDA lesions were determined on the basis of a marked loss of neurons and a significant increase in gliosis in the SGN region. To quantify the volume of remaining healthy SGN tissue (i.e., the presence of large neurons and absence of gliosis), digital images were captured at two rostral-caudal levels (10 mm and 10.3 mm posterior to bregma). The area of undamaged tissue in the SGN was calculated at each rostral-caudal level with ImageJ software (http://rsb.info.nih.gov/ij/index.html). Once the area of undamaged tissue was calculated, the area of spared tissue was summed across the two sections and compared with the average area measured in control rats. The total amount of damage was calculated with the following formula: tissue damaged (%) = [average area of SGN in control rats (pixels2) − total area of spared SGN tissue in lesioned rats (pixels2)/average area of SGN in control rats (pixels2)] × 100.
The extent of the recording electrode tracks through the ADN was visible from the Prussian blue marks at the electrode tips. The position of the ventral-most point relative to the boundaries of the ADN was used to estimate the portion of the screening record that could have conceivably fallen within the ADN. All isolated cells were evaluated for directional modulation, but only cells recorded inside the ∼1 to 1.5 mm dorsal-ventral sampling range of the ADN were considered part of the experimental sample for the purposes of estimating the incidence rate of directional modulation.
RESULTS
Experiment 1: Cellular Activity in ADN of Rats with Bilateral Electrolytic Lesions of SGN
Histology.
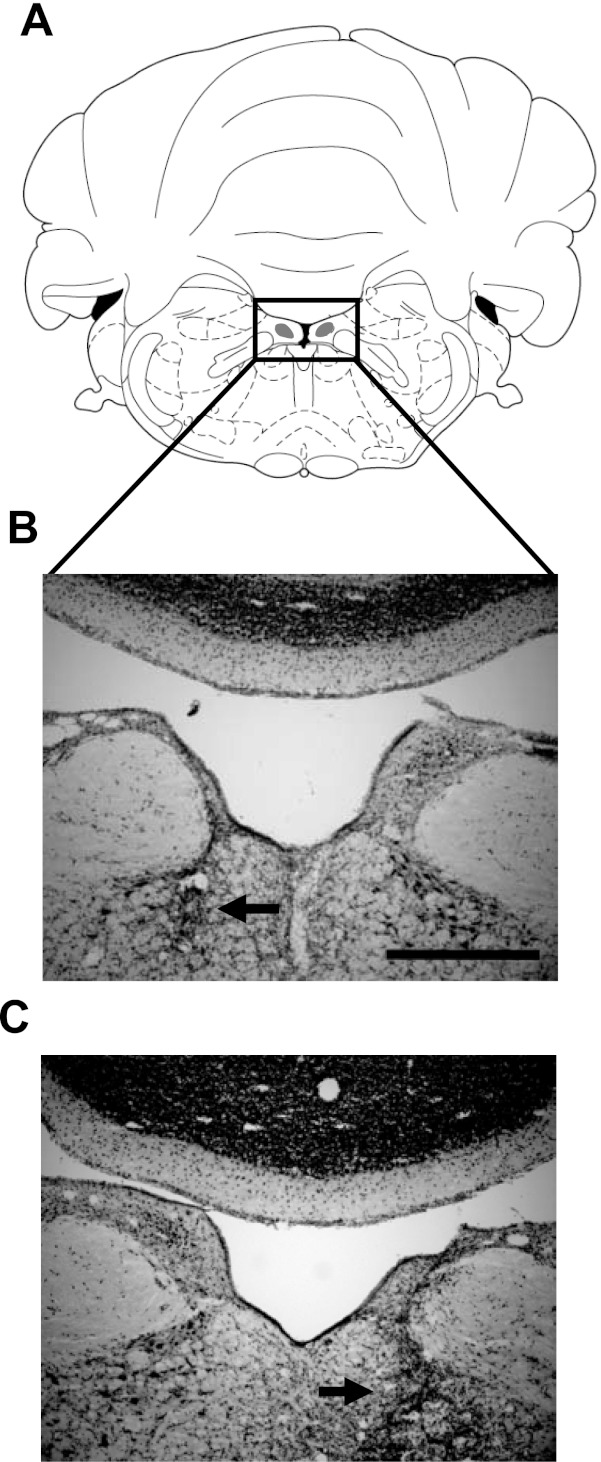
Figure 3 depicts a coronal section through the SGN of representative control (Fig. 3B) and electrolytic lesioned (Fig. 3, C and D) animals. Overall, lesions of the SGN were large, ranging from 77.3% to 100% of the total volume of SGN (mean ± SE: 95.5 ± 2.6%). Four of nine lesioned animals showed evidence of healthy SGN tissue, which in three cases was confined unilaterally (ipsilateral to the electrode implant = 1; contralateral to the electrode implant = 2) and in one case bilaterally. Lesions frequently produced unintentional damage to brain stem structures located ventral to the SGN, including the central gray of the pons, olivocochlear bundle, abducens nuclei, genu of the facial nerve, and the medial longitudinal fasciculus (mlf). More rarely, the lesions extended dorsal to the SGN and into the cerebellum, specifically the first cerebellar lobule (e.g., Fig. 3C). Importantly, damage to the mlf was large (e.g., Fig. 3D) and possibly complete in five animals. Because the mlf is known to convey vestibular information to several brain stem and thalamic nuclei, it is possible that fibers carrying vestibular information to the DTN were damaged. Nevertheless, Frohardt et al. (2006) described two rats that received complete transection of the mlf and observed that the animals were unimpaired in a navigation task that requires an intact HD cell circuit. Although this result suggests functional independence between the HD cell system and the mlf, below we provide some qualitative comparisons between animals with and without mlf damage.
Fig. 3.
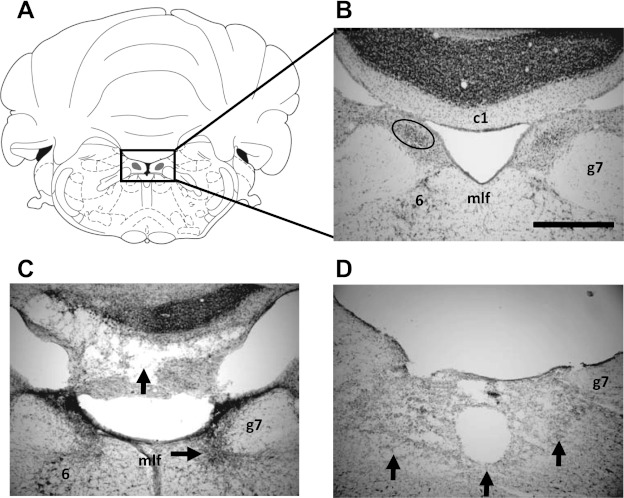
A: plate reproduced with permission from Paxinos and Watson (1998) showing the SGN at 10.3 mm posterior to bregma. B: enlarged view of the boxed area in A showing the SGN (circled region). Also visible are other structures that were sometimes damaged with the lesion: the abducens nuclei (6), genu of the facial nerve (g7), and the first cerebellar lobule (c1). mlf, Medial longitudinal fasciculus. Scale bar, 500 μm. C and D: representative sections from electrolytic lesioned rats (sg1 and bc228, respectively) with complete loss of tissue in the immediate vicinity of the SGN. The horizontal arrow in C shows gliosis extending ventrally into the abducens nucleus, and the vertical arrow in C points to damage of the first cerebellar lobule. The vertical arrows in D show the extent of damage ventral to the SGN, which included the entire mlf in this animal. The first cerebellar lobule is not visible in this section but was not damaged in this animal.
SGN lesions did not extend laterally into the vestibular nuclei, but they often included structures located rostral and caudal. Most important of the rostral structures is the posterior DTN, which in some cases (n = 3) received significant damage (>50%). Unlike the central zone of the DTN, vestibular information does not converge on the posterior DTN because of the absence of direct inputs from SGN or vestibular nuclei (Biazoli et al. 2006). However, it does provide a strong projection to the HD circuit (Brown et al. 2005) and reportedly contains neurons sensitive to angular head velocity (Sharp et al. 2001b). In light of this consideration, we also provide below some qualitative comparisons of this small subgroup of animals with other rats in the lesioned group. The NPH, which is positioned caudal to the SGN, received minor damage (∼10–20%) in most animals. Table 1 summarizes the extent of lesions to the SGN, the amount of damage to posterior DTN and mlf, and the firing characteristics of ADN cells for each animal included in the experiment. Finally, it is important to mention that we did not observe any noticeable changes in posture, locomotion, or oculomotor function after SGN lesions.
Table 1.
Summary of histological results and incidence of HD and bursting cell activity in animals with bilateral electrolytic lesions of the SGN
| Rat | Lesion Size, % | Tissue Sparing | Additional Damage | Total Cells | HD Cells | Bursting Cells |
|---|---|---|---|---|---|---|
| jb41 | 100 | pDTN, mlf | 12 | 0 | 1 | |
| sg1 | 100 | 9 | 0 | 0 | ||
| sg2 | 96.3 | Right SGN | 6 | 1 | 1 | |
| sg3 | 77.3 | Left SGN | 7 | 2 | 0 | |
| sg4 | 100 | mlf | 7 | 0 | 1 | |
| sg6 | 96.4 | Left SGN | mlf | 5 | 1 | 2 |
| bc227 | 100 | pDTN, mlf | 7 | 0 | 0 | |
| bc228 | 100 | pDTN, mlf | 7 | 0 | 0 | |
| bc229 | 89.7 | Bilateral | 16 | 0 | 10 |
All recordings were conducted in the right anterodorsal thalamus (ADN). Column listing additional damage lists only the regions that may have an influence on head direction (HD) cell activity because of confirmed connectivity. SGN, supragenual nucleus; mlf, medial longitudinal fasciculus; pDTN, posterior dorsal tegmental nucleus.
Electrode arrays were judged to have advanced completely through the ADN in all animals. In lesioned rats, electrodes generally passed through the ADN between 1.3 and 1.8 mm posterior to bregma (Paxinos and Watson 1998). Similar electrode placements were observed in control animals. Figure 4 shows the electrode location in a representative section from an electrolytic lesioned rat.
Fig. 4.
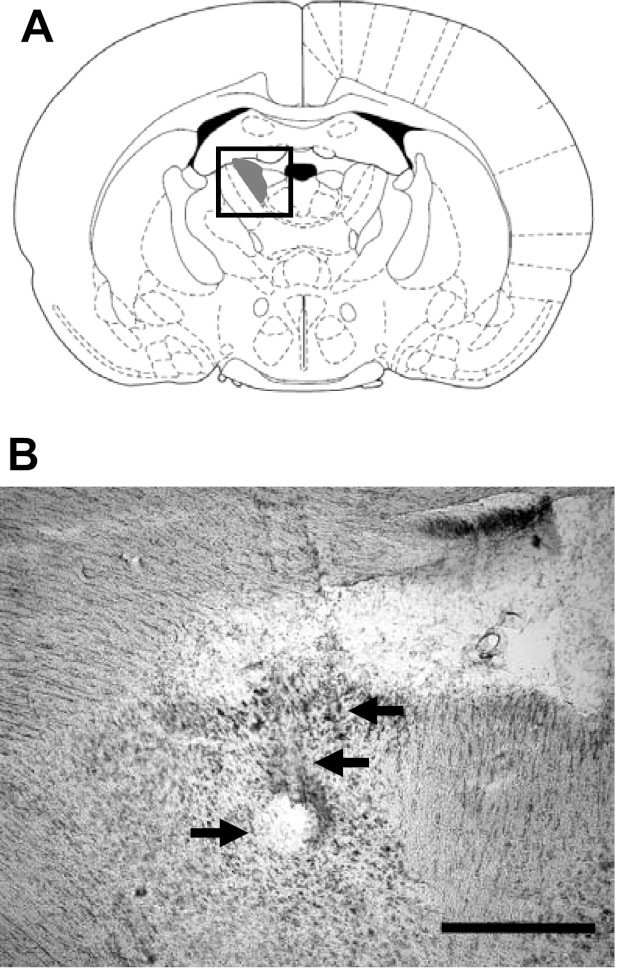
A: plate reproduced with permission from Paxinos and Watson (1998) showing the ADN at −1.4 mm relative to bregma. B: enlarged view of the boxed region in A showing the electrode wire tracks through the ADN (arrows pointing left) and the Prussian blue mark below the ADN (arrow pointing right) in a representative electrolytically lesioned rat (sg1). Scale bar, 500 μm.
HD cells.
Figure 5 plots the firing rate vs. HD functions of representative HD cells recorded in the control group and all HD cells recorded in the lesioned group. Overall, only 4 of 76 neurons (5.3%) were identified as HD cells within the dorsal-ventral extent of the ADN in the lesioned group (Fig. 5B) (Rayleigh r ≥ 0.4). The remaining cells were classified as nondirectional. In contrast to the small overall percentage of HD cells recorded in lesioned rats, 79 of 163 (48.5%) were identified as HD cells in control animals (Fig. 5A; mean Rayleigh r = 0.731 ± 0.017). A mean comparison of the percentage of HD cells/rat confirmed a significant difference between lesioned (7.3 ± 3.77%) and control [49.8 ± 4.19%; t(26) = −6.39, P < 0.001] groups. One cell that was not initially classified as directional, and did not pass the Rayleigh criterion (r = 0.35), showed some evidence of directional modulation (Fig. 5C, far left); however, even with this cell included, the group differences remained highly significant [t(26) = 6.31, P < 0.001]. Importantly, each HD cell recorded in the lesioned group came from animals with incomplete lesions (see Table 1), suggesting that small populations of SGN neurons can sustain directional activity in the ADN. Nevertheless, even with small amounts of remaining SGN tissue, there was a significant difference between this partial lesion subgroup and control animals in the percentage of HD cells/rat [t(21) = 3.36, P = 0.003]. With respect to individual differences in the lesioned group, there was no obvious influence in the amount or location (contra- or ipsilateral) of spared SGN tissue. Furthermore, there was no obvious influence of damage to the mlf or posterior DTN. For instance, rat 2 had a complete SGN lesion with no significant damage to mlf or posterior DTN, and, importantly, no HD cells were recorded in the ADN. Taken together, damage specific to the SGN is the most likely cause of the abolished HD cell signal.
Fig. 5.
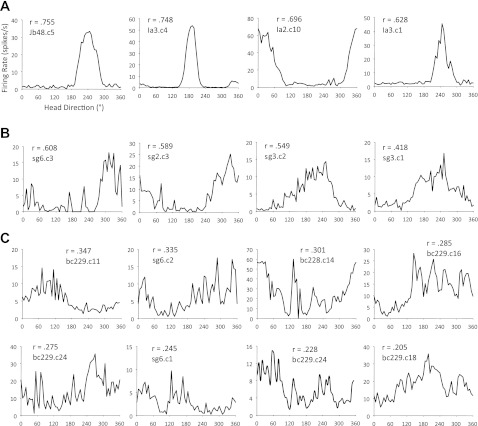
A: firing rate vs. HD plots for representative HD cells recorded in control animals. Cells shown have Rayleigh r values (inset) similar in magnitude to the group average (r = 0.731). B: firing rate vs. HD plots are shown for all cells recorded in lesioned animals that were classified as directionally modulated according to a Rayleigh r value of ≥0.40. C: firing rate vs. HD functions for cells from lesioned animals that approached, but did not surpass, the Rayleigh cutoff. Note that 1 cell had some modest directional modulation (C, top left); however, directional modulation was largely absent for the remaining cells.
To determine whether differences in the frequency of different angular head velocities could account for the weak directional signal, we examined the distribution of angular head velocities over the course of the standard session for cells (HD and nondirectional cells) recorded in each group (Bassett et al. 2005). Figure 6 plots this distribution and shows that animals with SGN lesions had a higher probability of low angular head velocities (between −30°/s and +30°/s) compared with control animals. This observation is confirmed by a significant group difference in the instantaneous angular head velocity between control (34.7 ± 1.09°/s) and lesioned (24.6 ± 2.29°/s) animals [t(112) = 0.721, P < 0.001]. Although this finding supports the conclusion that differences in angular head velocity may have contributed to the results of the present study, previous work has shown that angular head velocity accounts for only a small fraction of the firing properties of HD cells (Taube 1995). Furthermore, it is important to note that although the lesioned group generally had lower angular head velocities than the control group, all angular head velocities, including high ones, were present in the lesioned group. Thus it is more likely that the loss of directional tuning stems from the disruption of SGN input rather than the slower angular head movements of lesioned animals.
Fig. 6.
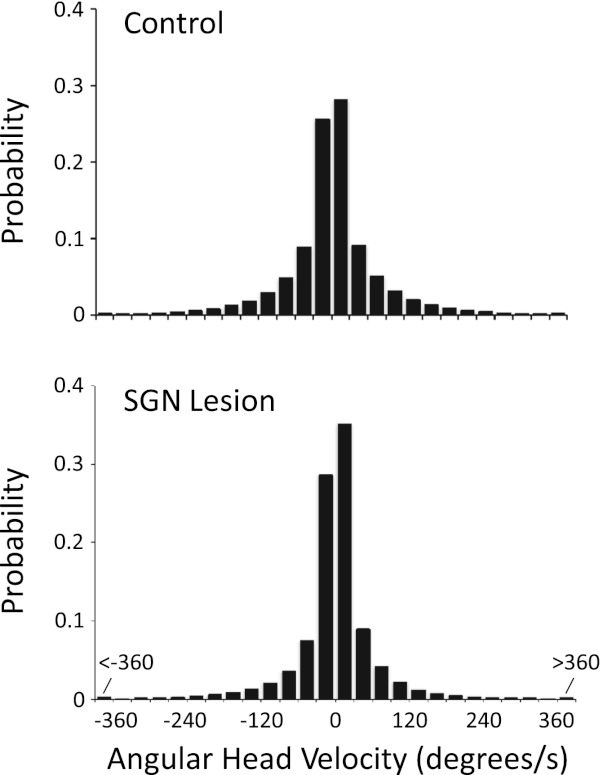
Histograms showing the probability of angular head movements occurring at angular head velocities grouped in 30°/s bins and according to clockwise (CW, +) or counterclockwise (CCW, −) head turns. The distributions are taken from the cells recorded in control (top) and lesioned (bottom) animals during standard sessions. Note the larger values for the 2 bins surrounding 0°/s for the SGN lesion group compared with the control group, indicating that the lesioned animals turned their heads less frequently than the control animals.
Although a small sample of HD cells was observed in lesioned rats, the directional specificity displayed by these neurons was disrupted (compare Fig. 5, A and B). In particular, the four HD cells in the lesioned group had measures of directional information content (0.798, 0.772, 0.553, and 0.391 bits/spike) and Rayleigh r values (0.608, 0.589, 0.549, and 0.418) that were lower than the mean values computed for the control group (directional information content: 1.33 ± 0.07 bits/spike; Rayleigh r: 0.731 ± 0.017). Furthermore, in three of four cases, measures of the directional firing range (244.4°, 235.5°, 201.9°, and 94.8°) were twice as large as the mean from the control group (103.8 ± 3.77°). We also observed that all four HD cells displayed moderate instability or drift in their preferred firing directions during the standard 1 session. To quantify intrasession drift, we calculated the mean absolute shift in the preferred direction between sequential 1-min epochs for each cell in each group (i.e., the mean change in preferred direction between 0–1 min and 1–2 min, between 1–2 min and 2–3 min, etc.). This analysis indicated that the intrasession drift observed for the lesioned group (66.9, 62.5, 43.9, and 35.8°/min) was generally higher than the average computed for the control group (14.6 ± 1.1°/min). Indeed, only four HD cells in the control group drifted >30°/min, while all four cells in the SGN-lesioned group drifted >30°/min, with two cells drifting >60°/min. Importantly, these latter two cells were recorded in rat 4, which sustained no significant damage to the posterior DTN or the mlf.
In addition to the weak and unstable directional tuning displayed by the four HD cells described above, we identified a small population of nondirectional cells (n = 15; 19.7%) in lesioned rats that fired in nonrhythmic bursts, which had the appearance of HD cells passing through their preferred directions when listened to through a loudspeaker. These observations resembled the “bursting” cellular activity reported in the ADN after peripheral vestibular lesions in previous work (Muir et al. 2009; Yoder and Taube 2009). Unlike the directionally unstable HD cells described above, this bursting activity was completely uncorrelated with the animal's HD, even at brief time intervals (e.g., 1 min). These characteristics can be observed in Fig. 7, which shows the spike × time functions (Fig. 7, left) and corresponding firing rate × HD plots (Fig. 7, right) for HD cells recorded in a control animal (Fig. 7A, top) and a lesioned animal (Fig. 7A, bottom), a nondirectional bursting cell (Fig. 7B), and a nondirectional/nonbursting cell (Fig. 7C). Note that in the spike × time plots the two HD cells (Fig. 7A) and the bursting cell (Fig. 7B) have similar activity patterns characterized by prominent bursts of activity followed by periods of silence. The main difference between the plots in Fig. 7, A and B, is that the bursting cell shows no evidence of directional modulation. In contrast, the firing characteristics of most nondirectional/nonbursting cells displayed a continuous moderate baseline firing rate (Fig. 7C). These properties can also be characterized with a burst index, which computes the amount of time a cell fires in high-frequency bursts or is inactive (see methods; Yoder and Taube 2009). Neurons qualitatively classified as bursting had index scores >0.4 (0.586 ± 0.030, range: 0.412–0.854). Similarly, all but two HD cells (pooled from control and lesioned animals) had burst index scores >0.4 (0.704 ± 0.018, range: 0.296–0.925), suggesting that bursting cells and HD cells share similar burst firing characteristics. In contrast, however, only three neurons classified as nondirectional/nonbursting neurons (pooled from control and lesioned animals) had index values >0.4 (0.138 ± 0.022, range: 0.004–0.565), indicating that HD cells and bursting cells are distinct from the firing activity of other cell types.
Fig. 7.
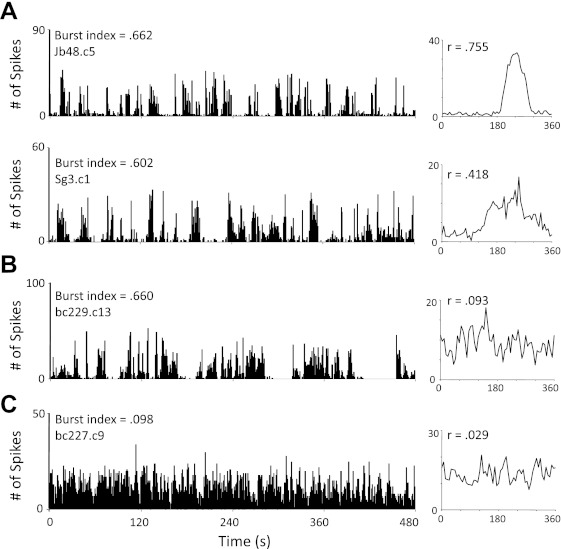
A, left: plot depicting a spike vs. time (s) function for a representative HD cell in a control (top) and an SGN-lesioned (bottom) rat. Right: each cell's corresponding firing rate vs. HD plot (inset, Rayleigh r value). B: spike vs. time (left) and firing rate vs. HD (right) plots for a cell classified as bursting. Note that this cell has a temporal firing pattern similar to the HD cells in A; however, the cell was not directionally modulated, as indicated by its low Rayleigh r value. C: spike vs. time (left) and firing rate vs. HD (right) plots for a cell identified as nondirectional/nonbursting. Note that this cell's burst index score is lower than the HD cells in A and the bursting cell in B.
Despite the presence of small numbers of bursting cells in the ADN of control animals, neurons with bursting activity were more likely to be observed in lesioned animals (5 of 9) compared with control animals [3 of 21; χ2(1) = 5.49, P = 0.02]. It is unclear, however, why bursting neurons were only observed in a subset of lesioned animals (see Yoder and Taube 2009 for a similar observation). This result does not appear to be related to complete versus incomplete lesions because bursting cells were observed in both subgroups (see Table 1). In addition, the presence of bursting activity does not appear to be related to the presence of additional damage to the mlf or posterior DTN, because animals without significant damage to both of these structures had bursting cells identified in their ADN (Table 1).
To summarize, the results from experiment 1 demonstrate that large bilateral electrolytic lesions of the SGN abolish direction-specific firing in the ADN; however, small amounts of sparing in this region can sustain a weak, unstable directional signal. To further test the importance of the SGN to HD signal processing, experiment 2 examined the relative contribution of distinct SGN output to the DTN vs. LMN. Two groups of rats were given unilateral neurotoxic (NMDA) lesions—either to the SGN contralateral to the electrode implant (n = 8) or to the SGN ipsilateral to the implant (n = 4). Because our ADN electrode implants were localized to the right hemisphere, we hypothesized that lesions to the SGN contralateral to the ADN would disconnect ascending DTN input to that hemisphere, whereas lesions to the SGN ipsilateral to the ADN electrode would disrupt ascending LMN projections (see Fig. 1). As noted above, electrolytic lesions sometimes disrupted the mlf, which may provide vestibular information to the HD cell circuit. Thus, to avoid damaging mlf, lesions were produced with the fiber-sparing neurotoxin NMDA.
Experiment 2: Cellular Activity in Rats with Unilateral Neurotoxic Lesions of SGN
Histology.
Overall, neurotoxic lesions produced significant damage (>60%) to the unilateral SGN in all animals (n = 12) (Fig. 8). Unilateral damage was large in six animals, ranging from 90% to 100% (4 contralateral and 2 ipsilateral). In the remaining six animals, the lesions were smaller, ranging from 60% to 80% (4 contralateral and 2 ipsilateral). For most animals in this latter group, the lesions were smaller because the syringe was unintentionally placed either slightly rostral or caudal (approximately ±0.75 mm), which in three cases had the effect of producing unilateral damage to the posterior DTN (∼20%) and in two cases damaged the NPH unilaterally (∼20%). In other animals, damage to the posterior DTN and NPH was minimal (<10%). In addition, partial unilateral damage (∼20–30%) was observed in the abducens nucleus in most animals. Damage to the central gray of the pons was observed unilaterally in most animals; however, this damage was unavoidable because of its close proximity to the SGN. Importantly, the mlf was not damaged in any of the animals, thereby precluding the possibility that ascending vestibular axons through this pathway contributed to the results reported below. Electrode arrays were judged to have advanced completely through the ADN in all animals. Table 2 summarizes the extent and hemisphere of SGN lesions, damage to other brain areas, and firing characteristics of ADN cells for each animal included in experiment 2.
Fig. 8.
A: section at −10.3 mm relative to bregma reproduced with permission from Paxinos and Watson (1998). B: corresponding section from a rat with complete neurotoxic damage to the right SGN (ipsilateral to the electrode implant; jb25). Note that complete sparing of the left SGN occurred in this animal. Scale bar, 500 μm. C: section from an animal with complete neurotoxic damage to the left SGN (contralateral to the electrode implant; jb28). Note that the right SGN is completely spared. Horizontal arrows in B and C indicate regions where the lesion extended ventrally.
Table 2.
Summary of histological results and incidence of HD and bursting cell activity in unilateral neurotoxic lesions of the SGN
| Rat | Lesion Site (Volume) | Additional Damage | Total Cells | HD Cells | Bursting Cells |
|---|---|---|---|---|---|
| jb23 | Contralateral (60%) | 6 | 2 | 2 | |
| jb28 | Contralateral (100%) | 7 | 2 | 1 | |
| jb40 | Contralateral (80%) | pDTN | 7 | 1 | 0 |
| bc171 | Contralateral (80%) | pDTN | 15 | 10 | 3 |
| bc172 | Contralateral (90%) | 8 | 1 | 4 | |
| bc198 | Contralateral (90%) | 5 | 3 | 0 | |
| bc199 | Contralateral (80%) | Rostral NPH | 9 | 5 | 1 |
| bc200 | Contralateral (100%) | pDTN | 16 | 10 | 1 |
| jb24 | Ipsilateral (60%) | Rostral NPH | 6 | 1 | 0 |
| jb25 | Ipsilateral (100%) | 10 | 0 | 0 | |
| bc167 | Ipsilateral (100%) | 9 | 9 | 1 | |
| bc169 | Ipsilateral (60%) | 8 | 7 | 0 |
All recordings were conducted in the right ADN. Column listing additional damage lists only the regions that may have an influence on HD cell activity because of confirmed connectivity. NPH, nucleus prepositus hypoglossi.
HD cells.
A total of 73 cells were isolated in rats with contralateral lesions, and 33 cells were isolated in ipsilaterally lesioned rats. Of these cells, 34 cells were classified as directionally modulated in contralaterally lesioned animals (46.6%) and 17 cells in ipsilaterally lesioned animals (51.5%). A one-way ANOVA on the percentage of HD cells/rat failed to reveal a significant group effect between contralateral (41.7 ± 7.8%) and ipsilateral (51.0 ± 25.0%) lesion groups and between the lesion and control groups [49.8 ± 4.2%; F(2,6.5) = 0.39, P = 0.69].
Measures of HD cell firing characteristics failed to identify significant group differences on measures of directional information content [contralateral: 1.39 ± 0.26, ipsilateral: 1.03 ± 0.12, control: 1.33 ± 0.07 bits/spike; F(2,96) = 0.610, P = 0.545], peak firing rate [contralateral: 45.7 ± 5.5, ipsilateral: 30.7 ± 5.0, control: 42.6 ± 2.8 spikes/s; F(2,96) = 1.47, P = 0.235], and background firing rate [contralateral: 2.51 ± 0.48, ipsilateral: 1.75 ± 0.32, control: 1.61 ± 0.20 spikes/s; F(2,28.3) = 1.45, P = 0.252]. However, an ANOVA revealed a significant difference between the lesioned and control groups on measures of directional firing range [contralateral: 122.2 ± 7.2°, ipsilateral: 105.4 ± 8.5°, control 103.8 ± 3.8°; F(2,96) = 3.27, P = 0.042]. Subsequent t-tests revealed that this effect was largely mediated by the mean difference between the contralateral lesion and control groups [t(94) = 2.52, P = 0.013] and not the difference between ipsilateral lesion and control groups [t(94) = −0.144, P = 0.89] or between the contralateral and ipsilateral groups [t(94) = 1.43, P = 0.16]. We also identified a significant difference between control and lesion groups on anticipatory time interval measures [contralateral: 64.2 ± 11.3, ipsilateral: 0.23 ± 28.4, control 30.8 ± 7.0 ms; F(2,81) = 5.16, P = 0.008]. Again, subsequent t-tests determined that this effect was largely mediated by the mean difference between the contralateral lesion and control groups [t(79) = −2.41, P = 0.018] and not the difference between ipsilateral lesion and control groups [t(79) = −1.52, P = 0.13]. There was a significant mean difference between the contralateral and ipsilateral groups [t(79) = 2.95, P = 0.004], indicating that HD cells in contralaterally lesioned animals anticipated to a greater extent compared with ipsilaterally lesioned animals. Similar to experiment 1, we also observed several cells that contained burst firing patterns in unilaterally lesioned animals (n = 13; 12.3%). The percentage of bursting cells in contralaterally lesioned animals (n = 12; 16.4%) was greater than in ipsilaterally lesioned animals (n = 1; 3.0%); however, a χ2-test failed to indicate a significant difference between groups [χ2(1) = 1.07, P = 0.30].
In summary, the analyses on the basic firing properties indicate that small unilateral lesions, in particular lesions contralateral to the recording hemisphere, significantly increase the range of directions cells fire in. It is possible that this reduction in directional specificity reflects a general deficit in spatial updating by environmental landmarks and/or by idiothetic cues. These possibilities are tested below.
Landmark control.
To determine whether unilateral SGN lesions impaired landmark control over ADN HD cells, we monitored cell activity after a white cue card was rotated 90° CW or CCW along the wall of the testing cylinder (Fig. 2A). A total of 16 cells in the contralateral lesion group, 10 in the ipsilateral lesion group, and 20 from the control group were recorded during the landmark test. The results are plotted in circular histograms in Fig. 9A, showing the amount of angular shift in the cell's preferred firing direction between the standard 1 and rotation sessions and between the standard 1 and standard 2 sessions. Overall, the white cue card demonstrated strong control over HD cells in control animals, where their preferred directions shifted a similar angular distance and always in the same direction as the landmark. In contrast, however, unilateral lesions of the SGN appeared to reduce the control by the landmark. For instance, over half of the 26 HD cells recorded in lesioned animals underrotated their preferred directions ≥30° (n = 6), did not rotate (≤12°; n = 4), rotated in the wrong direction (n = 3), or were clearly directionally unstable for large portions of the 8-min rotation session (n = 3). Figure 10 shows three representative firing rate vs. HD functions from rats with SGN lesions recorded during the landmark rotation series, as well as an HD × time plot for a cell recorded in a lesioned animal that displayed directional instability during the rotation session. Mean comparisons on the amount of deviation from the expected 90° shifts (computed only for directionally stable cells; n = 23) confirmed a significant group difference [F(2,13.8) = 4.46, P = 0.032], which, in large part, was influenced by the difference between the contralateral lesion (58.8 ± 16.1°) and control (15.3 ± 2.6°) groups [t(14.7) = 2.65, P = 0.02]. Although the mean deviation did not significantly differ between control and ipsilaterally lesioned animals [t(8) = 1.60, P = 0.15], it is important to note that deviation values were much larger for HD cells recorded in ipsilaterally lesioned animals (31.5 ± 9.8°) compared with control animals. Moreover, over half of the 10 HD cells recorded in ipsilaterally lesioned animals showed either directional instability during the rotation sessions (n = 2) or underrotation in their preferred directions (n = 4) or the cell's preferred direction did not rotate at all (n = 1). Rayleigh analyses on the angular shift values confirm these observations showing that the mean vector length is significantly longer for the control group (r = 0.952) compared with the lesioned group (r = 0.623; P < 0.05). However, it is important to point out that the distributions of angular shift values were significantly clustered for both groups (P < 0.001). Finally, a t-test did not indicate a significant difference in the mean shifts between the contralateral and ipsilateral lesion groups [t(20.6) = 1.45, P = 0.16].
Fig. 9.
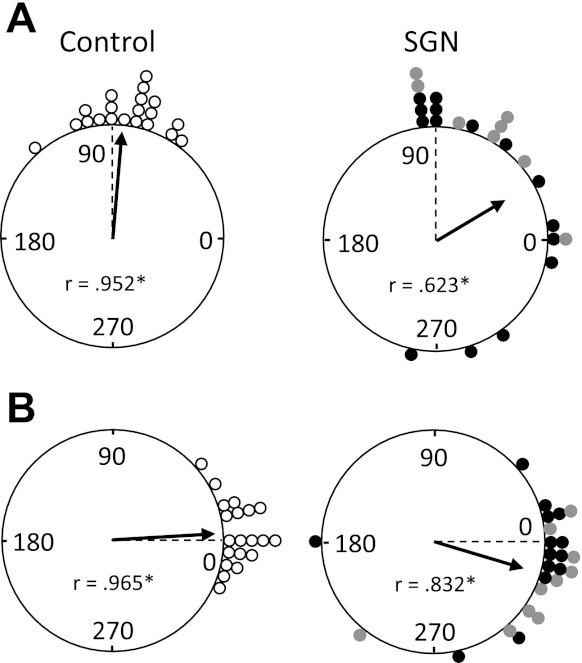
A: polar plots showing the angular shift in the preferred firing direction between the standard 1 and rotation sessions for control (left) and unilateral SGN-lesioned (right) rats. Each dot on the periphery represents the magnitude of shift in the preferred firing direction for 1 HD cell. The arrows denote the observed mean vector angle, and the broken line denotes the expected 90° vector if the angular shift values are perfectly controlled by the cue card. Mean vector length values (r) are indicated within the plot and are depicted by the length of the arrow. The length of r represents the variability in the shift angles for the group, with values of 1.0 falling on the circle and indicating an absence of variability. Asterisks mark r values that are significantly directional as indicated by the Rayleigh test (*P < 0.001). Note that the shifts for both groups are significantly clustered; however, for the lesioned group (contralateral, black dots; ipsilateral, gray dots) there was a tendency for underrotation as well as rotation in the wrong direction. B: polar plots showing the angular shift in the preferred firing direction between the standard 1 and standard 2 sessions for control (left) and unilateral SGN-lesioned (right) rats. The 0° point indicates the expected vector if the shift values are perfectly controlled by the cue card position. Although the shifts for both groups are significantly clustered and concentrated around 0°, there was a tendency for cells in the lesion group to overrotate when the cue card was returned to its original orientation.
Fig. 10.
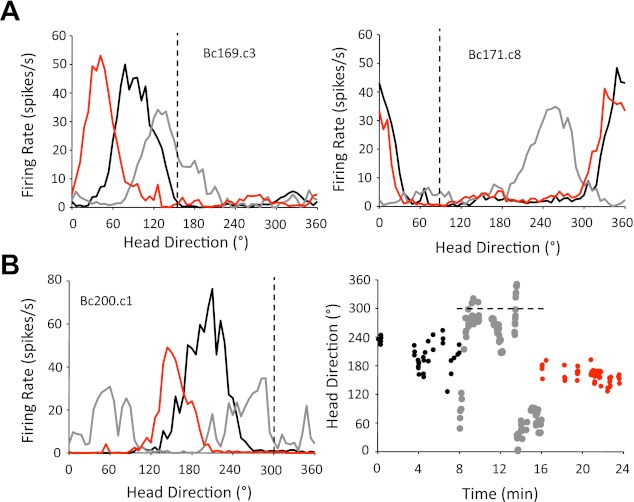
A: representative firing rate × HD tuning curves for HD cells from unilateral SGN-lesioned rats during the landmark rotation and return series. Each panel depicts an HD cell recorded from different lesioned animals. The black line in each plot indicates the standard 1 session, the gray lines represent the rotation session, and the red lines indicate the standard 2 sessions. The dashed vertical line in each plot shows the expected HD if cell tuning is perfectly controlled by the cue card. Left: an HD cell in an ipsilaterally lesioned animal that underrotated in response to a CCW cue card rotation. Note that the preferred direction overrotated when the cue card was positioned in its original orientation, suggesting that landmark control was largely intact in standard 2. Right: an HD cell from a contralaterally lesioned animal that rotated in the wrong direction after a CCW cue card rotation. Note, however, that the cell's preferred direction returned to its original orientation in standard 2. B, left: a representative “directionally unstable” cell in a lesion animal during the landmark rotation series. Note that this cell lost its direction-specific firing during the landmark rotation session but showed a clear preferred direction during the standard 1 and standard 2 sessions. Right: an HD × time plot for the cell on left. Each dot depicts the time when the HD cell fired ≥50% of its maximum firing rate (black dot, standard 1; gray dots, rotation; red dots, standard 2). Sampling resolution was 1 s. Note that the cell fired within a narrow range of directions in the standard 1 and standard 2 sessions but drifted significantly during the landmark rotation session.
We further tested the amount of control the cue card had over HD cells in standard 2 by returning the cue card to its original angular orientation in the testing cylinder. In general, the preferred directions of HD cells recorded in control animals shifted back to their original orientation (Fig. 9B). Similarly, the preferred direction of HD cells recorded in lesioned animals also showed a high degree of landmark control by returning to their original orientation in the majority of the testing sessions (e.g., Fig. 10A, right, and Fig. 10B, right). This observation is supported by a nonsignificant ANOVA conducted on the deviation from the expected return shift [F(2, 15) = 2.40, P = 0.12]. Despite this nonsignificant result between the control and lesioned groups, it is noteworthy that on average the mean deviation was larger in lesioned animals (contralateral lesion: 31.7 ± 12.8°, ipsilateral lesion: 33.6 ± 12.4°) compared with control animals (12.0 ± 2.5°). In addition, two HD cells in the lesioned group shifted to orientations that were clearly unpredicted by landmark rotation (see Fig. 9B), and two HD cells displayed directional instability. Rayleigh tests on the angular shift distributions confirm these observations, indicating that the mean vector length is longer for the control group (r = 0.965) compared with the lesioned group (r = 0.765; P < 0.05). However, similar to the rotation experiment, both distributions were found to be significantly clustered (P < 0.001).
In sum, the results of the landmark rotation experiment indicate that unilateral lesions reduced the control exerted by a salient landmark. However, there was no impairment in landmark control when the cue card was returned to its original orientation in the testing cylinder.
Dark test.
To determine whether SGN lesions disrupt the normal processing of idiothetic cues in the HD cell circuit, we monitored HD cell activity while rats foraged for food in the absence of the cue card and in darkness. It was expected that if SGN lesions impaired idiothetic cue processing, then the preferred directions of HD cells would display a greater magnitude of drift in darkness. We tested this prediction by constructing HD × time plots for each HD cell recorded in the dark test (control: n = 19, contralateral: n = 15, ipsilateral: n = 8). Overall, HD cells in control animals demonstrated peak firing rates that were clustered within a narrow range of directions throughout the entire 8-min dark test (e.g., Fig. 11A, left). In contrast, however, many of the HD cells recorded in SGN animals drifted throughout the session, and in some cases, oriented through all 360° directions (n = 7; e.g., Fig. 11A, right). To quantify these observations, we computed the angular deviation for the peak firing rate points in the HD × time plots. It was hypothesized that the drifting nature of HD cells in the lesioned group would result in greater angular deviation values compared with the control group. Consistent with this prediction, the mean angular deviation for HD cells in the lesioned groups (contralateral: 41.3 ± 3.6°, ipsilateral: 56.2 ± 6.9°) was greater than those recorded in control animals (31.2 ± 2.4°). This difference was confirmed by a significant ANOVA [F(2,16.1) = 7.10, P = 0.006] as well as significant follow-up comparisons between the contralateral lesion and control groups [t(25.3) = −2.33, P = 0.038] and between ipsilateral lesion and control groups [t(8.8) = −3.44, P = 0.008]. However, there was no significant difference between the contralateral and ipsilateral groups. The distribution of angular deviation values for each group is shown in Fig. 11B.
Fig. 11.
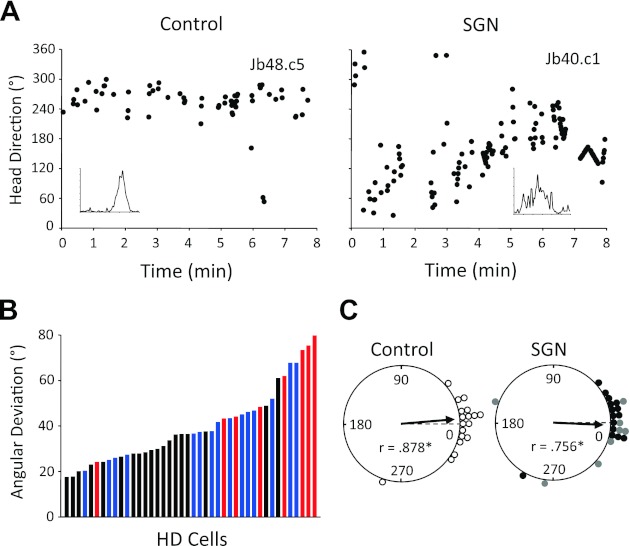
A: HD × time plots for representative HD cells recorded in control (left) and unilateral SGN-lesioned (right) rats during the dark test. Insets plot the firing rate × HD functions for each cell. Note that the cell in the control animal fired within a narrow range of directions throughout the 8-min session. In contrast, the HD cell in the lesioned animal fired through all directions during the session, indicating that it was highly unstable. B: distribution of angular deviation values for the preferred directions in the HD × time plots for cells recorded in control (black) and unilateral SGN-lesioned (contralateral, blue; ipsilateral, red) groups during the dark test. Note that angular deviation values are larger for lesioned animals. C: polar plots showing the angular shift in preferred firing direction between the standard 2 and standard 3 sessions for control (left) and SGN-lesioned (right; contralateral, black dots; ipsilateral, gray dots) rats. The 0° point indicates the expected vector if the preferred firing directions of cells are maintained across sessions. Note that for both groups the angular shift values are significantly clustered around 0° (*P < 0.001).
We also investigated whether the magnitude of preferred direction drift was related to variability in locomotor characteristics during the dark test. Specifically, theoretical and behavioral studies suggest that the accuracy of idiothetic cue integration (i.e., path integration) can degrade over time (Etienne and Jeffery 2004; Goodridge et al. 1998; McNaughton et al. 1991); thus it is possible that animals in the lesioned group taxed their path integration system to a greater extent than control animals, possibly by making more head turns and traveling a greater distance in the cylinder. We tested this hypothesis by measuring the cumulative distance traveled, number of head turns, and average angular head velocity. Mean comparisons between lesioned (contralateral and ipsilateral groups pooled) and control animals failed to indicate a significant difference for each measure [t(40) = 0.26, 1.07, and 0.96 for cumulative distance traveled, angular head velocity, and total number of head turns, respectively; all P > 0.05]. Thus movement characteristics alone cannot account for the directional instability of HD cells in lesioned animals, supporting the view that the SGN plays an important role in idiothetic cue processing.
Standard 3 (cue card return).
To further test landmark control over HD cells in the lesion group, we turned the room lights back on and returned the white cue card to its original orientation in the testing cylinder after the dark test was completed. If the cue card exerted stimulus control over HD cells, their preferred directions should return to their original standard 2 orientations. Figure 11C plots the amount of angular shift in the cells' preferred directions between the standard 2 and standard 3 sessions for control and lesioned animals. In general, the cue card exerted control over HD cells in both groups. Although the mean deviation from the expected shift was much greater for the ipsilateral lesion group (43.5 ± 20.2°) compared with the contralateral lesion group (22.0 ± 7.5°) and control rats (19.7 ± 5.9°), the ANOVA did not indicate significant group differences [F(2,15.9) = 0.617, P = 0.55]. In addition, the length of the mean vector was slightly shorter for the lesioned group (r = 0.756) compared with control animals (r = 0.878), but this difference also did not reach significance (P > 0.05). Moreover, the Rayleigh test indicated that both distributions of angular shift values were significantly clustered around 0° (P < 0.001). Taken together, the results above suggest that landmark control was largely intact in SGN lesioned rats during the standard 3 sessions.
Dual-chamber apparatus.
To further test whether SGN lesions disrupt idiothetic information processing, we evaluated the stability of HD cell tuning while rats locomoted from the familiar cylinder to a novel, rectangular-shaped enclosure. Stable updating of the cell's preferred direction should occur when a control rat enters the novel environment. A total of 10 HD cells from control and 11 HD cells from lesioned animals were recorded in the dual-chamber apparatus. Because of the small number of ipsilaterally lesioned animals tested in this experiment, the lesion subgroups were pooled for statistical analysis. Overall, HD cells in control animals displayed very little shift in their preferred directions when the animals were walking from the familiar cylinder to the rectangle environment. Indeed, a Rayleigh analysis on the distribution of angular shift values suggests that they were significantly clustered around 0° (r = 0.968, P < 0.001; Fig. 12A, left), ranging from 24° to −30°. For lesioned animals, however, HD cells frequently shifted their preferred directions >30° (8 of 11 cells) when entering the novel rectangle. Interestingly, in one animal with an ipsilateral SGN lesion, the preferred direction drifted throughout the full range of directions before stabilizing in the last few moments of the novel rectangle session (data not shown). Because the HD cell in this animal did not display a clear preferred firing direction in its corresponding firing rate ×HD plot for the rectangle session, it was not included in the distribution of angular shift values for the lesioned group (Fig. 12A, right). Nevertheless, for the remaining 10 cells, a Rayleigh test indicated that the mean vector length was much lower compared with control animals (r = 0.483) and was not significantly directional (P = 0.10). Furthermore, a mean comparison revealed that the preferred direction shift was significantly larger in lesioned (contralateral and ipsilateral pooled: 57.6 ± 14.3°) compared with control (10.8 ± 3.3°) animals [t(10) = 3.18, P = 0.01]. It is important to note, however, that the angular shifts in these cells do not appear randomly distributed in the polar plot (see Fig. 12A, right), suggesting that some idiothetic information may have been used by the animals. Alternatively, it is possible that some lesioned rats were capable of using the novel cues within the alleyway and rectangle for orientation (Stackman et al. 2003; Yoder et al. 2011b).
Fig. 12.
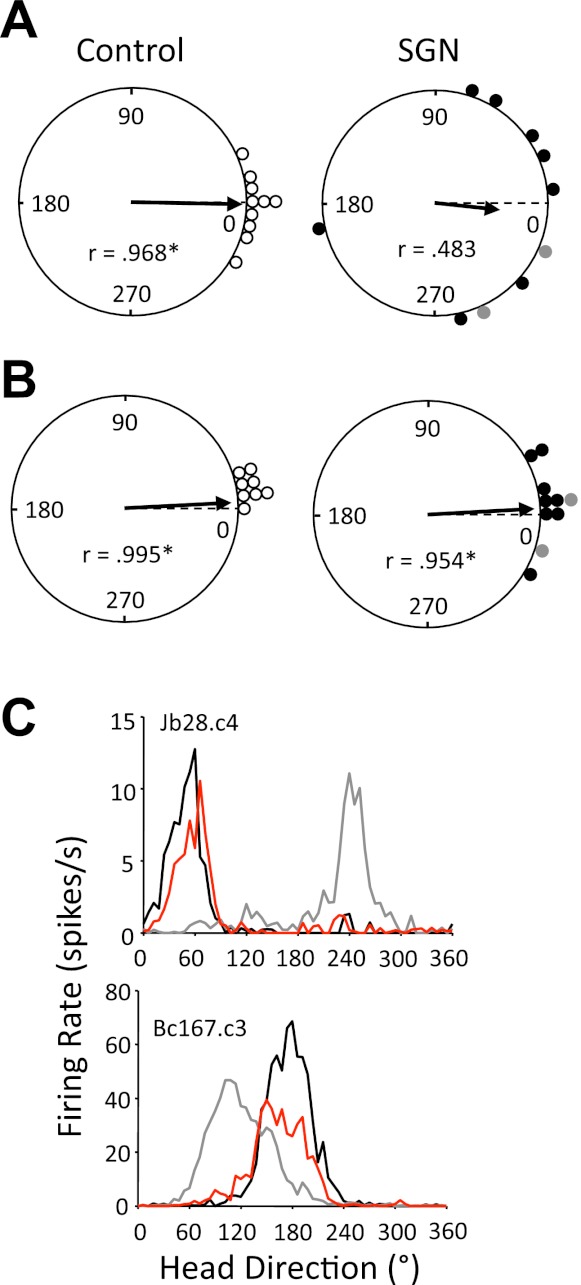
A: polar plots showing the angular shift in the preferred directions between the cylinder 1 and rectangle sessions of the dual-chamber task for control (left) and unilateral SGN-lesioned (right) rats. The broken line at 0° indicates the expected vector if the preferred directions of cells are maintained across sessions. The plots reveal that the angular shift values are significantly clustered around 0° for control animals (*P < 0.001); however, angular shifts were larger and not significantly clustered for lesioned animals. B: polar plots showing the angular shift in preferred firing direction between the cylinder 1 and cylinder 2 sessions for control (left) and unilateral SGN-lesioned (right) rats. Again, the broken line at 0° points to the expected vector if the angular shift values maintain their orientation between sessions. Note that the angular shifts are significantly clustered around 0° for both groups (*P < 0.001). C: representative firing rate × HD tuning curves for HD cells from unilateral SGN-lesioned rats recorded in the dual-chamber apparatus. Black lines in each plot indicate the cylinder 1 session, gray lines represent the rectangle session, and red lines indicate the cylinder 3 sessions. Note that each cell shifted its preferred firing direction when the rat was entering the novel rectangle enclosure, but each cell's preferred direction returned to its original orientation after the rat locomoted to the familiar cylinder.
In a final session we examined whether the preferred directions of HD cells would return to their original orientation established in the cylinder 1 session. Thus rats were allowed to walk back from the rectangular compartment to the familiar cylinder. As shown in Fig. 12B, HD cells in control animals displayed very little angular difference in their preferred directions between the cylinder 1 and cylinder 2 sessions (2 cells were removed from analysis because of poor isolation in the cylinder 2 session). Confirming this observation, a Rayleigh analysis indicated that the distribution of angular shift values was significantly clustered around 0° (r = 0.995, P < 0.001). Similarly, HD cells in the lesioned group frequently returned to their original orientation in the cylinder (Fig. 12B, right). This observation is confirmed by a significant Rayleigh test on the distribution of angular shift values (r = 0.954, P < 0.001) and by a nonsignificant mean comparison between the lesioned (13.8 ± 3.9°) and control (9.8 ± 2.3°) groups [t(14) = 0.90, P = 0.38]. A particularly striking example of strong control by the landmark is shown in Fig. 12C, top, in which an HD cell in a contralaterally lesioned animal shifted 168° when entering the rectangle but shifted back to its original orientation when returning to the cylinder. Collectively, these results suggest that the familiar cylinder environment gained control over HD cell orientation in both groups upon return to the cylinder.
DISCUSSION
The present study tested the hypothesis that the SGN relays self-movement information to the HD cell circuit through its direct projections to the DTN and LMN (see Fig. 1). By screening for cell activity in the ADN of animals with bilateral electrolytic lesions of the SGN, we demonstrated that the HD signal was completely abolished. Although small populations of HD cell activity were found in cases of partial SGN damage, these cells were weakly modulated by the animal's HD and were less stable relative to control animals. Consistent with previous work (Muir et al. 2009; Yoder and Taube 2009), we identified a population of ADN cells in bilaterally lesioned animals that had nonperiodic “bursting” characteristics, which resembled the activity of HD cells passing through their preferred directions (Fig. 7). Because our SGN lesions in experiment 1 often included damage to the mlf, which also carries ascending vestibular information, in experiment 2 we further tested the specific role of the SGN by unilaterally lesioning it with the fiber-sparing neurotoxin NMDA and evaluating both landmark control and the use of idiothetic cues by ADN HD cells. We found that unilateral neurotoxic SGN lesions impaired landmark control, as evidenced by the inconsistent responses of HD cells to shift their preferred firing directions in alignment with the cue card after cue card rotations (Fig. 9A). However, this impairment was transient, as HD cells were capable of reorienting in relation to the cue card in the standard sessions (Figs. 9B and 11C) and in the cylinder 2 sessions of the dual-chamber task (Fig. 12B). In contrast to the weak impairments in landmark control, we observed large impairments in idiothetic processing. In particular, unilateral SGN lesions significantly reduced the stability of preferred directions in the dark test (Fig. 11B). Furthermore, HD cells in unilaterally lesioned rats displayed large shifts in their preferred firing directions when locomoting into a novel rectangle environment (Fig. 12A). Contralateral lesions of the SGN appeared to have a mildly greater impact on the directional specificity and landmark updating of HD tuning relative to the ipsilateral group. Nevertheless, ipsilateral lesions produced comparable impairments in idiothetic processing, suggesting that bilateral output from each SGN nuclei is required for spatial updating.
What Is the Role of SGN Projections in HD Signal Processing?
The precise role of the SGN in processing the HD cell signal is not entirely understood; however, a number of lines of evidence support the interpretation that the structure is crucially involved in conveying ascending vestibular signals to the HD cell circuit. First, the SGN receives a dense direct projection from the medial vestibular nuclei (Biazoli et al. 2006), an area that receives a high percentage of its input from the horizontal semicircular canal, which is primarily sensitive to angular head acceleration in the horizontal (azimuthal) plane. The SGN also receive a more moderate projection from the NPH (Biazoli et al. 2006), which may indirectly convey vestibular information to the SGN (see Fig. 1). Second, the SGN sends large projections to the HD cell circuitry, specifically targeting the DTN and LMN (Biazoli et al. 2006; Brown et al. 2005), which are thought to be the site of HD signal generation (Bassett and Taube 2001; Sharp et al. 2001a; Taube 2007). Third, similar to lesions of the vestibular system (Muir et al. 2009; Stackman and Taube 1997) or tegmento-mammillary circuit (Bassett et al. 2007; Blair et al. 1999), bilateral damage of the SGN completely abolished HD tuning in the ADN. Finally, we identified bursting activity in the ADN after bilateral and unilateral SGN damage, which is consistent with previous studies showing similar burst characteristics in the ADN of animals with semicircular canal occlusion (Muir et al. 2009) or transgenic otolith disruption (Yoder and Taube 2009). Although the points mentioned above suggest that SGN's role in generating the HD signal relates to its interactions with the vestibular system, it is possible that its role may be more related to nonvestibular functions, such as maintaining a frame of reference or suppressing an eye-related position signal from a gaze signal to yield head position information.
It is also notable that partial lesions of the SGN, especially contralateral to the electrode implant, significantly increased the amount of time that ADN HD cells anticipate future orientations (i.e., the anticipatory time interval of HD cells). Although it is not clear whether the anticipatory time interval serves a particular function or if it is simply an epiphenomenon that arises from vestibular system projections (Bassett et al. 2005; van der Meer et al. 2007), the general increase in anticipation reported here is similar to that shown in other work in which ascending self-motion information has been disrupted (Clark et al. 2009; Shinder and Taube 2011).
It is important to point out, however, that the SGN sends projections to the cerebellum, in particular the floccular nodular lobe (Blanks et al. 1983), which is often linked to gaze control (McCrea 1988). Thus it is possible that impairments in gaze control, rather than impairments in vestibular processing, may have contributed to the present results. We believe this possibility is unlikely for several reasons. First, although rats have a prominent vestibular-ocular reflex, they do not make frequent saccades or smooth pursuit eye movements. Furthermore, eye movements do not play as central a role in their behavior as in cats or primates. Second, one study conducted in nonhuman primates (Robertson et al. 1999) found that the HD signal was independent of eye position, suggesting that eye movements were unlikely to be important in deriving the HD signal. Third, it is believed that the HD signal represents the animal's perceived directional heading in space—not its gaze position. Thus interfering with the animal's ability to make eye movements should not impact its perceived directional heading. Finally, in unpublished experiments we have lesioned parts of the cerebellar floccular nodular lobe—areas that are thought to play an important role in eye movements—and these lesions did not disrupt the HD signal in the sense that it abolished it (M. Glickstein and J. S. Taube, unpublished observations). Because several previous studies have shown that interfering with the vestibular system disrupts the HD signal (e.g., Muir et al. 2009; Stackman and Taube 1997), the most parsimonious interpretation of our findings is that the loss of vestibular information via the SGN to the HD circuit is critical for enabling the generation of the HD signal. Finally, it is important to note that the SGN also receives moderate projections from the paragigantocellular reticular nucleus (Biazoli et al. 2006). Very little is known about this structure, and future work should address this gap in our knowledge.
It is also important to address the possibility that damage to the adjacent mlf fiber pathway may have contributed to our results. In experiment 1, electrolytic lesions were used to remove the SGN bilaterally, but this procedure also damaged adjacent fiber pathways such as the mlf. The mlf conveys ascending vestibular information from not only the vestibular nuclei but also several midbrain structures involved in processing vestibular information; thus it is possible that damaging the mlf may have contributed to the results of experiment 1. As noted in results, Frohardt et al. (2006) tested the possibility that the mlf plays a role in processing idiothetic cues by selectively damaging the mlf in two animals and testing them in a task requiring the accurate use of self-movement cues to reach a goal location. They reported that transection of the mlf did not impair navigation in the task, suggesting that damage to the mlf alone does not disrupt path integration processes downstream (i.e., in efferent areas). Regardless, in experiment 2, we addressed the possibility that the mlf contributed to our results by damaging the SGN with a neurotoxin (NMDA) that does not damage axons passing near the injection site (Jarrard 1989). As summarized above, neurotoxic lesions of the SGN disrupted the use of idiothetic cues to maintain a stable HD signal in the dark and when entering a novel environment, indicating that the SGN plays an important role in angular path integration.
Given the conclusion that the SGN conveys idiothetic information to the HD cell circuit for angular path integration, it is unclear why mild impairments were observed during the landmark rotation series, since it would seem that the idiothetic system would have little to do with the landmark system at the level of the brain stem. One possible explanation is that the SGN may influence HD signal processing through the tecto-pulvinar pathway because it sends moderate projections to the superior colliculus (i.e., SGN → superior colliculus → lateral dorsal thalamus → postsubiculum) (Klop et al. 2005; Yoder et al. 2011a). However, previous work by Golob et al. (1998) established that lesions of this pathway at the level of the lateral dorsal thalamic nuclei do not impair landmark control over HD tuning in the postsubiculum. An alternative hypothesis is that environmental landmarks are associated with an idiothetic-based reference frame (Alyan and Jander 1994; McNaughton et al. 1996); thus lesions disrupting idiothetic processing would also disrupt landmark control. This hypothesis is supported by other studies showing that disruption of accurate vestibular processing impairs landmark control over HD cells (e.g., Knierim et al. 1995; Stackman and Taube 1997) and can lead to impairments in landmark-based navigation (Clark and Taube 2009; Dudchenko et al. 1997b).
In experiment 2 we investigated the relative role of topographically organized SGN projections to the tegmento-mammillary pathway such that each nucleus sends axons to the contralateral DTN and ipsilateral LMN (Biazoli et al. 2006). One interesting feature of this connectivity is that SGN input to the DTN is much stronger than input to LMN. As a consequence, it could be argued that projections to the DTN are more significant with respect to HD signal processing. The results of experiment 2, however, suggest that both inputs are necessary for generating an accurate signal based on spatial updating via idiothetic cues. This result is particularly apparent in the dark test, in which HD cells were recorded in animals with ipsilateral lesions of the SGN (thereby disconnecting input to LMN) or contralateral lesions (thereby disconnecting input to DTN). In general, the preferred directions of HD cells recorded in each group drifted a similar magnitude across the 8-min test session (Fig. 11B). Similarly, in the rectangle session of the dual-chamber task, cells in both groups demonstrated significant shifts in their preferred firing directions (Fig. 12A). In sum, these findings suggest that inputs to the DTN and LMN from both SGN nuclei together are required for HD cell stability, and suggest that the influence of SGN output is widespread across the HD cell generative circuit.
It is presently unknown what physiological information the SGN may convey to the HD cell circuit, since no study has recorded activity from this structure. However, it is likely that the SGN plays a role in processing angular head velocity information (Sharp et al. 2001a; Taube 2007). As noted above, the SGN receives input from the medial vestibular nuclei, which contain neurons modulated by angular head velocity (Angelaki and Cullen 2008). In addition to containing neurons modulated by HD, the DTN and LMN have large populations of neurons sensitive to angular head velocity (Bassett and Taube 2001; Blair et al. 1998; Sharp et al. 2001b; Stackman and Taube 1998). The DTN also sends a strong projection back to the contralateral SGN (Biazoli et al. 2006); thus it is possible that SGN neurons are also responsive to current HD because a small population of HD cells have been reported in the DTN (Sharp et al. 2001b).
Other projections likely provide vestibular information to the HD cell system. For instance, the NPH receives strong inputs from the vestibular system and projects directly to the DTN (Fig. 1) (Brown et al. 2005). SGN and NPH projections to the HD cell circuit differ slightly in that the NPH does not project directly to the LMN and, instead of projecting contralaterally, it sends massive input to the ipsilateral DTN (Liu et al. 1984). Like the SGN, very little is known about NPH neural activity in freely moving rats. One study in immobilized rats found neurons that were responsive to optokinetic as well as sinusoidal vestibular stimulation in the horizontal plane (Lannou et al. 1984). In cats and nonhuman primates, NPH neurons are strongly modulated by eye movements (Lopez-Barneo et al. 1982; Delgado-García et al. 1989; McFarland and Fuchs 1992), and it has been argued that this region is the site of the neural integrator for the vestibulooccular reflex (Robinson 1989). Interestingly, the activity of some NPH neurons has been correlated with the animal's angular head movements (McFarland and Fuchs 1992), leaving open the possibility that the NPH may provide an alternative vestibular pathway for HD cell computations.
Implications for Computational Models of HD Cell Generation
McNaughton et al. (1991) provided the first computational model that captured the notion that the HD cell signal could be derived by tracking an animal's angular head velocity over time. Subsequent models (e.g., Redish et al. 1996; Skaggs et al. 1995; Zhang 1996) have expanded on this basic principle, using continuous attractor networks (reviewed in Taube and Bassett 2003). In these models, HD cells are conceptually arranged in a ring corresponding to their preferred firing directions. Cells with preferred directions that have overlapping directional firing ranges share excitatory connections, and cells with greatly different preferred directions inhibit each other. This neural architecture forms a sustained “hill” of excitation centered on the animal's current HD. Information about the animal's angular head velocity is derived from vestibular inputs that are typically used to move the hill of activity around to different directions depending on changes to the animal's HD. Consequently, the removal of angular head velocity information results in an activity hill that no longer moves along the ring in register with an animal's HD. Instead, the activity hill moves around the ring at different rates depending on the remaining inputs that convey information about current heading (e.g., visual and motor). Consistent with this view is our observation that some ADN cells in SGN-lesioned rats fired in characteristic short, nonrhythmic “bursts,” which generally had the appearance of a cell periodically passing through its preferred firing direction. These “bursting” cells could be interpreted as an activity hill moving along the attractor ring at varying rates (see Clark and Taube 2012 for review). Bursting cell correlates have also been identified in the ADN after disruption of the vestibular system (Muir et al. 2009; Stackman and Taube 1997; Yoder and Taube 2009) but not after lesions to the DTN or LMN (Bassett et al. 2007), suggesting that lesions of the vestibular system or SGN do not disconnect the internal dynamics of the ring attractor network, whereas lesions of the DTN or LMN apparently disrupt the network at a more fundamental level. Interestingly, the vestibular lesion studies have also reported that the temporal order of simultaneously recorded bursting cells is generally preserved (Muir et al. 2009), again suggesting that inputs from the vestibular system are not necessary for generating the organized structure of the HD cell (attractor) network. Given these findings, the HD attractor network most likely resides within the tegmental-mammillary circuit (Bassett et al. 2007; Blair et al. 1999).
Summary
The present study evaluated the hypothesis that the SGN conveys vestibular information critical for the generation of the HD cell signal. Consistent with this proposal, we found that complete lesions of the SGN abolished HD cell activity in the ADN and unilateral lesions disrupted the capacity to update directional orientation based on idiothetic input. This latter finding in particular suggests that unilateral SGN input to the HD circuit can sustain directional activity but idiothetic processing of the directional signal requires input from both nuclei. Future studies should be directed at understanding the correlates of neural activity within the SGN as well as understanding the contributions of the closely associated NPH. Such work will broaden our understanding of the signal transformations involved in generating the HD cell signal and provide greater insight into the neural and computational mechanisms underlying spatial orientation.
GRANTS
This work was supported through NIH Grants NS-053907 and DC-009318 to J. S. Taube.
DISCLOSURES
No conflicts of interest, financial or otherwise, are declared by the author(s).
AUTHOR CONTRIBUTIONS
Author contributions: B.J.C., J.E.B., and J.S.T. conception and design of research; B.J.C. and J.E.B. performed experiments; B.J.C. and J.S.T. analyzed data; B.J.C. and J.S.T. interpreted results of experiments; B.J.C. prepared figures; B.J.C. drafted manuscript; B.J.C. and J.S.T. edited and revised manuscript; B.J.C., J.E.B., and J.S.T. approved final version of manuscript.
ACKNOWLEDGMENTS
J. E. Brown received National Institutes of Health (NIH) postdoctorate fellowship DC-008773. B. J. Clark received a postgraduate fellowship from the National Sciences and Engineering Research Council of Canada.
Present address of B. J. Clark: Canadian Centre for Behavioural Neuroscience, University of Lethbridge, Lethbridge, AB, Canada T1K 3M4.
REFERENCES
- Alyan S, Jander R. Short-range homing in the house mouse, Mus musculus: stages in the learning of directions. Anim Behav 48: 285–298, 1994 [Google Scholar]
- Angelaki DE, Cullen KE. Vestibular system: the many facets of a multimodal sense. Annu Rev Neurosci 31: 125–150, 2008 [DOI] [PubMed] [Google Scholar]
- Bassett JP, Taube JS. Neural correlates for angular head velocity in the rat dorsal tegmental nucleus. J Neurosci 21: 5740–5751, 2001 [DOI] [PMC free article] [PubMed] [Google Scholar]
- Bassett JP, Tullman ML, Taube JS. Lesions of the tegmentomammillary circuit in the head direction system disrupt the head direction signal in the anterior thalamus. J Neurosci 27: 7564–7577, 2007 [DOI] [PMC free article] [PubMed] [Google Scholar]
- Bassett JP, Zugaro MB, Muir GM, Golob EJ, Muller RU, Taube JS. Passive movements of the head do not abolish anticipatory firing properties of head direction cells. J Neurophysiol 93: 1304–1316, 2005 [DOI] [PubMed] [Google Scholar]
- Batschelet E. Circular Statistics in Biology. New York: Academic, 1981 [Google Scholar]
- Biazoli CE, Jr, Goto M, Campos AM, Canteras NS. The supragenual nucleus: a putative relay station for ascending vestibular signs to head direction cells. Brain Res 1094: 138–148, 2006 [DOI] [PubMed] [Google Scholar]
- Blair HT, Sharp PE. Anticipatory head direction signals in anterior thalamus: evidence for a thalamocortical circuit that integrates angular head motion to compute head direction. J Neurosci 15: 6260–6270, 1995 [DOI] [PMC free article] [PubMed] [Google Scholar]
- Blair HT, Cho J, Sharp PE. Role of the lateral mammillary nucleus in the rat head direction circuit: a combined single-unit recording and lesion study. Neuron 21: 1387–1397, 1998 [DOI] [PubMed] [Google Scholar]
- Blair HT, Cho J, Sharp PE. The anterior thalamic head-direction signal is abolished by bilateral but not unilateral lesions of the lateral mammillary nucleus. J Neurosci 19: 6673–6683, 1999 [DOI] [PMC free article] [PubMed] [Google Scholar]
- Blanks RH, Precht W, Torigoe Y. Afferent projections to the cerebellar flocculus in the pigmented rat demonstrated by retrograde transport of horseradish peroxidase. Exp Brain Res 52: 293–306, 1983 [DOI] [PubMed] [Google Scholar]
- Boccara CN, Sargolini F, Thoresen VH, Solstad T, Witter MP, Moser EI, Moser MB. Grid cells in pre- and parasubiculum. Nat Neurosci 13: 987–994, 2010 [DOI] [PubMed] [Google Scholar]
- Brown JE, Card JP, Yates BJ. Polysynaptic pathways from the vestibular nuclei to the lateral mammillary nucleus of the rat: substrates for vestibular input to head direction cells. Exp Brain Res 161: 47–61, 2005 [DOI] [PubMed] [Google Scholar]
- Chen LL, Lin LH, Barnes CA, McNaughton BL. Head-direction cells in the rat posterior cortex. II. Contributions of visual and ideothetic information to the directional firing. Exp Brain Res 101: 24–34, 1994 [DOI] [PubMed] [Google Scholar]
- Cho J, Sharp PE. Head direction, place, and movement correlates for cells in the rat retrosplenial cortex. Behav Neurosci 115: 3–25, 2001 [DOI] [PubMed] [Google Scholar]
- Clark BJ, Taube JS. Deficits in landmark navigation and path integration after lesions of the interpeduncular nucleus. Behav Neurosci 123: 490–503, 2009 [DOI] [PMC free article] [PubMed] [Google Scholar]
- Clark BJ, Taube JS. Intact landmark control and angular path integration by head direction cells in the anterodorsal thalamus after lesions of the medial entorhinal cortex. Hippocampus 21: 767–782, 2011 [DOI] [PMC free article] [PubMed] [Google Scholar]
- Clark BJ, Taube JS. Vestibular and attractor network basis of the head direction cell signal in subcortical circuits. Front Neural Circuits 6: 7, 2012 [DOI] [PMC free article] [PubMed] [Google Scholar]
- Clark BJ, Sarma A, Taube JS. Head direction cell instability in the anterior dorsal thalamus after lesions of the interpeduncular nucleus. J Neurosci 29: 493–507, 2009 [DOI] [PMC free article] [PubMed] [Google Scholar]
- Clark BJ, Bassett JP, Wang S, Taube JS. Impaired head direction cell representation in the anterodorsal thalamus after lesions of the retrosplenial cortex. J Neurosci 30: 5289–5302, 2010 [DOI] [PMC free article] [PubMed] [Google Scholar]
- Delgado-García JM, Vidal PP, Gómez C, Berthoz A. A neurophysiological study of prepositus hypoglossi neurons projecting to oculomotor and preoculomotor nuclei in the alert cat. Neurosci 29: 291–307, 1989 [DOI] [PubMed] [Google Scholar]
- Dudchenko PA, Goodridge JP, Taube JS. Effects of repeated disorientation on the acquisition of spatial tasks in rats: dissociation between the appetitive radial arm maze and aversive water maze. J Exp Psych Anim Behav Process 23: 194–210, 1997a [DOI] [PubMed] [Google Scholar]
- Dudchenko PA, Goodridge JP, Taube JS. The effects of disorientation on visual landmark control of head direction cell orientation. Exp Brain Res 115: 375–380, 1997b [DOI] [PubMed] [Google Scholar]
- Etienne AS, Jeffery KJ. Path integration in mammals. Hippocampus 14: 180–192, 2004 [DOI] [PubMed] [Google Scholar]
- Frohardt RJ, Bassett JP, Taube JS. Path integration and lesions within the head direction cell circuit: comparison between the roles of the anterodorsal thalamus and dorsal tegmental nucleus. Behav Neurosci 120: 135–149, 2006 [DOI] [PubMed] [Google Scholar]
- Golob EJ, Wolk DA, Taube JS. Recordings of postsubicular head direction cells following lesions of the lateral dorsal thalamic nucleus. Brain Res 780: 9–19, 1998 [DOI] [PubMed] [Google Scholar]
- Goodridge JP, Taube JS. Interaction between the postsubiculum and anterior thalamus in the generation of head direction cell activity. J Neurosci 17: 9315–9330, 1997 [DOI] [PMC free article] [PubMed] [Google Scholar]
- Goodridge JP, Dudchenko PA, Worboys KA, Golob EJ, Taube JS. Cue control and head direction cells. Behav Neurosci 112: 749–761, 1998 [DOI] [PubMed] [Google Scholar]
- Hayakawa T, Zyo K. Afferent connections of Gudden's tegmental nuclei in the rabbit. J Comp Neurol 235: 169–181, 1985 [DOI] [PubMed] [Google Scholar]
- Jarrard LE. On the use of ibotenic acid to lesion selectively different components of the hippocampal formation. J Neurosci Methods 29: 251–259, 1989 [DOI] [PubMed] [Google Scholar]
- Klop EM, Mouton LJ, Ehling T, Holstege G. Two parts of the nucleus prepositus hypoglossi project to two different subdivisions of the dorsolateral periaqueductal gray in cat. J Comp Neurol 3: 303–322, 2005 [DOI] [PubMed] [Google Scholar]
- Knierim JJ, Kudrimoti HS, McNaughton BL. Place cells, head direction cells, and the learning of landmark stability. J Neurosci 15: 1648–1659, 1995 [DOI] [PMC free article] [PubMed] [Google Scholar]
- Kubie JL. A driveable bundle of microwires for collecting single-unit data from freely-moving rats. Physiol Behav 32: 115–118, 1984 [DOI] [PubMed] [Google Scholar]
- Lannou J, Cazin L, Precht W, Le Taillanter M. Responses of prepositus hypoglossi neurons to optokinetic and vestibular stimulations in the rat. Brain Res 301: 39–45, 1984 [DOI] [PubMed] [Google Scholar]
- Liu R, Chang L, Wickern G. The dorsal tegmental nucleus: an axoplasmic transport study. Brain Res 310: 123–132, 1984 [DOI] [PubMed] [Google Scholar]
- Lopez-Barneo J, Darlot C, Berthoz A, Baker R. Neural activity in prepositus nucleus correlated with eye movement in the alert cat. J Neurophysiol 47: 329–352, 1982 [DOI] [PubMed] [Google Scholar]
- McCrea RA. The nucleus prepositus. Rev Oculomotor Res 2: 1–22, 1988 [PubMed] [Google Scholar]
- McCrea RA. Nucleus prepositus. Prog Brain Res 151: 205–230, 2006 [DOI] [PubMed] [Google Scholar]
- McFarland JL, Fuchs AF. Discharge patterns in nucleus prepositus hypoglossi and adjacent medial vestibular nucleus during horizontal eye movement in behaving macaques. J Neurophysiol 68: 319–332, 1992 [DOI] [PubMed] [Google Scholar]
- McNaughton BL, Chen LL, Markus EJ. “Dead reckoning,” landmark learning, and the sense of direction: a neurophysiological and computational hypothesis. J Cogn Neurosci 3: 190–202, 1991 [DOI] [PubMed] [Google Scholar]
- McNaughton BL, Barnes CA, Gerrard JL, Gothard K, Jung MW, Knierim JJ, Kudrimoti H, Qin Y, Skaggs WE, Suster M, Weaver KL. Deciphering the hippocampal polyglot: the hippocampus as a path integration system. J Exp Biol 199: 173–185, 1996 [DOI] [PubMed] [Google Scholar]
- Moser EI, Kropff E, Moser MB. Place cells, grid cells, and the brain's spatial representation system. Annu Rev Neurosci 31: 69–89, 2008 [DOI] [PubMed] [Google Scholar]
- Muir GM, Brown JE, Carey JP, Hirvonen TP, Della Santina CC, Minor LB, Taube JS. Disruption of the head direction cell signal after occlusion of the semicircular canals in the freely moving chinchilla. J Neurosci 29: 14521–14533, 2009 [DOI] [PMC free article] [PubMed] [Google Scholar]
- Neitz J, Jacobs GH. Reexamination of spectral mechanisms in the rat (Rattus norvegicus). J Comp Psychol 100: 21–29, 1986 [PubMed] [Google Scholar]
- Paxinos G, Watson C. The Rat Brain in Stereotaxic Coordinates (4th ed.). San Diego, CA: Academic, 1998 [Google Scholar]
- Redish AD, Elga AN, Touretzky DS. A coupled attractor model of the rodent head direction system. Netw Comput Neural Syst 7: 671–685, 1996 [Google Scholar]
- Robertson RG, Rolls ET, Georges-François P, Panzeri S. Head direction cells in the primate pre-subiculum. Hippocampus 9: 206–219, 1999 [DOI] [PubMed] [Google Scholar]
- Robinson DA. Integrating with neurons. Annu Rev Neurosci 12: 33–45, 1989 [DOI] [PubMed] [Google Scholar]
- Sargolini F, Fyhn M, Hafting T, McNaughton BL, Witter MP, Moser MB, Moser EI. Conjunctive representation of position, direction, and velocity in entorhinal cortex. Science 312: 758–762, 2006 [DOI] [PubMed] [Google Scholar]
- Sharp PE, Koester K. Lesions of the mammillary body region severely disrupt the cortical head direction, but not place cell signal. Hippocampus 18: 766–784, 2008 [DOI] [PubMed] [Google Scholar]
- Sharp PE, Blair HT, Cho J. The anatomical and computational basis of the rat head-direction cell signal. Trends Neurosci 24: 289–294, 2001a [DOI] [PubMed] [Google Scholar]
- Sharp PE, Tinkelman A, Cho J. Angular velocity and head direction signals recorded from the dorsal tegmental nucleus of Gudden in the rat: implications for path integration in the head direction cell circuit. Behav Neurosci 115: 571–588, 2001b [PubMed] [Google Scholar]
- Shinder ME, Taube JS. Active and passive movement are encoded equally by head direction cells in the anterodorsal thalamus. J Neurophysiol 106: 788–800, 2011 [DOI] [PMC free article] [PubMed] [Google Scholar]
- Skaggs WE, McNaughton BL, Gothard KM, Markus EJ. An information-theoretic approach to deciphering the hippocampal code. In: Advances in Neural Information Processing Systems, Vol. 5, edited by Hanson SJ, Cowan JD, Giles CL. San Mateo, CA: Morgan Kaufmann, 1993, p. 1030–1037 [Google Scholar]
- Skaggs WE, Knierim JJ, Kudrimoti HS, McNaughton BL. A model of the neural basis of the rat's sense of direction. In: Advances in Neural Information Processing Systems, Vol. 7, edited by Tesauro G, Touretzky DS, Leen TK. Cambridge, MA: MIT Press, 1995, p. 173–180 [PubMed] [Google Scholar]
- Stackman RW, Taube JS. Firing properties of head direction cells in rat anterior thalamic neurons: dependence upon vestibular input. J Neurosci 17: 4349–4358, 1997 [DOI] [PMC free article] [PubMed] [Google Scholar]
- Stackman RW, Taube JS. Firing properties of rat lateral mammillary single units: head direction, head pitch, and angular head velocity. J Neurosci 18: 9020–9037, 1998 [DOI] [PMC free article] [PubMed] [Google Scholar]
- Stackman RW, Clark AS, Taube JS. Hippocampal spatial representations require vestibular input. Hippocampus 12: 291–303, 2002 [DOI] [PMC free article] [PubMed] [Google Scholar]
- Stackman RW, Golob EJ, Bassett JP, Taube JS. Passive transport disrupts directional path integration by rat head direction cells. J Neurophysiol 90: 2862–2874, 2003 [DOI] [PubMed] [Google Scholar]
- Swanson LW. Brain Maps: Structure of the Rat Brain (2nd ed.). Amsterdam: Elsevier Science, 1998 [Google Scholar]
- Taube JS. Head direction cells recorded in the anterior thalamic nuclei of freely moving rats. J Neurosci 15: 70–86, 1995 [DOI] [PMC free article] [PubMed] [Google Scholar]
- Taube JS. The head direction signal: origins and sensory-motor integration. Annu Rev Neurosci 30: 181–207, 2007 [DOI] [PubMed] [Google Scholar]
- Taube JS, Bassett JP. Persistent neural activity in head direction cells. Cereb Cortex 13: 1162–1172, 2003 [DOI] [PubMed] [Google Scholar]
- Taube JS, Burton HL. Head direction cell activity monitored in a novel environment and during a cue conflict situation. J Neurophysiol 74: 1953–1971, 1995 [DOI] [PubMed] [Google Scholar]
- Taube JS, Muller RU. Comparisons of head direction cell activity in the postsubiculum and anterior thalamus of freely moving rats. Hippocampus 8: 87–108, 1998 [DOI] [PubMed] [Google Scholar]
- Taube JS, Muller RU, Ranck JB., Jr Head-direction cells recorded from the postsubiculum in freely moving rats. I. Description and quantitative analysis. J Neurosci 10: 420–435, 1990a [DOI] [PMC free article] [PubMed] [Google Scholar]
- Taube JS, Muller RU, Ranck JB., Jr Head-direction cells recorded from the postsubiculum in freely moving rats. II. Effects of environmental manipulations. J Neurosci 10: 436–447, 1990b [DOI] [PMC free article] [PubMed] [Google Scholar]
- van der Meer MA, Knierim JJ, Yoganarasimha D, Wood ER, van Rossum MC. Anticipation in the rodent head direction system can be explained by an interaction of head movements and vestibular firing properties. J Neurophysiol 98: 1883–1897, 2007 [DOI] [PubMed] [Google Scholar]
- Yoder R, Taube JS. Head direction cell activity in mice: robust directional signal depends on intact otolith organs. J Neurosci 29: 1061–1076, 2009 [DOI] [PMC free article] [PubMed] [Google Scholar]
- Yoder RM, Clark BJ, Taube JS. Origins of landmark encoding in the brain. Trends Neurosci 34: 561–571, 2011a [DOI] [PMC free article] [PubMed] [Google Scholar]
- Yoder RM, Clark BJ, Brown JE, Lamia MV, Valerio S, Shinder ME, Taube JS. Both visual and idiothetic cues contribute to head direction cell stability during navigation along complex routes. J Neurophysiol 105: 2989–3001, 2011b [DOI] [PMC free article] [PubMed] [Google Scholar]
- Zhang K. Representation of spatial orientation by the intrinsic dynamics of the head-direction cell ensemble: a theory. J Neurosci 16: 2112–2126, 1996 [DOI] [PMC free article] [PubMed] [Google Scholar]