

Abstract
The retina is divided into parallel and mostly independent ON and OFF pathways, but the ON pathway “cross” inhibits the OFF pathway. Cross inhibition was thought to improve signal processing by the OFF pathway, but its effect on contrast encoding had not been tested experimentally. To quantify the effect of cross inhibition on the encoding of contrast, we presented a dark flash to an in vitro preparation of the mammalian retina. We then recorded excitatory currents, inhibitory currents, membrane voltages, and spikes from OFF α-ganglion cells. The recordings were subjected to an ideal observer analysis that used Bayesian methods to determine how accurately the recordings detected the dark flash. We found that cross inhibition increases the detection accuracy of currents and membrane voltages. Yet these improvements in encoding do not fully reach the spike train, because cross inhibition also hyperpolarizes the OFF α-cell below spike threshold, preventing small signals in the membrane voltages at low contrast from reaching the spike train. The ultimate effect of cross inhibition is to increase the accuracy with which the spike train detects moderate contrast, but reduce the accuracy with which it detects low contrast. In apparent compensation for the loss of accuracy at low contrast, cross inhibition, by hyperpolarizing the OFF α-cell, reduces the number of spikes required to detect the dark flash and thereby increases encoding efficiency.
Keywords: retina, retinal bipolar cell, retinal ganglion cell, inhibition, vision
the retina is divided into parallel and mostly independent ON and OFF pathways, but the ON pathway “cross” inhibits the OFF pathway. In the light-adapted retina, two effects of cross inhibition on signals in the OFF pathway have been found. First, cross inhibition rectifies excitatory currents in OFF ganglion cells, presumably by modifying the output of OFF bipolar cells, with the result that the excitatory currents respond to negative contrasts and much less to positive contrasts (Liang and Freed 2010; Manookin et al. 2008; Molnar et al. 2009; Renteria et al. 2006). Second, cross inhibition supplies to OFF ganglion cells inhibitory currents that are less rectified than the excitatory currents and respond more equally to negative and positive contrasts (Manookin et al. 2008). Yet it remained unclear whether cross inhibition improves the contrast sensitivity of the OFF pathway because sensitivity depends on both signal and noise, and the effects of cross inhibition on noise in the OFF pathway had not been measured.
We used an “ideal observer” analysis to quantify how accurately the OFF pathway detects contrast. A rationale for applying this method starts with the observation that the same visual stimulus evokes a different response each time it is presented, sometimes producing a response identical to the response when the stimulus is absent (de Ruyter van Steveninck et al. 1997). As a result, a single neural response cannot predict whether a visual stimulus was presented with absolute certainty. Therefore, visual processing must take a probabilistic approach to detection that weighs the likelihood that a given neural response resulted from a given stimulus. Ideal observer analysis is a Bayesian method that formalizes this probabilistic approach. It is not assumed that the visual system analyzes neural responses in the same way as the ideal observer does. Instead, ideal observer analysis provides a measure of information that is available for a specific visual task. Thus the ideal observer does not provide a global measure of encoding like Shannon information, but a specific measure that can be related to visual behavior (Dhingra and Smith 2004; Geisler et al. 1991; Murphy and Rieke 2011; Xu et al. 2005).
We selected a particular type of OFF ganglion cell, the OFF α-cell, because its cross inhibitory circuit is well characterized (Manookin et al. 2008; Liang and Freed 2010). We presented the OFF α-cell with a specific visual task, which was to detect a dark flash. We recorded different instantiations of information as it flows from the α-cell's synaptic input to its spike output and thus included postsynaptic currents, membrane voltages, and spikes. We submitted these instantiations to an ideal observer analysis that detected whether the dark flash had occurred or not, and, by blocking cross inhibition, we were able to assess whether cross inhibition normally increased the accuracy of detection. We found that the ON pathway improved the accuracy of the OFF α-cell's excitatory currents and membrane potentials at low and moderate contrasts, but had a differential effect on the spike train, improving accuracy at moderate contrasts, but reducing accuracy at low contrast. In apparent compensation for this loss of accuracy at low contrast, cross inhibition reduces the number of spikes required to detect contrast, thus increasing the overall efficiency of contrast encoding.
MATERIALS AND METHODS
Tissue preparation.
An adult male Hartley guinea pig (450–600 g) was anesthetized with ketamine (133 mg/kg), xylazine (13 mg/kg), and pentobarbital (100 mg/kg); both eyes were removed before the animal was killed by anesthetic overdose. The animal protocol was reviewed and approved by the University of Pennsylvania Institutional Animal Care and Use Committee. All procedures were performed according to University of Pennsylvania and National Institutes of Health guidelines. A ∼1-cm2 piece of dorsal retina, attached to pigment epithelium, choroid, and sclera, was mounted flat in a chamber and superfused with Ames' medium (Sigma, St. Louis, MO) near 34°C. The Ames' medium was saturated with 95% O2/5% CO2, adjusted to ∼300 mOsm with glucose, and contained the following (in mM): 120 NaCl, 3.1 KCl, 0.5 KH2PO4, 23 NaHCO3, 1.2 MgSO4, 1.15 CaCl2, plus amino acids and vitamins (pH 7.4).
Recording.
A glass patch pipette (6–10 MΩ) was formed with a Sutter P-87 puller (Sutter, Novato, CA). For extracellular recording of spikes by the loose patch method, the electrode contained Ames' medium and formed a <1-GΩ seal. To record spikes in the whole cell mode, the pipette solution contained the following (in mM): 110 KOH, 110 gluconate, 10 NaCl, 1 EGTA 2.5 Na, 10 HEPES, 6 Lucifer yellow, and formed a >1-GΩ seal. To record currents or Vm in whole cell mode, spikes were blocked with a pipette solution containing the following (in mM): 110 CsOH, 120 gluconate, 10 NaOH, 1 EGTA 2.5 Na, 10 HEPES, 10 lidocaine N-ethyl chloride (QX-314 Cl), 6 Lucifer Yellow. Pipette solutions were adjusted to 310 mOsm with glucose and to pH 7.2 with gluconate. Given these pipette solutions, the calculated reversal potential for glutamate channels (Eglut) with equal permeability to Cs+, Na+, and K+ was ∼4 mV, and the calculated reversal potential for GABA and glycine receptors (ECl) was approximately −67 mV. Calculated values for Eglut and ECl have been confirmed by puffing agonists for glutamate and glycine receptors, respectively, on guinea pig OFF α-cell dendrites under voltage clamp (Beaudoin et al. 2008).
Recordings were acquired with a Multiclamp 700B patch-clamp amplifier and digitized online at 4 kHz for current-clamp recordings and 2 kHz for voltage-clamp recordings using pClamp 10 (8-pole Bessel filter, fc < 0.5 digitization rate, Axon Instruments, Axon.com). The holding voltage Vhold was corrected for a calculated liquid junction potential of ∼14 mV. For excitatory currents, Vhold was not corrected for a voltage drop Va due to the holding current Ihold across access resistance Ra because this voltage was small (Ra = 19.3 ± 2.1 MΩ, Ihold = −53.8 ± 7.5 pA, Va = −1.1 ± 0.2 mV). For inhibitory currents, however, Ihold and Vhold were larger, and so we used the amplifier to compensate for 50–60% of the Va (greater compensations produced oscillations that shortened recordings). To correct for the uncompensated Va, Vhold was calculated by the following formula:
| (1) |
where Vuncorrected is the uncorrected holding voltage. All drugs were added to the Ames' medium. L-AP4 (L-2-amino-4-phosphonobutyric acid, TOCRIS, 25 μM) was used to block metabotropic glutamate receptors. Strychnine (TOCRIS, 2 μM) was used to block glycine receptors. MFA (meclofenamic acid; SIGMA 100 μM) was used to block gap junctions.
Visual stimulus.
The stimulus was provided by a 556-nm light-emitting diode that projected diffusely over the entire ∼1-cm2 piece of retina. The circuitry driving the diode enabled a stimulus time constant of 140 μs. The flash stimulus was sampled at 1,000 Hz. The white-noise stimulus was randomly sampled at 1,000 Hz from a Gaussian distribution but limited to 30 Hz by low-pass filtering. The baseline intensity of the stimulus was 3 × 10⁵ photons·μm−2·s−1, resulting in a photoisomerization rate of 4.6 × 10⁴ R*·s−1 for a rod and 3.3 × 10⁴ R*·s−1 for an M cone (λrodmax = 500 nm, λconemax = 529, rod outer segment: 16.2 μm × 3 μm2, cone outer segment: 8 μm × 3 μm2) (Yin et al. 2006). Given these photoisomerization rates, the non-color opponent ganglion cells we recorded from the dorsal retina have responses that are approximately equally divided between rods and M cone signals (Yin et al. 2006). Stimulus contrast was measured as Michelson contrast: C = (Imax − Imin)/(Imax + Imin), where Imax is maximum current, and Imin is minimum current.
Bayesian analysis.
The probability of stimulus j conditional on response i is denoted p(sj|ri) and can be calculated by Bayes' Rule:
| (2) |
where p(ri|sj) is the probability of the response i conditional on stimulus j, p(ri) is the marginal probability of the response i, and p(sj) is the marginal probability of stimulus j.
The task was to guess which of two stimuli were presented by observing a single response i. The best guess is to choose the stimulus j for which p(sj|ri) is greatest. Yet to fully map p(sj|ri) for all j is impractical because it would require too many different stimuli. Instead, consider that the marginal probability of the response p(ri) is the same for both stimuli because it is the same response. Also, the marginal probability of the stimulus p(sj) can be made the same for both stimuli by presenting them with equal frequency. Thus for the purposes of comparing two stimuli, Eq. 2 can be simplified into a proportionality:
| (3) |
Therefore, the best strategy for this particular task is to map the distribution p(ri|sj) for two stimuli. Then upon observing a particular response i, the best guess becomes the stimulus j for which the distribution p(ri|sj) has the greatest value.
Fisher's linear discriminant.
We used Fisher's linear discriminant to construct the two probability distributions required for the Bayesian analysis. We started by dividing recordings into n time bins, resulting in values x1, x2, x3 … xn. Each value xn was multiplied by a factor λn, and the products summed to calculate the Fisher measure F = λ1x1 + λ2x2 + λ3x3 … λnxn. The Fisher measure can be represented as the dot product of vectors F = λ⃗·x⃗. When comparing two such probability distributions, the value of λ⃗ that produces the greatest separation (least overlap) of probability distributions is
| (4) |
where ∑j=1 and ∑j=2 are the covariance matrices of x for the two stimuli j = 1 and j = 2; the vectors μ⃗j=1 and μ⃗j=2 are the average of x⃗ for the two stimuli (Fisher 1936).
Ideal observer analysis.
The ideal observer analysis began by taking recordings of currents, voltages, or spikes from trials of the same contrast, and taking an equal number of trials where no contrast was presented (sham trials). Each recording was divided into n = 12 time bins, with the first bin starting when the stimulus began. We choose a bin width of 40 ms because it gave the greatest sensitivity (Dhingra and Smith 2004). Currents or voltages were averaged for each bin, or the number of spikes in each bin was counted, and the resulting number xn multiplied by the Fisher discriminant λn to give the Fisher measure (e.g., Fig. 1B). The probability distributions of the Fisher measure were constructed for the contrast and sham trials (e.g., Fig. 1C). These distributions served as the likelihood functions for a Bayesian analysis: each trial was compared with probability distributions for sham and contrast stimuli, and the stimulus with the higher probability (likelihood) for that Fisher measure was chosen as the predicted stimulus. The predicted stimulus was compared with the actual stimulus and the prediction scored as correct or incorrect.
Fig. 1.

L-2-amino-4-phosphonobutyric acid (L-AP4) decreases the accuracy with which excitatory currents in the OFF α-cell detect a dark flash. A: the top traces show a 100-ms dark flash at three example contrasts. Below are excitatory currents from an OFF α-cell in control and L-AP4 conditions. B: currents from each trial were divided into n = 12 time bins, and the current averaged for each bin to give xn. The top graph shows xn for a sham trial (0% contrast) and a trial with 4% contrast. The bottom graph shows the Fisher discriminant λn (materials and methods). C: the probability distributions of the Fisher measure F = ∑n xnλn for 0% and 4% contrasts. The two probability distributions were well separated in control but overlapped in L-AP4 (shaded region). D: the neurometric curves for excitatory currents in control and L-AP4 conditions. To construct neurometric curves, the data points were fit with a cumulative Weibull function: accuracy = 1 − 0.5 exp [−(contrast/a)b] (Quick 1974), where a is a scaling factor and b determines the slope. Error bars in this and subsequent figures indicate standard error of the mean. a.u., Arbitrary units.
Determination of cell type.
After extracellular recording, the patch pipette was removed, and another pipette was used in the whole cell mode to fill the cell with Lucifer Yellow. During whole cell recording, Lucifer Yellow diffused from the electrode into the cell. After filling the cell with Lucifer Yellow, the entire depth of the inner plexiform layer (IPL) was photographed using a combination of infrared illumination, epifluorescent illumination, and a cooled-CCD camera (Hamamatsu, Hamamatsu Photonics). The stratification of the fluorescent dendrites in the IPL was measured by counting the number of sections between its “top” and “bottom” edges, as marked by amacrine and ganglion cell somas, respectively.
We targeted large somas for recording (15- to 25-μm diameter). This improved our chances of recording from OFF α-cells, but also resulted in recordings from ON α, ON δ, OFF δ cells, and less often from other cell types. Thus α- and δ-cells were identified as those with dendritic trees greater than 250 μm in diameter (Freed and Liang 2010). OFF α- and OFF δ-cells were those that ramified in the top half of the IPL, but the OFF δ-cell ramified closer to the top edge of the IPL than the OFF α-cell (Freed and Liang 2010; Manookin et al. 2008; Rockhill et al. 2002).
To check this method of identification, we examined seven cells identified as OFF α-cells and five cells identified as OFF δ-cells by fixing the retina in 4% paraformaldehyde, staining for choline acetyl transferase (CHAT), and photographing a series of horizontal optical sections in a confocal microscope (Olympus Fluoview 1000). CHAT forms two bands: one in the top OFF half of the IPL, and the other in the bottom ON half. All cells that we had classified as OFF δ-cells by the combined infrared/epifluorescent method were above the OFF CHAT band; all cells that were classified by OFF α-cells were below this CHAT band, thus confirming our classification (Manookin et al. 2008).
RESULTS
The ON pathway increases the accuracy with which excitatory currents in the OFF α-cell detect a dark flash.
The stimulus was a 100-ms decrease in intensity throughout an OFF α-cell's receptive field: a “dark flash.” Such an extended stimulus evokes robust responses from a ganglion cell due to timing differences between the ganglion cell's receptive field center and surround (Frishman et al. 1987; Tokutake and Freed 2008). We varied the temporal contrast of the stimulus in random order, interleaving it with sham trials with zero contrast. Each contrast was repeated 100 times, requiring a typical recording time of 16 min.
We recorded excitatory currents from OFF α-cells by voltage clamping them at the reversal potential of inhibitory currents (ECl), thus removing the driving force across inhibitory conductances. The excitatory currents responded to the dark flash with an inward transient (Fig. 1A). The currents were submitted to an ideal observer analysis that predicted whether a sham trial or a trial with contrast had been presented (materials and methods). This prediction was compared with the actual trial and the accuracy of the prediction scored. The result of the ideal observer analysis was that, at the lowest contrast tested (0.25%), excitatory currents detected the flash with 61 ± 1% accuracy, just above the 50% that random guessing would produce (Fig. 1D). Accuracy increased sigmoidally with log contrast, until at the highest contrast (30%), prediction was perfect (100% accuracy).
The group III glutamate metabotropic receptor agonist, L-AP4, blocks photoreceptor input to the ON bipolar cell, and thus blocks cross inhibition from the ON to the OFF pathways (Manookin et al. 2008; Slaughter and Miller 1981). Application of L-AP4 reduced accuracy at most contrasts, but did not reduce accuracy at the contrasts that produced near chance or perfect accuracy (i.e., not at the lowest or highest contrasts tested). We concluded that normally the ON pathway increases the accuracy with which the OFF α-cell's excitatory currents detect a dark flash.
The ON pathway increases the OFF α spike train's accuracy at moderate contrast but reduces it at low contrast.
We recorded membrane voltages by current-clamping in the whole cell mode and included Cs and QX-314 in the pipette solution to block potassium and sodium channels, respectively, thus preventing spikes. We submitted these potentials to ideal observer analysis and found that blocking crossover inhibition with L-AP4 reduced the accuracy of membrane voltages at almost all contrasts as it had for excitatory currents (Figs. 2, A and B). Thus normally the ON pathway improves the accuracy with which the OFF α-cell's membrane voltages detect a dark flash.
Fig. 2.

L-AP4 has different effects on the accuracy of membrane voltages and the spike train. A: membrane voltages recorded in current clamp mode respond with a transient depolarization to the dark flash. B: L-AP4 reduced accuracy of the membrane voltages at almost all contrasts. C: spikes recorded in extracellular loose patch mode. D: L-AP4 reduced accuracy of the spike train at moderate contrast, but increased accuracy at low contrast. Contrast was normalized for each cell by fitting data points with the cumulative Weibull function and then dividing contrast by the scaling parameter a.
Because the ON pathway improves the accuracy with which the OFF α-cell's membrane voltages detect a dark flash, we predicted an improvement would occur for the spike train also. To test this, we recorded spikes extracellularly in the “loose patch” mode without disturbing the ionic gradients of the OFF α-cell (materials and methods) (Fig. 2C). When we applied the ideal observer analysis to the spike train, we found that blocking the ON pathway with L-AP4 decreased the accuracy of spikes at moderate contrasts, as expected (Fig. 2D). Yet contrary to prediction, L-AP4 increased accuracy at lower contrasts. Apparently the ON pathway normally increases the accuracy of the OFF α-cell's spike train at moderate contrasts, but decreases accuracy at low contrasts, a differential effect distinct from an overall improvement for the excitatory currents and membrane voltages.
The ON pathway prevents small signals in the OFF α-cell's membrane voltages from reaching the spike train.
To determine how the ON pathway reduces the accuracy of the spike train at low contrast, we noted that L-AP4 always depolarized the OFF α-cell (by 7.3 ± 1.6 mV) and increased spontaneous spiking (Fig. 2C). We hypothesized that, normally, cross inhibition hyperpolarizes the cell far enough below spike threshold that small signals at low contrast do not reach the spike train. To test this, we recorded in the whole cell current-clamp mode as before, but omitted Cs and QX-314 from the pipette solution to allow spiking. When we presented the dark flash, it produced a transient depolarization, and, if the depolarization was high enough, it triggered a burst of spikes (Fig. 3A). To estimate the threshold potential for spiking, we measured the peak membrane potential Vp and average spike rate S in a 40-ms window that captured the acceleration of spike rate during the burst. We averaged Vp and S across all contrasts of dark flash and fit their relationship with a rectified power function (Priebe and Ferster 2008):
| (5) |
where k is a gain factor, p is an exponent greater than one, and | |+ is equal to the enclosed quantity, if this quantity is positive, but is otherwise equal to zero (Fig. 3B). The spike threshold was taken as the value of the parameter Vth that produced the best fit. The result was that in control conditions, the peak of the depolarization Vp was below spike threshold Vth at low contrast and rose above spike threshold as contrast increased (Fig. 3, C and D). When the ON pathway was blocked with L-AP4, Vp was above spike threshold Vth for all contrasts. Thus we confirmed that, under control condition, cross inhibition from the ON pathway hyperpolarizes the OFF α-cell below spike threshold.
Fig. 3.

L-AP4 decreases the efficiency with which spikes encode contrast. A: the response to a dark flash was a depolarization and a burst of spikes. Membrane potential (black trace) was interpolated linearly through spikes. The peak membrane potential (Vp) and average spike rate S were measured in a 40-ms window (gray rectangle). The membrane potential Vm was measured between depolarizations. B: derivation of spike threshold Vth. Graph of spike rate S against peak depolarization Vp, fitted with Eq. 5, where Vth was a free parameter of the fit that defined a threshold potential for spiking (arrow). C: L-AP4 raised noise fluctuations and small depolarizations above spike threshold (Vth, dashed line), triggering spontaneous and evoked spikes (gray and black vertical lines, respectively). D: L-AP4 brought the quantify (Vp − Vth) above zero; thus the Vp evoked by the dark flash Vp was raised above spike threshold Vth. E: L-AP4 increased accuracy at low contrast and decreased accuracy at high contrast. Allowing the cell to recover from L-AP4 and then depolarizing it to the membrane potential measured in L-AP4 increased accuracy at low contrast. F: efficiency with which spikes detected contrast was expressed in units (contrast·spikes/s)−1. The efficiency was calculated from contrasts at two criterion accuracies (90% and 68%; see text). For either criterion contrast, efficiency was reduced by L-AP4. Asterisks (*) show values statistically different from zero by t-test. G: efficiency is plotted against the membrane potential Vm referenced to the spike threshold Vth, expressed in units Vm − Vth. As Vm was altered by injecting current, efficiency peaked at the resting potential of the cell (gray rectangle indicates mean resting potential ± SE).
If normally cross inhibition hyperpolarizes the OFF α-cell so far below spike threshold that small signals in its membrane voltages would fail to reach the spike train, this should reduce accuracy at low contrasts that evoke small signals. If so, then depolarizing the OFF α-cell should improve accuracy at low contrast. To test this, we recorded spikes in current-clamp, applied L-AP4, and noted the degree of depolarization that this caused. We removed L-AP4, allowed the cell to repolarize, and then injected positive current sufficient to depolarize it to the level we measured in L-AP4. After the ideal observer analysis, we found that, at low contrast, depolarization improved accuracy, so that it equaled the accuracy obtained in L-AP4. At moderate contrasts, this depolarization had little effect on accuracy, presumably because, in the control condition, larger flash-evoked depolarizations were already above spike threshold (Fig. 3E). Thus we confirmed that normally cross inhibition hyperpolarizes the OFF α-cell sufficiently to reduce detection accuracy at low contrast.
The ON pathway increases the efficiency with which the OFF α-cell's spikes detect a dark flash.
Cross inhibition improves the accuracy of the OFF α-cell's spike train at moderate contrasts: this was demonstrated by both loose-patch extracellular and current-clamp recordings of the OFF α-cell (Figs. 2D and 3F); this improvement is apparently inherited from excitatory currents and membrane voltages (Figs. 1D and 2B). Yet, at low contrast, cross inhibition also prevents small signals in the membrane potential from reaching the spike train (Fig. 3C), and we sought a rationale for this. A possible rationale was that cross inhibition, by hyperpolarizing the membrane potential, reduces the number of spikes used to detect contrast. Saving spikes is energetically important because ATP is required to reestablish the gradients that spikes expend (Alle et al. 2009; Howarth et al. 2009). Furthermore, naturalistic stimuli cause a ganglion cell to fire in bursts which provide a sparse energy-efficient strategy for encoding information, a strategy that would be disrupted by excessive spontaneous firing (Balasubramanian and Berry 2002).
To test the idea that cross inhibition reduces the number of spikes required to detect contrast, we derived a measure of how efficiently spikes are used to detect contrast. We determined the contrast at a criterion accuracy, inverting this contrast to obtain a measure of contrast sensitivity and then divided contrast sensitivity by the spikes per second (sps) resulting in the units (contrast·sps−1). This measure of efficiency, calculated with either 68% or 90% criterion accuracy, was reduced by L-AP4 (90% criterion: from 17.9 ± 2.7 to 3.0 ± 0.5; 68% criterion: from 50.0 ± 8.3 to 15.4 ± 5.2) (Fig. 3F). Thus cross inhibition normally increases the efficiency with which the OFF α-cell's spikes detect contrast.
We also varied the membrane potential to observe the effect on detection efficiency. The membrane potential Vm was measured between dark flashes and then referenced to the spike threshold Vth to provide the measure Vm − Vth. Efficiency peaked at Vm − Vth = −1.5 ± 0.2 mV, and thus the most efficient Vm was 1.5 mV below the spike threshold (Fig. 3F). The resting Vm, Vrest, without current injection was 1.7 mV below spike threshold and very close to the Vm that provided peak efficiency (Vrest − Vth = −1.7 ± 0.8 mV; shaded region in Fig. 3G). Thus the ON pathway provides cross inhibition that holds the OFF α-cell to a Vm that most efficiently use spikes to detect contrast.
The ON pathway reduces tonic noise more than dynamic noise in the OFF α-cell's excitatory currents.
To improve detection accuracy of excitatory currents, cross inhibition increased the distance between the Bayesian probability distributions and reduced their widths, which is equivalent to increasing signal and reducing noise (Fig. 1C). To confirm these effects on signal and noise, we reanalyzed the excitatory currents, but, instead of the Fisher transformation, we measured signal as the average amplitude of the flash responses R and noise as the standard deviation of their amplitude σR (Fig. 4A). L-AP4 had little effect on signal at low contrast, but divisively reduced signal at moderate contrasts, i.e., as if by dividing it by a constant factor of about 2 (Fig. 4B). Thus the ON pathway normally increases signal in excitatory currents in the OFF α-cell.
Fig. 4.

L-AP4 increases noise and reduces signal in excitatory currents from the OFF α-cell. A: current evoked by dark flash. The signal R was measured from the average currents in two 40-ms windows (gray rectangles). Noise σR was measured as the standard deviation of R across stimulus trials. B: signal R graphed against contrast was fit with the Naka-Rushton function, R = Rmaxcn+z/(cn + c50n) + K, where c is contrast; and c50, n, and z are fitted parameters. Note that both axes are log scale: thus above 1% contrast, L-AP4 reduces signal by about twofold. C: noise σR graphed against contrast was fit with the square root of the Naka-Rushton function. Noise is approximately equal to its value at zero contrast up to and including 2% contrast in control and 8% contrast in L-AP4 (dashed lines). L-AP4 reduced noise at low contrasts, but not at moderate contrasts.
Noise increased with contrast in a stepwise manner. In control (black curve, Fig. 4C), noise remained at the levels found at zero contrast up to and including 2% contrast, suggesting that tonic noise at zero contrast explained the variability of responses. As contrast rose above 2%, noise rose above the tonic level, suggesting additional dynamically generated noise. Similarly, in L-AP4, noise remained at tonic levels up to and including 8% contrast; above this contrast, the dynamically generated noise appeared (Fig. 4C, red curve). It was in the range of contrasts that maintained tonic levels of noise (≤8%), that L-AP4 increased noise by a factor of 1.9. At higher contrast, L-AP4 had no significant effect on noise, indicating that blocking cross inhibition did not greatly affect the dynamically generated noise. Thus the flash experiments indicated that cross inhibition's main effect on noise in excitatory currents is to reduce a tonic component.
The ON pathway's ability to reduce noise in excitatory currents depends on gap junctions.
We next asked by which circuits cross inhibition reduced noise in excitatory currents. To test this, we used a stimulus that made best use of finite recording time to measure noise over multiple drug conditions. The stimulus consisted of 3 s of white noise followed by 2 s of steady intensity. We repeated the stimulus and recorded excitatory currents by clamping at the reversal potential for inhibitory currents (ECl) as before. The white noise evoked a series of inward events whose amplitude averaged over stimulus repeats we calculated as signal (Ievent), and whose standard deviation we calculated as noise (σevent) (Fig. 5A). The steady intensity evoked a tonic current (Itonic).
Fig. 5.
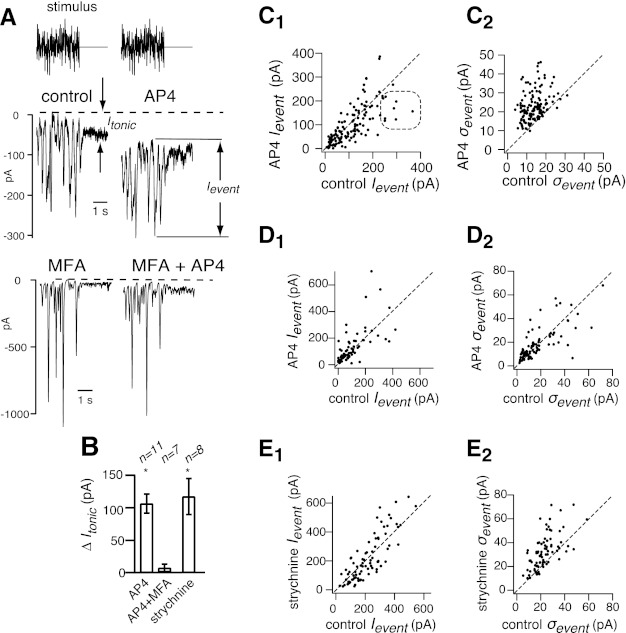
Effect of L-AP4 on noise in excitatory currents depends on gap junctions. A: the stimulus was white noise followed by a constant intensity that was equal to the mean of the white noise. Excitatory currents are shown with control baseline subtracted from them (dashed line). Currents consist of inward deflections (Ievent) followed by tonic current Itonic. At top, the effect of L-AP4 on currents is shown, and, at bottom, the effect of L-AP4 in the presence of the gap junction blocker meclofenamic acid (MFA). B: L-AP4 increased the tonic current, but not if the gap junction blocker MFA was applied beforehand. The glycine receptor antagonist increased tonic current about as much as L-AP4 did. Asterisks (*) show values statistically different from zero by t-test. C1: diagonal plots of signal (Ievent) in L-AP4 against signal in control. Each point represents an inward event. Points lie on the diagonal, showing that L-AP4 had no consistent effect on signal, although some large events lie below the diagonal, showing that L-AP4 reduced signal (rounded rectangle). C2: diagonal plot of noise σevent. Points lie above the diagonal, indicating that L-AP4 increased noise associated with inward events. D1 and D2: diagonal plots of signal and noise show effect of L-AP4 with MFA applied beforehand. L-AP4 had no consistent effect on signal, with or without MFA, but MFA blocked the effect of L-AP4 on noise. E1 and E2: strychnine had effects on signal and noise similar to those of L-AP4 (C1 and C2).
L-AP4 had no consistent effect on signal, but reduced the signal associated with rare large events, which presumably corresponds to the reduction of signal at moderate contrast we found for the dark flash stimulus (Fig. 5C1). L-AP4 also dramatically increased noise as it had for the flash stimulus (σevent = 13.8 ± 0.4 pA in control, σevent = 23.4 ± 0.7 pA in L-AP4) (Fig. 5C2). L-AP4 shifted the baseline of the inward events inward and increased the tonic inward current (ΔItonic = −106 ± 15 pA) (Fig. 5, A and B).
The AII is a glycinergic amacrine cell that couples electrically by gap junctions with the ON bipolar cell and synapses on the OFF bipolar cell (see Fig. 7B) (Famiglietti and Kolb, 1975; Liang and Freed 2010; Petrides and Trexler 2008; Veruki and Hartveit 2009). We hypothesized this circuit allows the ON bipolar cell to reduce noise in excitatory currents. If this is true, then blocking gap junction between the AII amacrine cell and ON bipolar cells should prevent L-AP4 from increasing noise. To test this, we applied MFA, which blocks this gap junction, and then applied L-AP4 (Veruki and Hartveit 2009). In the presence of MFA, L-AP4 had no consistent effect on signal (Ievent)(Fig. 5D1). MFA suppressed the effects of L-AP4 on noise (σevent = 17.1 ± 1.5 pA in control; σevent = 18.2 ± 1.4 pA in L-AP4) and on tonic current (ΔItonic = −6.4 + 6.0 pA) (Fig. 5, B and 5D2).
Fig. 7.

Effects of cross inhibition on information encoding by the OFF α-cell. A: compilation of neurometric curves taken from previous figures. Our findings rank the OFF α-cell's excitatory currents, inhibitory currents, membrane voltages, and spikes according to how accurately they detect a dark flash: excitatory postsynaptic current (EPSC) ≈ Vm > inhibitory postsynaptic current (IPSC) > spikes. B: the cross circuit begins at the ON bipolar cell, which couples electrically by a gap junction (-| |-) to the AII amacrine cell, which makes glycinergic synapses (−) on the OFF bipolar cell and OFF α-cell. Other amacrine cells (not shown) may provide additional cross inhibition to the OFF α-cell (discussion). Presynaptic cross inhibition mediated by the AII amacrine cell reduces noise in the excitatory currents. Postsynaptic cross inhibition, mediated by the AII amacrine cell and possibly other unidentified amacrine cells, encodes information about the flash. Tonic pre- and postsynaptic cross inhibition hyperpolarizes the OFF α-cell to just below spike threshold, reducing the number of spike required to detect the flash. Synaptic blockers used in this investigation are indicated in red (L-AP4, strychnine, MFA).
The glycine receptor antagonist strychnine had effects that were entirely similar to those of L-AP4. Strychnine had no consistent effect on signal (Fig. 5E1) but consistently increased noise (σevent = 23.1 ± 1.1 pA in control; σevent = 32.3 ± 1.6 pA in strychnine) and tonic current (ΔItonic = 117.3 ± 27.8 pA) (Fig. 5, B and E2). In conclusion, the effects of L-AP4 on noise were blocked by MFA and similar to those of strychnine, suggesting that the AII amacrine cell is a component of the cross circuit that suppresses noise in the OFF α-cell's excitatory currents (see discussion).
Cross inhibition provides an inhibitory current directly to the OFF α-cell that encodes information about contrast.
Next we recorded postsynaptic inhibitory currents by voltage clamping the OFF α-cell at the reversal potential of excitatory currents, presented the dark flash stimulus as before, and then subjected the inhibitory currents to ideal observer analysis (Fig. 6A). The accuracy of the inhibitory currents was substantially less than those of the excitatory currents at all contrasts, yet they clearly encoded information about the dark flash (Fig. 6B).
Fig. 6.

Cross inhibition provides an inhibitory current directly to the OFF α-cell that encodes information about contrast. A: the stimulus was a dark flash. Inhibitory currents responded with an inward transient at the onset of the dark flash and then an outward transient at its offset. B: neurometric curve for inhibitory currents (green) shows that inhibitory currents were less accurate than excitatory currents (taken from Fig. 1, black curve). C: the stimulus was white noise stimulus followed by steady intensity. Inhibitory currents show a series of outward currents followed by smaller spontaneous outward events. We measured the average current (Itonic) and standard deviation of currents during white noise and steady intensity (σwn and σtonic). D: summary of effects of L-AP4 on inhibitory currents. L-AP4 reduced the tonic outward inhibitory current by amount ΔItonic and brought light-evoked modulation (Wwn/σtonic − 1) close to zero.
To measure how much of the postsynaptic inhibitory signal was supplied by cross inhibition, we measured how much L-AP4 blocked the light-evoked modulation of the inhibitory current. Thus we presented the stimulus that combined white noise followed by a steady intensity and recorded inhibitory currents (Fig. 6C). To quantify light-evoked modulation, we measured the standard deviation of currents during white noise and steady intensity (σwn and σtonic, respectively) then calculated σwn/σtonic − 1, which would be equal to zero if light-evoked currents were just at the level of tonic noise. Modulation was 3.6 ± 1.1 in control and declined to 0.4 ± 0.2 in L-AP4, so about 11% of modulation resisted L-AP4 (Fig. 6D). Apparently the ON pathway provides the remainder of the modulation, about 89%.
Both pre- and postsynaptic cross inhibition tonically hyperpolarize the OFF α-cell.
To determine how cross inhibition hyperpolarizes the OFF α-cell, we examined the tonic currents from the steady intensity following the white noise stimulus. We had already found that L-AP4 caused the tonic excitatory current to shift inward by ΔItonic = −106 ± 15 pA, a presynaptic effect of cross inhibition (Fig. 5B). To measure the postsynaptic effects of cross inhibition, we recorded tonic inhibitory currents while presenting the white noise/steady intensity stimulus and found that L-AP4 caused the tonic inhibitory currents to shift inward by ΔItonic = −522 ± 51 pA (Fig. 6D).
To record either excitatory or inhibitory currents, we had clamped the OFF α-cell at ECl = −67 mV or Eglut ∼ 0 mV, so that the driving forces for excitatory and inhibitory conductances were opposite with absolute values equal to Eglut − ECl. Yet in the intact cell, these driving forces are set by the resting potential and the intact ionic gradients (Vrest −62 to −65 mV; Eglut ∼ 0 mV; ECl = −80 mV) (Dhingra and Smith 2004; Murphy and Rieke 2006; Zaghloul et al. 2003) (materials and methods). Thus the driving force for excitation is about 3 to 4 times that of inhibition (Manookin et al. 2008). Assuming the tonic conductances under voltage clamp and intact conditions are equal, it is possible to extrapolate from the voltage-clamp recordings to the intact OFF α-cell and thus estimate the tonic effects of cross inhibition on excitatory and inhibitory currents in the intact OFF α-cell:
| (6) |
where ΔItonic is the current blocked by L-AP4 measured under voltage clamp, and Erev equals ECl or Eglut for determining inhibitory and excitatory currents, respectively (materials and methods). By this equation, cross inhibition reduces the excitatory, inward currents by 82 to 86 pA, a presynaptic effect of hyperpolarizing the OFF bipolar cell. By this equation, cross inhibition increases the inhibitory outward currents by 98 to 117 pA, a postsynaptic effect on the OFF α-cell. Because presynaptic cross inhibition reduces an inward current in the OFF α-cell only slightly less than postsynaptic cross increases an outward current, this implies that presynaptic cross inhibition hyperpolarizes the OFF α-cell only slightly less than postsynaptic cross inhibition does.
DISCUSSION
Our results support four conclusions about how cross inhibition from the ON pathway contributes to the detection of a dark flash by the OFF α-cell. 1) Cross inhibition decreases noise and increases signal in the OFF α-cell's excitatory currents and thereby increases their detection accuracy: a presynaptic contribution. 2) Cross inhibition provides an inhibitory current directly to the OFF α-cell that encodes information about contrast: a postsynaptic contribution. 3) By pre- and postsynaptic contributions to excitatory and inhibitory currents, cross inhibition improves the accuracy of the OFF α-cell's membrane voltages. 4) Cross inhibition improves the accuracy of the OFF α-cell's spikes at moderate contrasts, but decreases their accuracy at low contrast by hyperpolarizing the OFF α-cell below spike threshold, preventing small depolarizations evoked by low contrast from triggering spikes.
Presynaptic cross circuit reduces noise in the OFF α-cell's excitatory currents.
There are many glycinergic amacrine cells, with dendrites in ON and OFF divisions of the IPL, which could mediate the effect of the ON pathway on excitatory currents in the OFF α-cell (MacNeil and Masland 1998; Menger et al. 1998). Among them, the AII amacrine cell is the most likely to mediate noise reduction for several reasons. First, the AII is the most common amacrine cell in mammalian retina (13% of total population, 20–30% of glycinergic amacrine cells) (MacNeil and Masland 1998; Menger et al. 1998). Second, the AII is coupled electrically to 80% of ON bipolar cells (Petrides and Trexler 2008). Finally, our white-noise experiments show that blocking the ON bipolar cell or glycinergic synapses increases noise in excitatory currents and that the noise-increasing effect of blocking the ON bipolar cell is suppressed by the gap junction blocker MFA, implying that the AII amacrine cell decreases noise in the OFF α-cell's excitatory currents (Fig. 7B).
Metabotropic glutamate receptors on the axon terminals of some OFF bipolar cells bind L-AP4 and reduce transient inward currents recorded in OFF ganglion cells (Awatramani and Slaughter 2001; Higgs et al. 2002). We considered whether such “autoreceptors” could explain the effects of L-AP4 we observed, but found enough differences between these observed effects and the reported autoreceptor effects to discount this idea. First, in our experiments L-AP4 shifted tonic excitatory currents inward, but the binding of L-AP4 to autoreceptors does not (Fig. 5A). Second, in our experiments L-AP4 reduced signals at moderate contrast more than at low contrast, but autoreceptors reduce signals more at low contrast (Fig. 4B) (Awatramani and Slaughter 2001). Third, unlike the effects we observe, the autoreceptor effects of L-AP4 are immune to blocking glycinergic synapses and do not require functioning gap junctions.
How does the cross circuit reduce noise in the OFF α-cell's excitatory currents? In previous studies, we had found that cross inhibition hyperpolarizes OFF bipolar cells so close to the threshold for transmitter release, that depolarizing the bipolar cell increases transmitter release onto the postsynaptic OFF α-cell, but hyperpolarizing the bipolar cell has a much smaller effect on transmitter release; as a result, the excitatory currents evoked by light are rectified, and the tonic rate of transmitter release is minimized (Liang and Freed 2010). Noise in excitatory currents increases as the square root of the mean current, apparently because glutamate quanta follow Poisson statistics, and so reducing tonic current should reduce noise (Freed 2005; Freed and Liang 2010). The present experiments confirm this prediction and expand upon it by showing that noise reduction increases contrast sensitivity. Furthermore, we find evidence that L-AP4 increases tonic noise at zero contrast but not noise dynamically generated at higher contrasts, suggesting that cross inhibition reducing tonic current is a sufficient explanation for its effect on noise at all contrasts (Fig. 4C).
Postsynaptic cross circuit encodes contrast information.
We found that both inhibitory and excitatory postsynaptic currents encoded information about the dark flash, but the inhibitory currents detected the flash less accurately (Fig. 7A). This imbalance between inhibition and excitation may not be generally true of all stimuli or detection tasks. For example, to a bright flash, the inhibitory input produces a large outward current that encodes as much information as an (inward) excitatory current does about a dark flash (unpublished observations). For our dark flash experiments, most of the information encoded by the inhibitory currents originates in the ON pathway because L-AP4 blocked 89% of the light-induced modulation (Fig. 6D).
There are three known cross circuits that could transmit information from the ON pathway to postsynaptic inhibitory currents in OFF ganglion cells. 1) The AII amacrine cell receives electrical synapses from the ON bipolar cell and makes glycinergic synapses on the OFF α-cell (Cohen 1998; Manookin et al. 2008; Molnar et al. 2009; Nobles et al. 2012). 2) A second ON amacrine cell receives excitatory chemical synapses from the ON bipolar cell and makes glycinergic synapses on the PV-5, an OFF α-like cell in mouse (Munch et al. 2009). 3) ON amacrine cells receive excitatory input from the ON pathway and synapse electrically on OFF α-like ganglion cells in rabbit and mouse (Farajian et al. 2011; Murphy and Rieke 2011). The input from this electrical synapse can be demonstrated when light is flashed in near-absolute darkness: a transient inward current is observed at the termination of this flash (Murphy and Rieke 2011). If GABAA and GABAC receptors are blocked, a transient inward current is observed at the onset of this flash (Farajian et al. 2011). Circuit 3 is unlikely to have contributed to the currents that we recorded because we presented a dark flash on a much more intense background (104 R*·s−1 for a rod), and we did not block GABA receptors. Thus of these three circuits, it is most likely that circuits 1 or 2 transmit information to the OFF ganglion cell.
In our experiments, basal illumination provided about equal isomerization rates for rods and cones, and accordingly about half the signal in the OFF α-cell was from cones and the remainder from rods (Yin et al. 2006) (materials and methods). This raises the question of whether the rod signal could have come through the rod bipolar cell, which synapses on the AII amacrine cell, before it entered the α-cell's inhibitory currents. Yet under lighting conditions similar to those of our experiments and in the same species of animal, the OFF α-cell's inhibitory currents respond to light after ionotropic glutamate receptors are blocked (Manookin et al. 2008) (unpublished experiments). Because the rod bipolar cell → AII amacrine cell synapse is susceptible to this block (Pang et al. 2007; Trexler et al. 2005; Xin and Bloomfield 1999), the inhibitory currents could not have been driven by the rod bipolar cell. Instead, in our experiments, the rod signal most likely came through gap junctions that the rod makes with cones, mixed with cone signals, and flowed into the cone bipolar pathways.
Both pre- and postsynaptic cross circuits improve the efficiency of spike encoding.
The ON pathway supplies pre- and postsynaptic cross inhibition to the OFF α-cell (Fig. 7B). Presynaptic cross inhibition tonically reduces the excitatory inward current, postsynaptic cross inhibition supplies a tonic outward current, and thus both pre- and postsynaptic cross inhibition tonically hyperpolarize the OFF α-cell. Counteracting pre- and postsynaptic hyperpolarizations by injecting positive current raised the OFF α-cell's membrane potential above spike threshold, allowed small depolarizations to trigger spikes, and increased the transfer of information at low contrasts from membrane voltages to spike train. However, even when the OFF α-cell was depolarized, its spike train encoded less information for the detection task than either its Vm or its excitatory currents (Fig. 7A). Thus we confirm what has been observed before: a substantial and perhaps irreducible bottleneck in the flow of information from Vm to spike trains (de Ruyter van Steveninck and Laughlin 1996; Dhingra and Smith 2004; Haag and Borst 1998). The points we make here is that cross inhibition makes this bottleneck worse at low contrast by hyperpolarizing the membrane potential, but that this hyperpolarization has a compensating effect, which is to set the membrane potential to just below spike threshold, thus reducing spike rate (Fig. 3D), and maximizing the efficiency with which spikes encode information about moderate contrasts (Fig. 3G).
GRANTS
This work is supported by National Eye Institute Grant EY-013333 to M. A. Freed.
DISCLOSURES
No conflicts of interest, financial or otherwise, are declared by the author(s).
AUTHOR CONTRIBUTIONS
Author contributions: Z.L. and M.A.F. conception and design of research; Z.L. performed experiments; Z.L. analyzed data; Z.L. and M.A.F. interpreted results of experiments; Z.L. and M.A.F. prepared figures; Z.L. and M.A.F. drafted manuscript; Z.L. and M.A.F. edited and revised manuscript; Z.L. and M.A.F. approved final version of manuscript.
REFERENCES
- Alle H, Roth A, Geiger JR. Energy-efficient action potentials in hippocampal mossy fibers. Science 325: 1405–1408, 2009 [DOI] [PubMed] [Google Scholar]
- Awatramani GB, Slaughter MM. Intensity-dependent, rapid activation of presynaptic metabotropic glutamate receptors at a central synapse. J Neurosci 21: 741–749, 2001 [DOI] [PMC free article] [PubMed] [Google Scholar]
- Balasubramanian V, Berry MJ., 2nd A test of metabolically efficient coding in the retina. Network 13: 531–552, 2002 [PubMed] [Google Scholar]
- Cohen ED. Interactions of inhibition and excitation in the light-evoked currents of X type retinal ganglion cells. J Neurophysiol 80: 2975–2990, 1998 [DOI] [PubMed] [Google Scholar]
- de Ruyter van Steveninck RR, Lewen GD, Strong SP, Koberle R, Bialek W. Reproducibility and variability in neural spike trains. Science 275: 1805–1808, 1997 [DOI] [PubMed] [Google Scholar]
- Dhingra NK, Smith RG. Spike generator limits efficiency of information transfer in a retinal ganglion cell. J Neurosci 24: 2914–2922, 2004 [DOI] [PMC free article] [PubMed] [Google Scholar]
- Famiglietti EVJ, Kolb H. A bistratified amacrine cell and synaptic cirucitry in the inner plexiform layer of the retina. Brain Res 84: 293–300, 1975 [DOI] [PubMed] [Google Scholar]
- Farajian R, Pan F, Akopian A, Volgyi B, Bloomfield SA. Masked excitatory crosstalk between the ON and OFF visual pathways in the mammalian retina. J Physiol 589: 4473–4489, 2011 [DOI] [PMC free article] [PubMed] [Google Scholar]
- Fisher RA. The use of multiple measures in taxonomic problems. Ann Eugen 7: 179–188, 1936 [Google Scholar]
- Freed MA. Quantal encoding of information in a retinal ganglion cell. J Neurophysiol 94: 1048–1056, 2005 [DOI] [PubMed] [Google Scholar]
- Freed MA, Liang Z. Reliability and frequency response of excitatory signals transmitted to different types of retinal ganglion cell. J Neurophysiol 103: 1508–1517, 2010 [DOI] [PMC free article] [PubMed] [Google Scholar]
- Frishman LJ, Freeman AW, Troy JB, Shweitzer-Tong DE, Enroth-Cugell C. Spatiotemporal frequency responses of cat retinal ganglion cells. J Gen Physiol 89: 599–627, 1987 [DOI] [PMC free article] [PubMed] [Google Scholar]
- Geisler WS, Albrecht DG, Salvi RJ, Saunders SS. Discrimination performance of single neurons: rate and temporal-pattern information. J Neurophysiol 66: 334–362, 1991 [DOI] [PubMed] [Google Scholar]
- Haag J, Borst A. Active membrane properties and signal encoding in graded potential neurons. J Neurosci 18: 7972–7986, 1998 [DOI] [PMC free article] [PubMed] [Google Scholar]
- Higgs MH, Romano C, Lukasiewicz PD. Presynaptic effects of group III metabotropic glutamate receptors on excitatory synaptic transmission in the retina. Neuroscience 115: 163–172, 2002 [DOI] [PubMed] [Google Scholar]
- Howarth C, Peppiatt-Wildman CM, Attwell D. The energy use associated with neural computation in the cerebellum. J Cereb Blood Flow Metab 30: 403–414, 2010 [DOI] [PMC free article] [PubMed] [Google Scholar]
- Koch K, McLean J, Berry M, Sterling P, Balasubramanian V, Freed MA. Efficiency of information transmission by retinal ganglion cells. Curr Biol 14: 1523–1530, 2004 [DOI] [PubMed] [Google Scholar]
- Liang J, Freed MA. The On pathway rectifies the Off pathway of the mammalian retina. J Neurosci 30: 5533–5543, 2010 [DOI] [PMC free article] [PubMed] [Google Scholar]
- MacNeil MA, Masland RH. Extreme diversity among amacrine cells: implications for function. Neuron 20: 971–982, 1998 [DOI] [PubMed] [Google Scholar]
- Manookin MB, Beaudoin DL, Ernst ZR, Flagel LJ, Demb JB. Disinhibition combines with excitation to extend the operating range of the OFF visual pathway in daylight. J Neurosci 28: 4136–4150, 2008 [DOI] [PMC free article] [PubMed] [Google Scholar]
- Menger N, Pow DV, Wassle H. Glycinergic amacrine cells of the rat retina. J Comp Neurol 401: 34–46, 1998 [DOI] [PubMed] [Google Scholar]
- Molnar A, Hsueh HA, Roska B, Werblin FS. Crossover inhibition in the retina: circuitry that compensates for nonlinear rectifying synaptic transmission. J Comput Neurosci 27: 569–590, 2009 [DOI] [PMC free article] [PubMed] [Google Scholar]
- Munch TA, da Silveira RA, Siegert S, Viney TJ, Awatramani GB, Roska B. Approach sensitivity in the retina processed by a multifunctional neural circuit. Nat Neurosci 12: 1308–1316, 2009 [DOI] [PubMed] [Google Scholar]
- Murphy GJ, Rieke F. Network variability limits stimulus-evoked spike timing precision in retinal ganglion cells. Neuron 52: 511–524, 2006 [DOI] [PMC free article] [PubMed] [Google Scholar]
- Murphy GJ, Rieke F. Electrical synaptic input to ganglion cells underlies differences in the output and absolute sensitivity of parallel retinal circuits. J Neurosci 31: 12218–12228, 2011 [DOI] [PMC free article] [PubMed] [Google Scholar]
- Nobles RD, Zhang C, Muller U, Betz H, McCall MA. Selective glycine receptor alpha2 subunit control of crossover inhibition between the on and off retinal pathways. J Neurosci 32: 3321–3332, 2012 [DOI] [PMC free article] [PubMed] [Google Scholar]
- Pang JJ, Abd-El-Barr MM, Gao F, Bramblett DE, Paul DL, Wu SM. Relative contributions of rod and cone bipolar cell inputs to AII amacrine cell light responses in the mouse retina. J Physiol 580: 397–410, 2007 [DOI] [PMC free article] [PubMed] [Google Scholar]
- Petrides A, Trexler EB. Differential output of the high-sensitivity rod photoreceptor: AII amacrine pathway. J Comp Neurol 507: 1653–1662, 2008 [DOI] [PMC free article] [PubMed] [Google Scholar]
- Priebe NJ, Ferster D. Inhibition, spike threshold, and stimulus selectivity in primary visual cortex. Neuron 57: 482–497, 2008 [DOI] [PubMed] [Google Scholar]
- Renteria RC, Tian N, Cang J, Nakanishi S, Stryker MP, Copenhagen DR. Intrinsic ON responses of the retinal OFF pathway are suppressed by the ON pathway. J Neurosci 26: 11857–11869, 2006 [DOI] [PMC free article] [PubMed] [Google Scholar]
- Rockhill RL, Daly FJ, MacNeil MA, Brown SP, Masland RH. The diversity of ganglion cells in a mammalian retina. J Neurosci 22: 3831–3843, 2002 [DOI] [PMC free article] [PubMed] [Google Scholar]
- Shannon CE, Weaver W. Mathematical Theory of Communication. Champaign, IL: University of Illinois Press, 1963 [Google Scholar]
- Slaughter MM, Miller RF. 2-Amino-4-phosphonobutyric acid: a new pharmacological tool for retina research. Science 211: 182–185, 1981 [DOI] [PubMed] [Google Scholar]
- Tokutake Y, Freed MA. Retinal ganglion cells–spatial organization of the receptive field reduces temporal redundancy. Eur J Neurosci 28: 914–923, 2008 [DOI] [PMC free article] [PubMed] [Google Scholar]
- Trexler EB, Li W, Massey SC. Simultaneous contribution of two rod pathways to AII amacrine and cone bipolar cell light responses. J Neurophysiol 93: 1476–1485, 2005 [DOI] [PubMed] [Google Scholar]
- Veruki ML, Hartveit E. Meclofenamic acid blocks electrical synapses of retinal AII amacrine and on-cone bipolar cells. J Neurophysiol 101: 2339–2347, 2009 [DOI] [PubMed] [Google Scholar]
- Xin D, Bloomfield SA. Comparison of the responses of AII amacrine cells in the dark- and light-adapted rabbit retina. Vis Neurosci 16: 653–665, 1999 [DOI] [PubMed] [Google Scholar]
- Xu Y, Dhingra NK, Smith RG, Sterling P. Sluggish and brisk ganglion cells detect contrast with similar sensitivity. J Neurophysiol 93: 2388–2395, 2005 [DOI] [PMC free article] [PubMed] [Google Scholar]
- Yin L, Smith RG, Sterling P, Brainard DH. Chromatic properties of horizontal and ganglion cell responses follow a dual gradient in cone opsin expression. J Neurosci 26: 12351–12361, 2006 [DOI] [PMC free article] [PubMed] [Google Scholar]
- Zaghloul KA, Boahen K, Demb JB. Different circuits for ON and OFF retinal ganglion cells cause different contrast sensitivities. J Neurosci 23: 2645–2654, 2003 [DOI] [PMC free article] [PubMed] [Google Scholar]