Dear Editor,
Thanks for writing a nice editorial on the importance of sample size and calculation in medical research.[1] The principle of sample size calculation and formulas to determine adequate sample have been explained for testing the hypothesis for single mean, two means and two proportions.[2] The author has given the definition of important key terms used in the calculation of sample size but left out the distinction between one-tailed and two-tailed situations, which is an important issue: also, standardized difference (generally called effect size) compares two populations, and it is equal to the clinically important difference between the populations divided by the standard deviation (SD) of the population, assuming both the populations SD are equal. In addition, there are many lapses in formulas and their description given by the author.
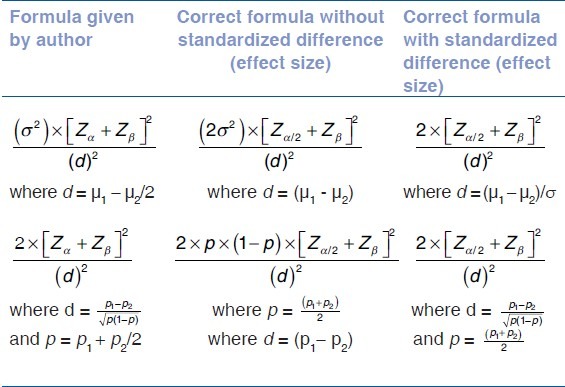
The author has used standardized difference in the solution of Problem B given in the article to calculate the sample size per group for comparing the two population means: however, formula given by the author did not include standardized difference. Correct formulas for comparing the two means assuming a two-tailed situation and similar variance in both populations or pooled variance and for comparing the two proportions are in Table 1.[3–4]
Table 1.
Corrected formulas with and without standardized difference

Note: α is the level of significance, β is probability of Type II error and (1-β) is power. For α = 0.05, Zα/2= 1.96, and Zα = 1.645. For β = 0.10, Zβ = 1.28; for β = 0.20, Zα/2 = 0.845
In problems B and C in the article, the author mentioned 90% power but in the description of data the author wrote “the probability of failing to reject a false null hypothesis (β)” as 0.80. It should be 0.10 not 0.80. Similarly, in Problem A, the author wrote 0.80 which should be 0.20. In the description of problems B and C, d is the size of the effect which is simply the difference between two population parameters while in the solutions the author considered d as standardized difference and the value of p1 + p2/2 is not same as 
This type of articles would certainly provide basic inputs to the researchers and the clinicians.[1–2,5]
Footnotes
Editor's Comments
The article by Gogates[2] was written with the purpose of initiating interest amongst the readers and was not exhaustive.
References
- 1.Nayak BK. Understanding the relevance of sample size calculation. Indian J Opthalmol. 2010;58:469–70. doi: 10.4103/0301-4738.71673. [DOI] [PMC free article] [PubMed] [Google Scholar]
- 2.Gogate N. Principles of sample size calculation. Indian J Opthalmol. 2010;58:517–8. doi: 10.4103/0301-4738.71692. [DOI] [PMC free article] [PubMed] [Google Scholar]
- 3.Indrayan A. Medical Biostatistics. 2nd ed. Boca Raton: Chapman and Hall/CRC Press; 2008. Confidence Interval, Principles of Tests of Significance, and Sample size; p. 389. [Google Scholar]
- 4.Whitley E, Ball J. Statistics review 4: Sample size calculations. Crit Care. 2002;6:335–41. doi: 10.1186/cc1521. [DOI] [PMC free article] [PubMed] [Google Scholar]
- 5.Malhotra RK, Indrayan A. Simple nomogram for estimating sample size for sensitivity and specificity of medical tests. Indian J Ophthalmol. 2010;58:519–22. doi: 10.4103/0301-4738.71699. [DOI] [PMC free article] [PubMed] [Google Scholar]


