

Abstract
Both abrupt and gradually imposed perturbations produce adaptive changes in motor output, but the neural basis of adaptation may be distinct. Here, we measured the state of the primary motor cortex (M1) and the corticospinal network during adaptation by measuring motor-evoked potentials (MEPs) before reach onset using transcranial magnetic stimulation of M1. Subjects reached in a force field in a schedule in which the field was introduced either abruptly or gradually over many trials. In both groups, by end of the training, muscles that countered the perturbation in a given direction increased their activity during the reach (labeled as the on direction for each muscle). In the abrupt group, in the period before the reach toward the on direction, MEPs in these muscles also increased, suggesting a direction-specific increase in the excitability of the corticospinal network. However, in the gradual group, these MEP changes were missing. After training, there was a period of washout. The MEPs did not return to baseline. Rather, in the abrupt group, off direction MEPs increased to match on direction MEPs. Therefore, we observed changes in corticospinal excitability in the abrupt but not gradual condition. Abrupt training includes the repetition of motor commands, and repetition may be the key factor that produces this plasticity. Furthermore, washout did not return MEPs to baseline, suggesting that washout engaged a new network that masked but did not erase the effects of previous adaptation. Abrupt but not gradual training appears to induce changes in M1 and/or corticospinal networks.
Keywords: motor cortex, adaptation, reaching, transcranial magnetic stimulation, plasticity
when one holds a novel object in hand, the unfamiliar dynamics of the object act as a perturbation on the reaching movement (Shadmehr and Mussa-Ivaldi 1994). This error induces adaptation so that on the next attempt, the motor commands are modified to partially compensate for the novel dynamics (Thoroughman and Shadmehr 1999, 2000). Cerebellar damage can profoundly impair this process of adaptation (Smith and Shadmehr 2005; Tseng et al. 2007). Yet, we recently observed that people with cerebellar damage maintained a latent ability to improve their motor commands when the perturbation was introduced gradually (Criscimagna-Hemminger et al. 2010; Izawa et al. 2012). Another recent report (Schlerf et al. 2012) found that adaptation in response to an abrupt (ABR) schedule of perturbation during reaching produced changes in cerebellar excitability, but these changes were not present when the perturbations were introduced gradually. Is the neural basis of adapting to a gradual (GRA) perturbation distinct from an ABR perturbation?
In the ABR schedule, the full strength of the perturbation is applied in a given trial and then maintained throughout training. This results in initially large trial-to-trial changes in motor commands that are then followed by a plateau phase in which motor commands tend to repeat. Repetition of motor commands can induce plasticity in the primary motor cortex (M1) (Classen et al. 1998), raising the possibility that adaptation to an ABR schedule of perturbations may involve M1. In contrast, in the GRA schedule, the perturbation is increased incrementally over many trials, enforcing a continuous change in motor commands throughout training. GRA perturbations preclude the opportunity for repetition. This suggests the possibility that adaptation to a GRA perturbation may include little or no involvement of M1. Indeed, there is some evidence to support this view. Recently, we used transcranial magnetic stimulation (TMS) to disrupt M1 during reach adaptation in force fields (Orban de Xivry et al. 2011a). We found that if the perturbation schedule was GRA, the disruption had no effect on performance (compared with a control group that did not receive TMS). If the perturbation schedule was ABR, the disruption also had no effect on the early trials, during which motor commands changed rapidly and performance improved by a large amount. However, in the ABR schedule, disruption of M1 impaired performance after these early trials, preventing the small increases in performance that normally occurred when motor commands tended to repeat. These results suggest that M1 may play a significant role in adapting to an ABR but not GRA schedule of perturbation.
Stimulation of M1 via a single pulse of TMS produces motor-evoked potentials (MEPs) in various muscles. The MEP is a rough proxy for the excitability of the corticospinal pathways. Here, we attempted to estimate changes in the state of M1 and corticospinal system during reach adaptation in GRA and ABR protocols by measuring MEPs before the onset of a reach. When the arm is perturbed during a reach by a force field, the brain learns to increase the activation of muscles that counter the perturbation (Thoroughman and Shadmehr 1999). It seems reasonable that as performance improves, MEPs for these perturbation-countering muscles, but not other muscles, should increase before the reach onset. Indeed, in the ABR protocol, we found that with training, MEPs increased in the perturbation-countering muscles. However, despite the fact that by the end of training the perturbation-countering muscles were similarly activated in the ABR and GRA schedules, in the GRA schedule we did not observe increases in MEPs in the perturbation-countering muscles.
METHODS
Subjects.
Fifty human subjects (20 men and 30 women), with no known neurological disease, naïve to the purpose of the experiment, participated after written informed consent was obtained. All subjects were screened for contraindication for TMS and neurological disorders. They were between 18 and 40 yr old (23.5 ± 5 yr, mean ± SD), right handed, and with normal or corrected-to-normal vision. The experimental protocol was approved by the Institutional Review Board of the Johns Hopkins School of Medicine.
Behavioral training.
Subjects performed a reaching task while holding the handle of a robotic arm with their right hand (Fig. 1A). On a given trial, the subject would reach to one of two directions: southeast (SE) or northwest (NW). For the SE target, there was a force field (counterclockwise velocity-dependent curl field, magnitude: 13 N·m·s−1) that pushed the hand in the NE direction and extended the elbow. We expected that for this target, adaptation would accompany an increase in the engagement of biceps (Thoroughman and Shadmehr 1999). For the NW target, the field pushed the hand in the SW direction and flexed the elbow and shoulder. We expected that for this target, adaptation would produce an increase in engagement of the triceps and deltoid muscles. For each muscle, the direction that adaptation required an increased engagement was labeled the “on direction,” whereas the opposite direction was labeled the “off direction” (see Table 1).
Fig. 1.

Experimental methods. A: subjects held the handle of a robotic arm. The device and the arm of the subject were located below an opaque screen on which a cursor representing hand position and the targets were projected. The starting point for each trial was located at the center of an imaginary circle. On a given trial, a target would appear either at 135° [northwest (NW)] or 315° [southeast (SE)]. The perturbation consisted of a counterclockwise curl force field. B: a reach target appeared at 10 cm, and the subject then heard three 100-ms duration auditory tones in sequence. The task was to start the reach 100 ms after the third tone. The third tone coincided with a change in the color of the target, which served as a go cue. Subjects were instructed to shoot through the target as accurately as possible and within a 160- to 220-ms time window after reach start. In 40% of the trials, transcranial magnetic stimulation (TMS) was delivered at the appearance of the go cue. C: subjects performed 7 blocks of 65 trials. From block b2 until the end of the experiment, TMS was delivered over the left primary motor cortex (M1) on 45% of the trials. In the abrupt (ABR) condition, the force field perturbed the movements from trials 156 to 395. In the gradual (GRA) condition, the strength of the force field was ramped up linearly from trials 156 to 340 and was then maintained until trial 395.
Table 1.
Summary of on and off directions for each muscles and how the MEP index was computed for each muscle
| Muscle | On Direction | Off Direction | MEP Index |
|---|---|---|---|
| Biceps | SE | NW | [Median(MEPbicepsSE) − Median(MEPbicepsNW)]/[Median(MEPbicepsSE) + Median(MEPbicepsNW)] |
| Triceps | NW | SE | [Median(MEPtricepsNW) − Median(MEPtricepsSE)]/[Median(MEPtricepsNW) + Median(MEPtricepsSE)] |
| Deltoid | NW | SE | [Median(MEPdeltoidNW) − Median(MEPdeltoidSE)]/[Median(MEPdeltoidNW + Median(MEPdeltoidSE)] |
MEP, muscle-evoked potential; SE, southeast; NW, northwest.
The force field was introduced either abruptly or gradually. We expected the muscle activation patterns at the end of training to be similar in the ABR and GRA groups. However, our question was whether the state of M1, as measured by TMS-evoked MEPs, would be comparable in the two groups.
The arm configuration was similar to the configuration shown in Fig. 1A with the starting hand position ∼45 cm in front and 4 cm to the right of the subject midline. Movements were constrained to the horizontal plane. The hand was covered by an opaque screen onto which targets were projected. A white cursor (5 × 5 mm) represented the hand position in real time and provided online visual feedback of the hand position. At the start of each trial, the robot placed the hand at the start position. A red target (7 × 7 mm) appeared at a distance of 10 cm randomly at one of two possible directions: 135° (NW) or 315° (SE). However, the subjects could not start their reach until completion of a delay period during which they heard three beeps (at 330, 660, and 990 ms with respect to the onset of the delay period). At the conclusion of this delay period, the target changed its color from red to white, serving as the “go” signal (Fig. 1B). The target remained on the screen until the end of the trial. We detected the onset of reach as the time when the hand crossed the boundary of the cross that marked the start area together with a velocity threshold of 1.5 cm/s. If the reach started before the go cue, the robot pushed the hand back to the start position, and the trial was restarted (∼2.5% of trials). Using feedback (as described below), the subjects were trained to start their reach at +100 ms after the go cue, pass through the target within 160–220 ms after reach start, and stop their movement beyond the target (i.e., “shoot through the target”). Once they had stopped their reach, they brought their hand back to the target to receive visual and auditory feedback about their performance.
A low tone indicated that the movement speed was too slow. A red target indicated that the reach missed the target. Reaction time with respect to the go cue was displayed in seconds. Movement end was labeled as the time at which the distance between the hand cursor and the starting position was 10 cm. If movement duration and accuracy were in the right range, the target “exploded” when the subject aligned their hand with it. A larger explosion was associated with more accurate movements. Successful trials were awarded between 1 and 4 points depending on the accuracy (see Huang and Shadmehr 2009 for details). The total points collected during the set was displayed and updated after each trial. Subjects were instructed to maximize the number of points for each set.
The experiment consisted of sets of 65 trials each. From trial 156 to trial 395, a counterclockwise velocity-dependent force field (magnitude: 13 N·m·s−1) perturbed the reach (Fig. 1C). During each set, error-clamp trials were randomly interleaved with 1/5 probability. During an error-clamp trial, the hand trajectory was constrained to a straight line by a stiff virtual wall (spring coefficient of 2,500 N/m, damping coefficient of 25 N·s·m−1). This allowed us to measure the force that the subjects planned to exert against the robot on that particular trial.
Position, velocity, and force at the handle of the robotic arm were sampled at 100 Hz. Electromyographic (EMG) signals were sampled at 5,000 Hz from the first dorsal interosseus, biceps brachii, triceps brachii, and lateral deltoid muscles using active surface electrodes (Delsys, Boston, MA).
Groups.
Subjects were randomly assigned to one of three groups. For the ABR group (n = 20), the curl force field was introduced abruptly and maintained for 239 trials (Fig. 1C). For the GRA group (n = 20), the strength of the field was ramped linearly over 184 trials and then held at maximum strength for another 55 trials. The experiment concluded with an additional 60 trials with no perturbation. Subjects in the GRA group completed an extra block without perturbations. Subjects in the null group (n = 10) completed 7 sets of 65 trials with no perturbation.
TMS protocol.
From trial 66 to the end of the experiment, subjects received a TMS pulse at the time of the go cue in ∼45% of the trials. The TMS pulses were delivered using a Magstim 200 stimulator with a 70-mm figure-of-eight coil (Magstim). The coil was held over the left M1 tangential to the scalp. Coil positioning was monitored online by the Brainsight system (Rogue Research, Montreal, Quebec, Canada). The handle pointed backward with an angle of 45° with respect to the anterior-posterior axis.
Before each experiment, the site of M1 stimulation was determined. The ideal site would yield MEPs of similar amplitudes in the three arm muscles (biceps brachii, triceps brachii, and lateral deltoid muscles). However, these three muscles have different resting/active motor thresholds and different input-output curves. Therefore, it was not possible to obtain MEPs of similar amplitudes across muscles or to determine a single motor threshold. In addition, for some subjects, the size of the MEPs at baseline depended on the direction of the upcoming reach. Therefore, the biceps hotspot was first determined at rest. The intensity of the stimulation was determined during an isometric force task, during which the subjects maintained their hand at the starting position while the robot pushed toward NE with a 2-N force, imposing an extension force on the elbow. If the MEPs elicited by the stimulation were not clearly visible in all monitored muscles, the second set was interrupted. The intensity of the stimulation was then increased by 5% of the stimulator output, and the set was restarted. TMS intensities and the resulting MEP sizes during baseline (block b0: trials 66 to trials 155) are shown in Table 2.
Table 2.
Average TMS intensities and resulting MEP size in the biceps, triceps, and deltoid muscles during baseline
| MEP Size, mV |
||||
|---|---|---|---|---|
| Group | TMS Intensity, %maximum stimulator ouput | Biceps | Triceps | Deltoid |
| ABR | 53.4 ± 1.96 | 0.19 ± 0.04 | 0.12 ± 0.02 | 0.19 ± 0.03 |
| GRA | 52.2 ± 1.5 | 0.22 ± 0.03 | 0.1 ± 0.01 | 0.25 ± 0.04 |
| Null | 56 ± 2.58 | 0.12 ± 0.03 | 0.11 ± 0.02 | 0.22 ± 0.04 |
Values are means ± SE; n = 20 muscles in the abrupt (ABR) group, 20 muscles in the gradual (GRA) group, and 10 muscles in the null group. TMS, transcranial magnetic stimulation.
Kinematic data analysis.
End-point error was computed as the angle between the hand and the target at movement end (i.e., when the distance between the hand and the starting point was larger than 10 cm). During error-clamp trials, we measured the maximum force exerted by the subject. Reaction time corresponded to the time between go cue appearance and movement start. Perpendicular velocity profiles were quantified by computing the average velocity perpendicular to the direction of target during the first and second half of the movement (midpoint is 5 cm). Trials in which subjects initiated their movement in the wrong direction were discarded (±45° off target). The trial rejection rate was 1.5%, 0.5%, and 0.8% for ABR, GRA, and null groups.
To compute the time constant of the decay during the washout block, we fitted an exponential or a linear function to the maximum perpendicular force measured during error-clamp trials between trials 396 and 455 using the lsqnonlin function of Matlab.
EMG data analysis.
To compute EMG associated with the movement, EMG signals were band-passed filtered (20–500 Hz) and then rectified. The EMG envelope was obtained by low-pass filtering [cutoff: 20 Hz (Kamen and Gabriel 2010)].
MEPs typically occurred from 10 to 40 ms after the TMS pulse. MEP amplitude was measured as the difference between the maximum and minimum of the raw EMG signal over the time interval 10–40 ms after the pulse. The same EMG values were computed in the no-TMS trials for comparisons (no-pulse EMG). MEPs obtained from movements with a reaction time smaller than 50 ms were discarded (∼15% of the trials).
To track changes in MEPs during training, we wanted an index that was not biased by general increases in cortical excitability and robust to outliers. To reject the possible influence of nonspecific changes in the excitability of the cortex, we normalized the difference between the median MEPs of both directions of movements by their sum (Eq. 1). To make our measure robust to outliers, we used the median rather than the mean. For a given muscle, for a given block of trials, the MEP index was computed as follows:
| (1) |
In Eq. 1, MEPmuscleonrepresents the set of MEPs recorded in one muscle for the on direction target during a given block and MEPmuscleoff represents the set of MEPs recorded in the same muscle in the opposite direction (see Table 1). Following this definition, the MEP index for a muscle should increase over the course of training if the relative balance between MEPs in the on and off directions shifts in favor of the on direction. Normalized MEPs and EMG, for example, as shown in Figs. 5 and 6, were obtained by the intersubject mean of the intrasubject median of each parameter.
Fig. 5.

Change in MEP during training. A: changes in MEPs of each muscle (with respect to block b0) in the on and off directions. Data represent intersubject averages ± SE for each group (●, ABR group; ○, GRA group). B: changes in MEPs in the on and off directions, pooled across muscles, and plotted over the course of training. Error bars are SEs. C: for each muscle of each subject, MEPs in the on and off directions were combined to form an MEP index (Eq. 1). Next, for each subject, a mean MEP index was computed (Eq. 2) for each block. This plot shows the change in this measure with respect to block b0. Intersubject means ± SE are plotted.
Fig. 6.

Changes in EMGs with respect to block b0 (solid circles, ABR group; open circles, GRA group; shaded circles, null group) in various periods before, during, and after the TMS pulse. The prepulse period was 40–10ms before the TMS pulse, the per-pulse period was the period during which a TMS pulse would be given (but was not), and the postpulse period was from movement onset to movement end. For each muscle of each subject, the root mean square of the raw EMG signal in the on and off directions at each period was computed. Next, for each muscle of each subject, an EMG index was computed (Eq. 1). Finally, for each subject, a mean EMG index was computed (Eq. 2). This plot shows the change in this measure with respect to block b0 (means ± SE).
Confounding variables.
The MEP that results from a single pulse of TMS is affected by the state of the activation of the target muscle. Therefore, we quantified the state of the muscles at three intervals: 1) immediately before the TMS pulse (TMS trials), 2) during the time when a pulse would normally be given, and 3) during the movement that followed the pulse. Our proxy for the state of the muscles immediately before the TMS pulse was a prepulse EMG, quantified as the root mean square of the raw EMG signal from 40 to 10 ms before the TMS pulse. Our proxy for the state of the muscles during the period when TMS would be given was EMG activity in no-TMS trials during the same period in which MEPs would have been measured via a root mean squared variable (per-pulse EMG). Finally, our proxy for the state of the muscles after the pulse was a movement-related EMG, which was obtained by integrating the EMG envelope from the movement onset to the movement end (postpulse EMG). Using Eq. 1, we computed an index for prepulse, per-pulse, and postpulse EMG activity. We used these muscle states as potential confounding variables in our statistical analysis, as outlined in Statistical analysis.
Statistical analysis.
We focused on three blocks during the training process: baseline, as represented by block b0 (trials 66–155; Fig. 2A), end of training, as represented by block b4 (trials 326–395; Fig. 2A), and washout in block b5 (trials 420–455; Fig. 7A). Other experimental blocks during training were also used: block b1 (trials 156–195), block b2 (trials 196–260), block b3 (trials 261–325), and, for the GRA group only, block b6 (trials 456–520).
Fig. 2.

Behavioral results for the ABR and GRA groups. A: end-point error, plotted as the angular distance to the target, as the hand crossed an imaginary 10-cm circle. The dotted vertical lines indicate set breaks, and the dashed vertical line indicates the start of the force field perturbation block. B: maximum force measured during error-clamp trials. C: reaction time with respect to the go cue. In A–C, the curves represent the running average over a window of 10 trials, which were interrupted during set breaks. D: velocity perpendicular to the direction of the target, computed during blocks b0 and b4 (baseline and end of adaptation, as denoted in A). E: force produced in error-clamp trials, computed during blocks b0 and b4. F: running SD of the peak force (from B) obtained as in Orban de Xivry et al. (2011a). Error bars are SEs.
Fig. 7.
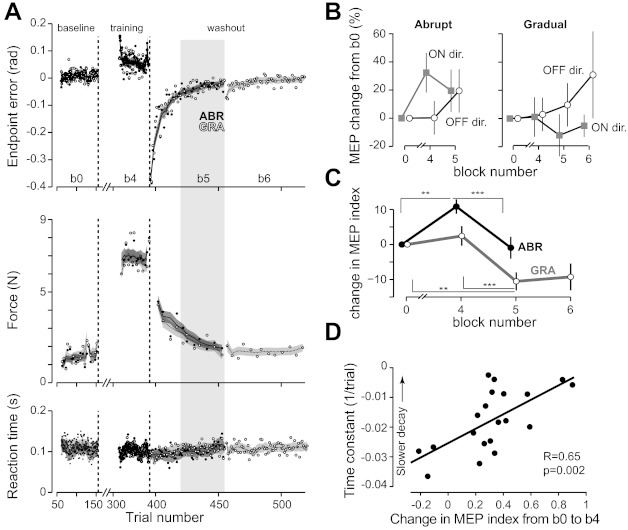
Analysis of the washout period. A: evolution of the end-point error, maximum perpendicular force, and reaction time during baseline (block b0), end of training (block b4), and washout (blocks b5 and b6). The solid trace and solid circles are for the ABR group, and the dashed trace and open circles are for the GRA group. End-point error was measured in field trials, force was measured in error-clamp trials, and reaction time was measured in all trials. Data for block b6 were obtained for the GRA group only. Lines show the running average over a window of 10 trials. B: changes in MEPs (relative to block b0) in the on and off directions, pooled across muscles, and plotted in various blocks. C: change in the MEP index (relative to block b0) for training and washout blocks for the ABR and GRA conditions. **P < 0.01; ***P < 0.001. D: intersubject correlation between the mean of the MEP index (change between blocks b0 and b4) and the time constant of decay in the perpendicular force measured during error-clamp trials (data from A, middle, block b5). Data from the ABR group (n = 20) are shown.
The various measures were submitted to repeated-measures ANOVA with muscles and blocks as within-subject factors. To compare the evolution of MEPs across groups, this factor was added as a between-subject factor. For each subject, we used the marginal mean to quantify how the state of all the muscles had changed with respect to baseline. For example, to quantify how the MEPs in block b4 had changed with respect to baseline in the ABR group, we computed the following marginal mean of the MEP index (MMx):
| (2) |
In the above expression, x is the MEP index. The subscripts refer to the three muscles: biceps (bic), triceps (tri), and deltoid (del). The superscripts b0 and b4 refer to blocks b0 and b4 (baseline and end of training blocks). Using a similar procedure, we computed the marginal mean for the prepulse EMG index, per-pulse EMG index, and postpulse EMG index.
Because the state of the muscles can influence MEPs, we used the state of the muscles as a confounding factor in analysis of covariance (ANCOVA). In this ANCOVA, the marginal mean of the MEP index was the dependent factor, training protocol (ABR or GRA) was the categorical predictor, and the marginal mean of either the prepulse EMG, no-pulse EMG, or movement-related EMG was a continuous predictor. All analyses were implemented in Statistica (Statsoft, Tulsa, OK).
As stated above, ANCOVA was used to test the influence of prepulse EMG activity on the evolution of MEPs across groups. Other studies have normalized MEPs by prepulse EMG activity to negate the prepulse EMG effect on the MEP amplitude (Lemon et al. 1995; MacKinnon and Rothwell 2000). However, in our study, the relationship between prepulse EMG and MEPs was weak (R2 ≈ 0.1). The efficiency of a normalization procedure can be assessed by a decrease in the coefficient of variation of the normalized variable with respect to the non-normalized version of that variable [SD/mean (Yang and Winter 1984; Allison et al. 1993; Burden and Bartlett 1999)]. In our study, the division of the EMG amplitude by the prepulse EMG activity actually increased the intraindividual coefficient of variation [t(39) = 7.37, P < 0.0001]. Therefore, this normalization procedure was ill suited for our data set.
RESULTS
We considered a standard reach adaptation task in a curl force field. Subjects made “shooting” movements toward one of two targets (NW or SE; Fig. 1A). We used TMS of M1 to measure the excitability of the corticospinal network just before start of the reach. To control the timing of TMS with respect to the movement onset, subjects listened to a sequence of beeps and started their reach around 100 ms after the third beep (Fig. 1B).
We considered two perturbation schedules: ABR and GRA, as shown in Fig. 1C. In the ABR group, the introduction of the perturbation (block b1) yielded a large increase in end-point errors (Fig. 2A) that was reduced rapidly and then maintained at near baseline levels over the course of the experiment. In contrast, in the GRA group, as the strength of the perturbation increased, the end-point errors remained near baseline throughout the training. By the beginning of the fourth perturbation block (block b4), the strengths of the perturbations in the ABR and GRA group were identical. During block b4, end-point errors were similar in these two groups [t(38) = −0.036, P = 0.72], as were the forces that the subjects produced in error-clamp trials [t(38) = 0.22, P = 0.85; Fig. 2, B and E]. Other performance measures were also similar in block b4: perpendicular velocities [mean perpendicular velocity during the first and second half of the movement: t(38) = 0.31, P = 0.75, and t(38) = −0.55, P = 0.58; Fig. 2D] and reactions times (Fig. 2C). For example, in block b4, average reaction time was 124 ms for the ABR group and 118 ms for the GRA group [t(38) = 0.75, P = 0.45]. Therefore, by the end of training, both the ABR and GRA groups had altered their motor commands to compensate for the perturbation.
Despite the similarity in performance at the final training block, if we used force as a proxy for motor output, the GRA group experienced a significantly smaller amount of repetition of motor commands compared with the ABR group. In the ABR condition, after an initial transition, the trial-to-trial force variability was low, whereas this variability stayed high in the GRA condition (Fig. 2F) because the perturbation continued to change. As a consequence, variance of force over training blocks b1–b4 was significantly smaller in the ABR group compared with the GRA group [t(38) = 5.2, P = 0.00001].
Corticospinal excitability during adaptation.
On a given trial, the subject would reach to one of two directions: SE or NW. For the SE direction, the field extended the elbow, whereas for the NW direction the field flexed the elbow and shoulder (Fig. 1A). As a consequence, with training, we observed that during the reach, there was an increase in the engagement of the biceps for SE and an increase in the engagement of the triceps and deltoid for NW. That is, the biceps was the perturbation-countering muscle for SE, whereas the triceps and deltoid were the perturbation-countering muscles for NW. We label SE as the on direction for the biceps and NW as the on direction for the triceps and deltoid.
The EMGs for these muscles during blocks b0 and b4 are plotted in their on direction in Fig. 3A and in their off direction in Fig. 3B. In the on direction, activity increased from block b0 to b4, whereas in the off direction, activity had either not changed or decreased from block b0 to b4. Importantly, this pattern was present regardless of whether the perturbation schedule was ABR or GRA: by block b4, subjects from each group had increased the activity of the biceps as they reached toward SE [interaction between direction and period (block b0 vs. b4): P = 0.002 in the ABR group and P = 0.002 in the GRA group] and increased the activity of the triceps (P = 0.0001 in the ABR group and P < 0.0001 in the GRA group) and deltoid (P = 0.006 in the ABR group and P = 0.003 in the GRA group) as they reached toward NW.
Fig. 3.

Electromyographs (EMGs) at baseline (block b0) and final training (block b4). A: EMG for each muscle in the on direction for subjects in the ABR and GRA groups. Traces were aligned to the go cue (time 0). Shaded areas around the traces represent SEs. The gray vertical bar represents the time of the TMS pulse. B: same as in A but for the off direction of movements.
To measure the state of the corticospinal network, we applied a TMS pulse to the arm area of M1 at 100 ms before the go cue. The resulting MEPs from the three muscles of two representative subjects are plotted in Fig. 4. For the subject from the ABR group (Fig. 4, A and B), biceps MEPs had increased from block b0 to b4 before the reach in the on direction (Fig. 4A, top) but not before the reach in the off direction (Fig. 4B, top). For the subject in the GRA group, biceps MEPs did not show an increase in any direction. For the subject in the ABR group, triceps MEPs showed an increase from block b0 to b4 in the on direction (Fig. 4A, middle) but not in the off direction (Fig. 4B, middle). For the subject in the GRA group, triceps MEPs did not show an increase in any direction. Finally, for the subject in the ABR group, deltoid MEPs showed an increase from block b0 to b4 in the on direction (Fig. 4A, bottom) but not the off-direction (Fig. 4B, bottom). For the subject in the GRA group, deltoid MEPs did not show an increase in any direction.
Fig. 4.
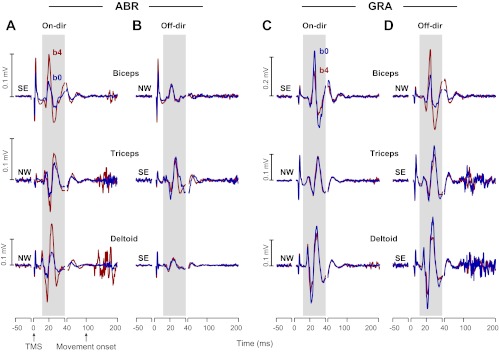
Motor-evoked potential (MEP) traces for three muscles of two representative subjects during baseline (block b0) and final training (block b4). Each trace is the median of the MEP traces obtained in each block. Top: biceps muscle; middle: triceps muscle; bottom: deltoid. A and B: data for the subject in the ABR group; C and D: data for the subject in the GRA group. For A–D, three different periods are presented: 1) from 50 ms before to the time of the TMS pulse, 2) from the TMS pulse to 40 ms later, and 3) from 40 to 200 ms after the TMS pulse. The MEPs are visible during the second time interval. The shaded area represents the time interval during which the minimum and maximum of the EMG were measured to determine MEP amplitudes. The on direction refers to the direction for which a muscle countered a perturbation.
A summary of MEP changes in all subjects during training is shown in Fig. 5. For the biceps in the on direction, MEPs in the ABR group showed an increase in the first block of training (block b1), and this increase was maintained until the final block of training (main effect of block: P = 0.011, block b4 vs. b0). However, in the GRA group, MEPs in the biceps showed little or no change during the training blocks, including block b4, during which the perturbation was equal to the ABR group (P = 0.92). For the triceps and deltoid muscles, on direction MEPs displayed increases in the ABR group (main effect of block: P = 0.042, block b4 vs. b0) but not in the GRA group (main effect of block: P = 0.65). Off direction MEPs appeared to change similarly in the ABR and GRA groups.
One way to compare MEPs during training is to pool the responses in various muscles in their on direction and compare them with their response in the off direction. This is shown in Fig. 5B. In the ABR group, on direction MEPs increased in block b1 but also showed an increase in the off direction. This suggests that at least some of the changes early in training were due to an increase in general corticospinal excitability. With training, the on direction increases were sustained, but the off direction changes returned to baseline. In contrast, in the GRA group, on and off direction MEPs remained at baseline throughout training. These observations were quantified by a significant direction (on vs. off) by group interaction at block b4 [F(1,38) = 9.45, P = 0.004, power: 0.86], suggesting that in the ABR group, TMS produced a larger increase in MEP in the on direction than in the off direction but not in the GRA group. Importantly, the ABR and GRA groups could only be compared in blocks b0 and b4, periods during which movement kinematics and performance were similar across groups and the perturbation level was matched (Fig. 2).
To statistically compare MEPs in the ABR and GRA groups, we devised an MEP index that took into account for each muscle the MEPs in the on and off directions (Eq. 1). An increase in MEP index corresponds to a change in the on direction relative to the off direction. Therefore, the MEP index would not change if MEPs increased or decreased similarly in both directions. We then averaged this index across the three muscles to form an MEP index for each subject at each block of training. The results are shown in Fig. 5C. Statistically, we compared the values of this index in blocks b0 and b4 because only in these two blocks were movement kinematics of the ABR and GRA groups matched. As suspected, the MEP index evolved differently in the ABR and GRA groups [interaction between groups and blocks: F(1,38) = 5.32, P = 0.027, power: 0.61]. We found that the MEP index increased from blocks b0 to b4 in the ABR group (P = 0.0007 by Tukey's post hoc test) but not in the GRA group (P = 0.7). In the ABR group, the change in the MEP index occurred early in training as the MEP index became larger than baseline from block b2 onward (main effect of block: P = 0.0029, power: 0.93; Dunnett's test: P = 0.22 in the first block, P = 0.005 in the second block, P = 0.032 in the third block, P = 0.001 at the end of learning). In addition, the MEP index increased further from blocks b1 to b4 (P = 0.02). In contrast, in the GRA group, the MEP index stayed near baseline throughout training [change between blocks b0 and b4: F(1,19) = 0.75, P = 0.4; across all blocks: F(4,76) = 1.56, P = 0.2].
Our control group trained only in the null field. In this group (Fig. 5C), we found no systematic change in the MEP index over the course of the experiment [change between blocks b0 and b4: F(1,9) = 0.17, P = 0.69; across all blocks: F(4,36) = 0.33, P = 0.85]. The evolution of the MEP index in the null group from blocks b0 to b4 significantly differed from the pattern observed in the ABR group [interaction between block and group: F(1,28) = 11.3, P = 0.002] but not from the GRA group [F(1,28) = 0.72, P = 0.4].
In summary, in the final block of training (block b4), movement kinematics appeared similar in the ABR and GRA groups. In both groups, the brain learned to change the activation of a specific set of muscles, countering the perturbation force for each direction of movement. Yet, increases in corticospinal excitability, as measured via MEPs near the reach onset, was present in the ABR group only.
Confounding variables.
It is possible that the differences that we observed in the GRA and ABR groups were due to subtle differences in the activation state of the muscles near the movement onset. We therefore quantified muscle activation states at various time points before and during the reach: before the TMS pulse (prepulse period, 40–10 ms before the TMS pulse), during the period of the TMS pulse (in no-TMS trials, labeled as per-pulse, the period from 10 to 40 ms), and after the TMS pulse (postpulse, from movement onset to movement end). We then used the states of the muscles as covariates in the analysis that compared MEP changes between blocks b0 and b4 in the two groups.
To assess the state of the muscles immediately before the TMS pulse, we measured EMG during the period from 40–10 ms before the TMS pulse. The muscle state immediately before the pulse can influence the size of the MEP: the larger the prepulse activity in a given muscle, the larger the MEP response from M1 (Hess et al. 1986; Lavoie et al. 1995). In our study, the prepulse EMG index increased from block b0 to b4 [block b0 vs. b4: F(1,38) = 5.58, P = 0.023], as shown in Fig. 6. However, unlike the MEP index, this increase did not differ in the ABR and GRA groups [interaction between block and group: F(1,38) = 0.12, P = 0.73]. Importantly, when the prepulse EMG index was considered as a covariate, the change in the MEP index from block b0 to b4 remained significantly different in the ABR and GRA groups [ANCOVA: F(1,37) = 5.84, P = 0.021]. Therefore, the difference in the MEP index between the ABR and GRA groups could not be explained by the state of the muscles in the period immediately before the TMS pulse.
Next, we considered the state of the muscles during the period of the TMS pulse. In the no-TMS trials, we computed EMG activity during the same period in which MEPs would have been measured (10 to 40 ms). We found that the EMG change in the GRA and ABR groups was comparable at block b4 [F(1,38) = 1.72, P = 0.2], as shown in Fig. 6 (plot labeled per-pulse EMG). Importantly, when per-pulse EMG activity in the no-TMS trials was considered as a covariate, the change in the MEP index from block b0 to b4 in the ABR and GRA groups remained significantly different [ANCOVA: F(1,37) = 10.7, P = 0.002].
Finally, we considered the state of the muscles in the postpulse period (from movement onset to movement end in TMS trials). We found no correlation between the change in the postpulse EMG index and the change in the MEP index (ABR: r = −0.11, P = 0.63; GRA: r = −0.04, P = 0.87). We found that the postpulse EMG index increased from block b0 to b4 [F(1,38) = 108.3, P < 0.00001, block b0 vs. b4; Fig. 6], but this increase was similar in the GRA and ABR groups [interaction between group and block: F(1.38) = 0.14, P = 0.7]. When the postpulse EMG index was considered as a covariate, the change in the MEP index from block b0 to b4 in the ABR and GRA groups remained significant [ANCOVA: F(1,37) = 5.14, P = 0.029].
In addition, we correlated changes in the MEP index for each muscle separately with the median MEP size during baseline. For each muscle separately, the baseline size of MEPs did not correlate with changes in MEPs during learning (maximum correlation: r = 0.07 for the ABR group, r = 0.15 for the GRA group, and r = 0.022 pooled across all groups).
In summary, the activities in the muscles at periods immediately before, during, or after the TMS pulse were generally comparable in the GRA and ABR groups in block b4. When controlling for these variables, changes in corticospinal excitability that coincided with the training remained significantly different in the GRA and ABR groups.
Washout.
The training ended with washout trials (null field). The ABR group experienced one block of washout, and the GRA group experienced two blocks. The onset of washout was abrupt, resulting in sudden changes in performance in both GRA and ABR groups (Fig. 7A). During washout, the forces that subjects produced returned toward baseline measures. Performance, as quantified with end-point errors, forces, and reaction times, again appeared similar in these two groups.
We focused our analysis on the variables that we recorded in the late stage of the first washout block (labeled as block b5 in Fig. 7A). In the ABR group, during training, MEPs in the on direction had increased (block b4; Fig. 7B). During washout, these on direction MEPs now decreased toward baseline. However, the decrease of on direction MEPs was accompanied by an increase in off direction MEPs. We found an interaction between movement direction and blocks b4 and b5 [F(1,19) = 18.57, P = 0.0004]. We found an increase in MEPs for the off direction (P = 0.008) and similar MEPs in the on and off directions in block b5 (P = 0.99).
In the GRA group, by end of training in block b4, on and off direction MEPs were unchanged from block b0. In block b5, on direction MEPs decreased, whereas off direction MEPs increased [interaction between movement direction and blocks b4 and b5: F(1,19) = 6.12, P = 0.023]. The pattern of MEP changes from block b4 to b5 for the GRA group during washout was similar to the ABR group. Namely, in both groups, MEPs increased in the off direction and decreased in the on direction.
We summarized on- and off-direction MEPs via an MEP index (Fig. 7C). ANOVA of the MEP index revealed an interaction between group and block [F(2,38) = 3.55, P = 0.034]. For the ABR group, the MEP index at the end of learning (block b4) was larger than the index at baseline (post hoc Tukey test: P = 0.002) and also larger than washout (block b5, P = 0.0005). The MEP index at block b5 was not different than at block b0 because normalized MEP amplitudes in the on and off directions were both higher than baseline (P = 0.04) and this increase was similar at block b5 (Fig. 7A). However, for the GRA group, the MEP index was significantly smaller at the end of the washout period than during baseline or during the end of learning (post-hoc Tukey test: P = 0.003 and P = 0.0002, respectively). In the final washout block (block b6), the MEP index for the GRA group remained significantly different than baseline [main effect of blocks: F(2,38) = 7.45, P = 0.002 for blocks b0, b4, and b6; P = 0.017, block b6 vs. b0; and P = 0.002, block b6 vs. b4].
During the washout block, the forces that subjects produced returned toward baseline (Fig. 7A). However, some subjects exhibited a slower decay rate than others. We found that subjects in the ABR group that showed the slowest decay tended to be those that had the largest changes in the MEP index during adaptation. The rate of decay in the washout trials was quantified for each subject by fitting an exponential function to the maximum force recorded during the series of error-clamp trials interspersed after the sudden removal of the force field. In the ABR group, we found that the negative time constant of the exponential was positively correlated with the change in MEP index (R = 0.65, P = 0.002; Fig. 7D). Those correlations were not present in the GRA group (exponential fit: r = 0.34, P = 0.14). In contrast, neither the change in the postpulse EMG index nor prepulse EMG index correlated with the rate of forgetting (R = −0.27, P = 0.28, and R = −0.14, P = 0.57, respectively). In summary, the more the MEP index had changed in the ABR group during training, the slower the decay of motor output in the washout period.
DISCUSSION
We monitored changes in corticospinal excitability as people trained in a reaching task in which the perturbation schedule was either ABR or GRA. Our subjects reached to one of two directions and adapted their motor output to compensate for a force field. For one direction of movement (SE), training produced increased activity during the reach in biceps (labeled as the on direction for the biceps), whereas for the other direction (NW), training produced increased activity in the triceps and deltoid muscles (labeled as the on direction for the triceps and deltoids). We applied a single pulse of TMS to M1 near movement onset and measured the resulting MEPs in these muscles. As training proceeded, on direction MEPs increased in the ABR group but remained near baseline in the GRA group. As training concluded, perturbation magnitudes were identical in the two groups, resulting in similar performances, yet on direction MEPs for the GRA group continued to remain near baseline. We combined MEPs for the on and off directions and formed an MEP index (Eq. 1). Whereas adaptation in the ABR group produced an increase in the MEP index (Fig. 5C), there was little or no change in this measure for the GRA group. Therefore, MEP changes during training were not simply a reflection of motor output. Rather, for the ABR group, training produced increases in corticospinal excitability before reach onset in the specific network that engaged the muscles that countered the perturbation in the upcoming movement. However, in the GRA group, despite comparable changes in motor output during the reach, the changes in corticospinal excitability were absent.
After the conclusion of training, the perturbation was suddenly removed, resulting in a washout of behavioral measures. In the ABR group, MEPs did not return to baseline. Rather, the on direction MEPs that had increased during training declined toward baseline, whereas the off direction MEPs that were at baseline increased. Therefore, the equilibrium between MEPs in the on and off directions was restored (Fig. 7C), but MEPs were not at baseline (Fig. 7B). In the GRA group, the sudden introduction of washout also produced significant changes in MEPs, resulting in on direction decreases and off direction increases, similar to the ABR group. This pattern persisted despite the fact that performance had returned to baseline. Therefore, washout did not return the state of corticospinal networks to baseline but rather engaged a new network that partially compensated for the earlier changes that were produced during training. That is, washout appeared to be a form of new learning in which the effects of previous training were masked but not erased (Pekny et al. 2011).
The site of plasticity is likely located in cortical motor areas.
Changes in MEPs may be due to changes in cortical motor areas and/or the spinal cord. It is hard to estimate the contribution of each to changes in MEP size (Burke and Pierrot-Deseilligny 2010). A recent study (Ahmadi-Pajouh et al. 2012) that monitored changes in reflexes during force field adaptation demonstrated that spinal short-latency reflexes were not modulated by force field adaptation, whereas cortical long-latency reflexes were. This absence of spinal cord plasticity during force field adaptation is reinforced by the observations that spinal cord plasticity in rats or primates is very slow (Wolpaw and O'Keefe 1984; Chen and Wolpaw 1995; Thompson et al. 2009), whereas changes in M1 plasticity can occur with only tens of training trials (Xu et al. 2009). In addition, spinal cord plasticity is usually preceded and driven by cortical plasticity (Wolpaw 2007). We speculate that spinal cord plasticity played little or no role in the changes in MEPs observed in our study.
MEPs likely represent a measure of excitability of a network of neurons in M1, supplementary motor area, and ventral and dorsal premotor cortex in response to an external input. An increase in the MEP in a muscle may indicate that a subset of cortical neurons that that activate a network that controls a muscle have become more easily excitable. How do changes that we observed in MEPs compare with changes in activities of cortical cells during reach adaptation?
Whereas GRA training has not been studied using neurophysiological techniques, there are extensive data regarding effects of ABR training in monkey premotor and motor cortices. Arce et al. (2010b) observed that when a monkey reached to a target, adaptation to a force field resulted in increased activity of cells that had their preferred direction (PD) 180° with respect to the direction of the force field and, therefore, 90° with respect to the target. For example, if the reach was toward the SE target in a counterclockwise field, M1 and premotor cortex cells with PDs toward the elbow flexion increased their firing in the delay period as well as during the movement. Similar observations have been reported in other studies for the same motor areas and for the supplementary motor area (Gandolfo et al. 2000; Li et al. 2001; Padoa-Schioppa et al. 2004; Xiao et al. 2006). These findings parallel our observation that in the ABR schedule, on direction MEPs and the MEP index increased during training.
In the washout block, we observed changes in MEPs that also parallel changes that have been reported in M1 of monkeys. Li et al. (2001) found that during adaptation, PDs of some cells rotated in the direction of the field. In the washout period, some of these cells maintained the change in their PDs, whereas other cells that had not changed their PDs during adaptation rotated their PDs opposite to the direction of the field. Arce et al. (2010a) and Mandelblat-Cerf et al. (2011) found that in the washout period, cells that had changed their activity during adaptation often did not return their activity to baseline levels. We observed that in the ABR group, on direction MEPs increased during adaptation but were not restored to baseline during washout. Rather, during washout, off direction MEPs increased and matched the changes in on direction MEPs. This is, washout did not remove the effects of adaptation on MEPs but rather brought about new changes that masked them.
The similarities between neurophysiological recordings in motor cortical areas and our results suggest that the observed changes in MEPs are driven by one or several nodes of this network. It seems likely that M1 is one of them. Indeed, anatomically, M1 has a large influence on corticospinal motoneurons (Rathelot and Strick 2009), especially compared with other motor cortical areas (Galea and Darian-Smith 1994; Maier et al. 2002). Behaviorally, disruption of M1 affected the adaptation to an ABR perturbation but not to a GRA perturbation (Orban de Xivry et al. 2011a). In addition, the link between changes in MEPs and the strength of motor memory (Fig. 7D) is reminiscent of the link between M1 and retention of motor adaptation (Richardson et al. 2006; Hadipour-Niktarash et al. 2007). Similar correlations between performance and spine formation in M1 (Xu et al. 2009; Yang et al. 2009) and between performance and the responsiveness of the GABAergic system (Stagg et al. 2011) were found during skill learning tasks but are rarely observed with TMS measurements (Ljubisavljevic 2006). This link between M1 reorganization and motor memory is consistent with observations showing that increasing M1 plasticity before or during learning increases the rate of learning (McDonnell and Ridding 2006; Reed et al. 2011), increases retention (Galea and Celnik 2009; Reis et al. 2009; Fritsch et al. 2010; Galea et al. 2011), and increases generalization (Orban de Xivry et al. 2011b).
The absence of MEP modulation during gradual adaptation reflects either an absence of firing changes or an absence of reorganization.
One of our main findings was that, whereas MEPs changed in the ABR schedule of training, MEPs remained near baseline in the GRA schedule. Why did learning-related changes in MEPs differ in the two schedules?
The absence of learning-related changes in MEPs in the GRA group might suggest that neuronal activity in motor areas do not change during gradual adaptation to a force field perturbation. In this case, there would be no shift in PD of neurons during GRA adaptation for cells that have an initial PD opposite to the force field direction (see above).
Alternatively, rather than reflecting neuronal activity, MEPs could reflect the connectivity of the M1 network that is activated by the TMS. Changes in gray matter connectivity takes place during motor learning (Johansen-Berg 2012) via synaptogenesis (Kleim et al. 2002, 2004; Xu et al. 2009; Yang et al. 2009), unmasking of horizontal connections (Jacobs and Donoghue 1991), or long-term potentiation (Hess and Donoghue 1994; Rioult-Pedotti et al. 1998; Rioult-Pedotti et al. 2000; Ziemann et al. 2004). This reorganization results in more reliable preparatory activity and improved behavioral performance (Kargo and Nitz 2004; Paz and Vaadia 2004). In this framework, preparatory and movement-related activity could be similar in the ABR and GRA protocols (i.e., similar shifts in PD), but the strength of the reorganization would be different. After a reorganization, muscle activation elicited by microstimulation of M1 would differ in the ABR and GRA protocols. Such differences between microstimulation results and changes in PD have been reported in other contexts (Blohm et al. 2009). Indeed, the change in PD reflects the local contribution of one neuron to the behavior, whereas microstimulation reflects a more global measure of the network. It is possible that MEP changes are not a reflection of neuronal activity in M1 before and during the reach but possibly a measure of M1 organization at the level of network connectivity.
Neural basis of GRA versus ABR adaptation.
In previous studies, we found that a TMS pulse after completion of a trial did not affect adaptation in the GRA protocol (Hadipour-Niktarash et al. 2007; Orban de Xivry et al. 2011a) but disrupted adaptation in the ABR protocol (Orban de Xivry et al. 2011a). Specifically, in the ABR schedule, disruption of M1 did not affect the rapid improvement in the performance that accompanies the first few trials of training. Rather, disruption of M1 prevented the subsequent small improvements in performance that normally follow this initial large improvement. Together, the present and previous studies suggest that M1 is a critical node in the system that allows adaptation to the ABR schedule of perturbations but may play a less important role when the adaptation is GRA. Why might the role of M1 differ when perturbations are imposed abruptly versus gradually?
Reach adaptation was initially viewed as an error-dependent process: the error experienced in a given movement appeared to induce a form of learning, resulting in a change in the motor commands that guided the subsequent movement (Thoroughman and Shadmehr 2000; Donchin et al. 2003; Smith et al. 2006). However, recent results have suggested that in addition to this error-dependent process, there exists a second process that contributes to the formation of motor memories. This second process appears to depend not on error but on repetition of the motor commands and their reinforcement (Diedrichsen et al. 2010; Huang et al. 2011). For example, Diedrichsen et al. (2010) found evidence for a slow, repetition-dependent process that coexisted with a fast, error-dependent process. ABR schedules may rely on error-dependent learning in the early trials but then increasingly depend on repetition-dependent learning in the later trials. GRA schedules, on the other hand, may benefit from error- and/or reward-dependent learning (Izawa et al. 2012) and would continuously require changes in the motor commands, minimizing repetition.
M1 may play a significant role in the ABR but not GRA schedule because repetition induces plasticity in M1 (Classen et al. 1998), and repetition plays a more dominant role in the ABR than GRA schedule. Indeed, when people repeat a movement, MEPs in the task relevant muscles tend to increase (Muellbacher et al. 2001; Rosenkranz et al. 2007). It appears that repetition induces a form of plasticity in M1 such that the neurons that represent the movement become more excitable, i.e., more easily activated, likely through reduced strength of existing inhibitory pathways (Butefisch et al. 2000).
The parameters driving repetition-dependent processes are currently unknown. For instance, it is unknown how many repetitions of the same movement are needed for the repetition-dependent process to elicit motor cortex reorganization or how variable these movements can be to represent the repetition of a single movement (Verstynen and Sabes 2011). In the present experiment, we found that at least 45 trials (with 2 targets) in the ABR condition were needed to see clear effects on MEPs. Indeed, during the first 45 trials, we did not observe a clear direction-dependent increase in MEPs and the change in MEPs during the first block of training was smaller than at the end of training. In addition, we did not observe changes at the end of the gradual training despite the perturbation being constant during 55 consecutive trials. In contrast, Diedrichsen et al. (2010) observed repetition-dependent effects on behavior with 15 movements to a single target. In Fig. 5C, we plotted the change in the MEP index as a function of block. In the ABR group, this index grew rapidly in the first two blocks and then appeared to reach a plateau in the third and four blocks. In the GRA group, the MEP index appeared near baseline throughout training.
The differential change in corticospinal excitability in the ABR and GRA schedules adds to the list of differences observed between those two protocols. For example, the GRA schedule of training yields larger changes in feedback gains (Saijo and Gomi 2010) and, in some cases, a longer-lasting memory than the ABR schedule (Klassen et al. 2005; Huang and Shadmehr 2009; Pekny et al. 2011). GRA adaptation can produce a different generalization pattern than ABR adaptation (Michel et al. 2007; Kluzik et al. 2008). Furthermore, the cerebellum appears to be differentially involved in these two adaptation protocols (Schlerf et al. 2012), and cerebellar patients show improvements in performance in the GRA versus ABR condition (Criscimagna-Hemminger et al. 2010). Therefore, it now appears that damage to the cerebellum or disruption of M1 affects performance in the ABR condition but has a smaller effect in the GRA condition. Unfortunately, no theory that we are aware of can currently account for all these results.
Confounding factors.
Our measure of corticospinal excitability was based on the size of the MEPs immediately before the onset of the movement. This measure differs from the standard measure of corticospinal plasticity, where MEPs are measured offline, i.e., at rest before and after a given task. In our case, MEPs were measured during the task and varied with movement direction on a trial-by-trial basis. Near movement onset, there is typically an increase in MEP size with respect to baseline (Rossini et al. 1988; MacKinnon and Rothwell 2000; Michelet et al. 2010). Therefore, we tried to control for confounding factors such as prepulse EMG activity, EMG activity at the time of stimulation in no-TMS trials, and movement-related EMG activity. None of those factors differed between the ABR and GRA conditions, nor did they account for the difference in MEPs between those conditions.
Independent changes in behavior and corticospinal plasticity have been previously observed during long-term training in which the initial change in cortical plasticity dissipates although trained performance is maintained (Muellbacher et al. 2001; Pascual-Leone 2001; Reed et al. 2011). However, the fact that we observed acquisition of a new motor behavior (in the GRA group) without comparable changes in corticospinal excitability is a new observation that, to our knowledge, has not been previously observed.
Conclusions.
In the present report, we used MEPs to monitor corticospinal excitability during motor adaptation. We found that adaptation to an abrupt perturbation schedule induced changes in MEPs that correlated with the strength of the motor memory and that these changes parallel some of the changes observed at the single neuron level in cortical motor areas. However, adaptation to a gradual perturbation induced significantly smaller changes, despite comparable levels of motor output in the two protocols. This absence of MEP change in the GRA schedule suggests a different role of corticospinal plasticity in these two conditions. Finally, washout in behavior did not return the MEPs to baseline, but rather introduced changes that suggested the engagement of a new network to mask previously acquired motor memories.
GRANTS
J. J. Orban de Xivry is supported by a Brains Back to Brussels Fellowship from the Brussels region, Belgium. This research was supported by National Institute of Neurological Disorders and Stroke Grant NS-078311 and the Human Frontiers Science Program.
DISCLOSURES
No conflicts of interest, financial or otherwise, are declared by the author(s).
AUTHOR CONTRIBUTIONS
Author contributions: J.-J.O.d.X. and R.S. conception and design of research; J.-J.O.d.X., M.A.A.-P., M.D.H., and Y.S. performed experiments; J.-J.O.d.X. analyzed data; J.-J.O.d.X. and R.S. interpreted results of experiments; J.-J.O.d.X. and R.S. prepared figures; J.-J.O.d.X. drafted manuscript; J.-J.O.d.X. and R.S. edited and revised manuscript; J.-J.O.d.X. and R.S. approved final version of manuscript.
ACKNOWLEDGMENTS
Present address of M. A. Ahmadi-Pajouh: Department of Biomedical Engineering, Amirkabir University of Technology, Tehran, Islamic Republic of Iran.
REFERENCES
- Ahmadi-Pajouh MA, Towhidkhah F, Shadmehr R. Preparing to reach: selecting an adaptive long-latency feedback controller. J Neurosci 32: 9537–9545, 2012 [DOI] [PMC free article] [PubMed] [Google Scholar]
- Allison GT, Marshall RN, Singer KP. EMG signal amplitude normalization technique in stretch-shortening cycle movements. J Electromyogr Kinesiol 3: 236–244, 1993 [DOI] [PubMed] [Google Scholar]
- Arce F, Novick I, Mandelblat-Cerf Y, Vaadia E. Neuronal correlates of memory formation in motor cortex after adaptation to force field. J Neurosci 30: 9189–9198, 2010a [DOI] [PMC free article] [PubMed] [Google Scholar]
- Arce F, Novick I, Mandelblat-Cerf Y, Israel Z, Ghez C, Vaadia E. Combined adaptiveness of specific motor cortical ensembles underlies learning. J Neurosci 30: 5415–5425, 2010b [DOI] [PMC free article] [PubMed] [Google Scholar]
- Blohm G, Keith G, Crawford J. Decoding the cortical transformations for visually guided reaching in 3D space. Cereb Cortex 19: 1372–1393, 2009 [DOI] [PubMed] [Google Scholar]
- Burden A, Bartlett R. Normalisation of EMG amplitude: an evaluation, and comparison of old and new methods. Med Eng Phys 21: 247–257, 1999 [DOI] [PubMed] [Google Scholar]
- Burke D, Pierrot-Deseilligny E. Caveats when studying motor cortex excitability, and the cortical control of movement using transcranial magnetic stimulation. Clin Neurophysiol 121: 121–123, 2010 [DOI] [PubMed] [Google Scholar]
- Butefisch CM, Davis BC, Wise SP, Sawaki L, Kopylev L, Classen J, Cohen LG. Mechanisms of use-dependent plasticity in the human motor cortex. Proc Natl Acad Sci USA 97: 3661–3665, 2000 [DOI] [PMC free article] [PubMed] [Google Scholar]
- Chen XY, Wolpaw JR. Operant conditioning of H.-reflex in freely moving rats. J Neurophysiol 73: 411–415, 1995 [DOI] [PubMed] [Google Scholar]
- Classen J, Liepert J, Wise S, Hallett M, Cohen L. Rapid plasticity of human cortical movement representation induced by practice. J Neurophysiol 79: 1117–1123, 1998 [DOI] [PubMed] [Google Scholar]
- Criscimagna-Hemminger S, Bastian A, Shadmehr R. Size of error affects cerebellar contributions to motor learning. J Neurophysiol 103: 2275–2284, 2010 [DOI] [PMC free article] [PubMed] [Google Scholar]
- Diedrichsen J, White O, Newman D, Lally N. Use-dependent, and error-based learning of motor behaviors. J Neurosci 30: 5159–5166, 2010 [DOI] [PMC free article] [PubMed] [Google Scholar]
- Donchin O, Francis J, Shadmehr R. Quantifying generalization from trial-by-trial behavior of adaptive systems that learn with basis functions: theory, and experiments in human motor control. J Neurosci 23: 9032–9045, 2003 [DOI] [PMC free article] [PubMed] [Google Scholar]
- Fritsch B, Reis J, Martinowich K, Schambra HM, Ji Y, Cohen LG, Lu B. Direct current stimulation promotes BDNF-dependent synaptic plasticity: potential implications for motor learning. Neuron 66:198–204, 2010 [DOI] [PMC free article] [PubMed] [Google Scholar]
- Galea J, Celnik P. Brain polarization enhances the formation, and retention of motor memories. J Neurophysiol 102: 294–301, 2009 [DOI] [PMC free article] [PubMed] [Google Scholar]
- Galea JM, Vazquez A, Pasricha N, Orban de Xivry JJ, Celnik P. Dissociating the roles of the cerebellum, and motor cortex during adaptive learning: the motor cortex retains what the cerebellum learns. Cereb Cortex 21: 1761–1770, 2011 [DOI] [PMC free article] [PubMed] [Google Scholar]
- Galea MP, Darian-Smith I. Multiple corticospinal neuron populations in the macaque monkey are specified by their unique cortical origins, spinal terminations, and connections. Cereb Cortex 4: 166–194, 1994 [DOI] [PubMed] [Google Scholar]
- Gandolfo F, Li C, Benda B, Schioppa C, Bizzi E. Cortical correlates of learning in monkeys adapting to a new dynamical environment. Proc Natl Acad Sci USA 97: 2259–2263, 2000 [DOI] [PMC free article] [PubMed] [Google Scholar]
- Hadipour-Niktarash A, Lee C, Desmond J, Shadmehr R. Impairment of retention but not acquisition of a visuomotor skill through time-dependent disruption of primary motor cortex. J Neurosci 27: 13413–13419, 2007 [DOI] [PMC free article] [PubMed] [Google Scholar]
- Hess CW, Mills KR, Murray NM. Magnetic stimulation of the human brain: facilitation of motor responses by voluntary contraction of ipsilateral, and contralateral muscles with additional observations on an amputee. Neurosci Lett 71: 235–240, 1986 [DOI] [PubMed] [Google Scholar]
- Hess G, Donoghue J. Long-term potentiation of horizontal connections provides a mechanism to reorganize cortical motor maps. J Neurophysiol 71: 2543–2547, 1994 [DOI] [PubMed] [Google Scholar]
- Huang V, Shadmehr R. Persistence of motor memories reflects statistics of the learning event. J Neurophysiol 102: 931–940, 2009 [DOI] [PMC free article] [PubMed] [Google Scholar]
- Huang VS, Haith A, Mazzoni P, Krakauer JW. Rethinking motor learning, and savings in adaptation paradigms: model-free memory for successful actions combines with internal models. Neuron 70: 787–801, 2011 [DOI] [PMC free article] [PubMed] [Google Scholar]
- Izawa J, Criscimagna-Hemminger SE, Shadmehr R. Cerebellar contributions to reach adaptation, and learning sensory consequences of action. J Neurosci 32:4230–4239, 2012 [DOI] [PMC free article] [PubMed] [Google Scholar]
- Jacobs K, Donoghue J. Reshaping the cortical motor map by unmasking latent intracortical connections. Science 251: 944–947, 1991 [DOI] [PubMed] [Google Scholar]
- Johansen-Berg H. The future of functionally-related structural change assessment. Neuroimage 62: 1293–1298, 2012 [DOI] [PMC free article] [PubMed] [Google Scholar]
- Kamen G, Gabriel DA. Essentials of Electromyography. Champaign, IL: Human Kinetics, 2010 [Google Scholar]
- Kargo WJ, Nitz DA. Improvements in the signal-to-noise ratio of motor cortex cells distinguish early versus late phases of motor skill learning. J Neurosci 24: 5560–5569, 2004 [DOI] [PMC free article] [PubMed] [Google Scholar]
- Klassen J, Tong C, Flanagan JR. Learning and recall of incremental kinematic and dynamic sensorimotor transformations. Exp Brain Res 164: 250–259, 2005 [DOI] [PubMed] [Google Scholar]
- Kleim J, Hogg T, VandenBerg P, Cooper N, Bruneau R, Remple M. Cortical synaptogenesis, and motor map reorganization occur during late, but not early, phase of motor skill learning. J Neurosci 24: 628–633, 2004 [DOI] [PMC free article] [PubMed] [Google Scholar]
- Kleim J, Barbay S, Cooper N, Hogg T, Reidel C, Remple M, Nudo R. Motor learning-dependent synaptogenesis is localized to functionally reorganized motor cortex. Neurobiol Learn Mem 77: 63–77, 2002 [DOI] [PubMed] [Google Scholar]
- Kluzik J, Diedrichsen J, Shadmehr R, Bastian A. Reach adaptation: what determines whether we learn an internal model of the tool or adapt the model of our arm? J Neurophysiol 100: 1455–1464, 2008 [DOI] [PMC free article] [PubMed] [Google Scholar]
- Lavoie BA, Cody FW, Capaday C. Cortical control of human soleus muscle during volitional, and postural activities studied using focal magnetic stimulation. Exp Brain Res 103: 97–107, 1995 [DOI] [PubMed] [Google Scholar]
- Lemon RN, Johansson RS, Westling G. Corticospinal control during reach, grasp, and precision lift in man. J Neurosci 15: 6145–6156, 1995 [DOI] [PMC free article] [PubMed] [Google Scholar]
- Li C, Padoa-Schioppa C, Bizzi E. Neuronal correlates of motor performance, and motor learning in the primary motor cortex of monkeys adapting to an external force field. Neuron 30: 593–607, 2001 [DOI] [PubMed] [Google Scholar]
- Ljubisavljevic M. Transcranial magnetic stimulation, and the motor learning-associated cortical plasticity. Exp Brain Res 173: 215–222, 2006 [DOI] [PubMed] [Google Scholar]
- MacKinnon CD, Rothwell JC. Time-varying changes in corticospinal excitability accompanying the triphasic EMG pattern in humans. J Physiol 528: 633–645, 2000 [DOI] [PMC free article] [PubMed] [Google Scholar]
- Maier MA, Armand J, Kirkwood PA, Yang HW, Davis JN, Lemon RN. Differences in the corticospinal projection from primary motor cortex, and supplementary motor area to macaque upper limb motoneurons: an anatomical and electrophysiological study. Cereb Cortex 12: 281–296, 2002 [DOI] [PubMed] [Google Scholar]
- Mandelblat-Cerf Y, Novick I, Paz R, Link Y, Freeman S, Vaadia E. The neuronal basis of long-term sensorimotor learning. J Neurosci 31: 300–313, 2011 [DOI] [PMC free article] [PubMed] [Google Scholar]
- McDonnell MN, Ridding MC. Afferent stimulation facilitates performance on a novel motor task. Exp Brain Res 170: 109–115, 2006 [DOI] [PubMed] [Google Scholar]
- Michel C, Pisella L, Prablanc C, Rode G, Rossetti Y. Enhancing visuomotor adaptation by reducing error signals: single-step (aware) versus multiple-step (unaware) exposure to wedge prisms. J Cogn Neurosci 19: 341–350, 2007 [DOI] [PubMed] [Google Scholar]
- Michelet T, Duncan GH, Cisek P. Response competition in the primary motor cortex: corticospinal excitability reflects response replacement during simple decisions. J Neurophysiol 104: 119–127, 2010 [DOI] [PubMed] [Google Scholar]
- Muellbacher W, Ziemann U, Boroojerdi B, Cohen L, Hallett M. Role of the human motor cortex in rapid motor learning. Exp Brain Res 136: 431–438, 2001 [DOI] [PubMed] [Google Scholar]
- Orban de Xivry JJ, Criscimagna-Hemminger SE, Shadmehr R. Contributions of the motor cortex to adaptive control of reaching depend on the perturbation schedule. Cerebral Cortex 21:1475–1484, 2011a [DOI] [PMC free article] [PubMed] [Google Scholar]
- Orban de Xivry JJ, Marko MK, Pekny SE, Pastor D, Izawa J, Celnik P, Shadmehr R. Stimulation of the human motor cortex alters generalization patterns of motor learning. J Neurosci 31: 7102–7110, 2011b [DOI] [PMC free article] [PubMed] [Google Scholar]
- Padoa-Schioppa C, Li C, Bizzi E. Neuronal activity in the supplementary motor area of monkeys adapting to a new dynamic environment. J Neurophysiol 91: 449–473, 2004 [DOI] [PubMed] [Google Scholar]
- Pascual-Leone A. The brain that plays music, and is changed by it. Ann NY Acad Sci 930: 315–329, 2001 [DOI] [PubMed] [Google Scholar]
- Paz R, Vaadia E. Learning-induced improvement in encoding, and decoding of specific movement directions by neurons in the primary motor cortex. PLoS Biol 2: e45, 2004 [DOI] [PMC free article] [PubMed] [Google Scholar]
- Pekny SE, Criscimagna-Hemminger SE, Shadmehr R. Protection and expression of human motor memories. J Neurosci 31: 13829–13839, 2011 [DOI] [PMC free article] [PubMed] [Google Scholar]
- Rathelot J, Strick P. Subdivisions of primary motor cortex based on cortico-motoneuronal cells. Proc Natl Acad Sci USA 106: 918–923, 2009 [DOI] [PMC free article] [PubMed] [Google Scholar]
- Reed A, Riley J, Carraway R, Carrasco A, Perez C, Jakkamsetti V, Kilgard MP. Cortical map plasticity improves learning but is not necessary for improved performance. Neuron 70: 121–131, 2011 [DOI] [PubMed] [Google Scholar]
- Reis J, Schambra H, Cohen L, Buch E, Fritsch B, Zarahn E, Celnik P, Krakauer J. Noninvasive cortical stimulation enhances motor skill acquisition over multiple days through an effect on consolidation. Proc Natl Acad Sci USA 106: 1590–1595, 2009 [DOI] [PMC free article] [PubMed] [Google Scholar]
- Richardson AG, Overduin SA, Valero-Cabre A, Padoa-Schioppa C, Pascual-Leone A, Bizzi E, Press DZ. Disruption of primary motor cortex before learning impairs memory of movement dynamics. J Neurosci 26: 12466–12470, 2006 [DOI] [PMC free article] [PubMed] [Google Scholar]
- Rioult-Pedotti M, Friedman D, Donoghue J. Learning-induced LTP in neocortex. Science 290: 533–536, 2000 [DOI] [PubMed] [Google Scholar]
- Rioult-Pedotti M, Friedman D, Hess G, Donoghue J. Strengthening of horizontal cortical connections following skill learning. Nat Neurosci 1: 230–234, 1998 [DOI] [PubMed] [Google Scholar]
- Rosenkranz K, Kacar A, Rothwell J. Differential modulation of motor cortical plasticity, and excitability in early and late phases of human motor learning. J Neurosci 27: 12058–12066, 2007 [DOI] [PMC free article] [PubMed] [Google Scholar]
- Rossini PM, Zarola F, Stalberg E, Caramia M. Pre-movement facilitation of motor-evoked potentials in man during transcranial stimulation of the central motor pathways. Brain Res 458: 20–30, 1988 [DOI] [PubMed] [Google Scholar]
- Saijo N, Gomi H. Multiple motor learning strategies in visuomotor rotation. PLoS One 5: e9399, 2010 [DOI] [PMC free article] [PubMed] [Google Scholar]
- Schlerf JE, Galea JM, Bastian AJ, Celnik PA. Dynamic modulation of cerebellar excitability for abrupt, but not gradual, visuomotor adaptation. J Neurosci 32: 11610–11617, 2012 [DOI] [PMC free article] [PubMed] [Google Scholar]
- Shadmehr R, Mussa-Ivaldi F. Adaptive representation of dynamics during learning of a motor task. J Neurosci 14: 3208–3224, 1994 [DOI] [PMC free article] [PubMed] [Google Scholar]
- Smith MA, Shadmehr R. Intact ability to learn internal models of arm dynamics in Huntington's disease but not cerebellar degeneration. J Neurophysiol 93: 2809–2821, 2005 [DOI] [PubMed] [Google Scholar]
- Smith MA, Ghazizadeh A, Shadmehr R. Interacting adaptive processes with different timescales underlie short-term motor learning. PLoS Biol 4: e179, 2006 [DOI] [PMC free article] [PubMed] [Google Scholar]
- Stagg CJ, Bachtiar V, Johansen-Berg H. The role of GABA in human motor learning. Curr Biol 21: 480–484, 2011 [DOI] [PMC free article] [PubMed] [Google Scholar]
- Thompson AK, Chen XY, Wolpaw JR. Acquisition of a simple motor skill: task-dependent adaptation plus long-term change in the human soleus H-reflex. J Neurosci 29: 5784–5792, 2009 [DOI] [PMC free article] [PubMed] [Google Scholar]
- Thoroughman KA, Shadmehr R. Electromyographic correlates of learning an internal model of reaching movements. J Neurosci 19: 8573–8588, 1999 [DOI] [PMC free article] [PubMed] [Google Scholar]
- Thoroughman KA, Shadmehr R. Learning of action through adaptive combination of motor primitives. Nature 407: 742–747, 2000 [DOI] [PMC free article] [PubMed] [Google Scholar]
- Tseng Y, Diedrichsen J, Krakauer J, Shadmehr R, Bastian A. Sensory prediction errors drive cerebellum-dependent adaptation of reaching. J Neurophysiol 98: 54–62, 2007 [DOI] [PubMed] [Google Scholar]
- Verstynen T, Sabes PN. How each movement changes the next: an experimental, and theoretical study of fast adaptive priors in reaching. J Neurosci 31: 10050–10059, 2011 [DOI] [PMC free article] [PubMed] [Google Scholar]
- Wolpaw JR. Spinal cord plasticity in acquisition, and maintenance of motor skills. Acta Physiol (Oxf) 189: 155–169, 2007 [DOI] [PubMed] [Google Scholar]
- Wolpaw JR, O'Keefe JA. Adaptive plasticity in the primate spinal stretch reflex: evidence for a two-phase process. J Neurosci 4: 2718–2724, 1984 [DOI] [PMC free article] [PubMed] [Google Scholar]
- Xiao J, Padoa-Schioppa C, Bizzi E. Neuronal correlates of movement dynamics in the dorsal, and ventral premotor area in the monkey. Exp Brain Res 168: 106–119, 2006 [DOI] [PubMed] [Google Scholar]
- Xu T, Yu X, Perlik A, Tobin W, Zweig J, Tennant K, Jones T, Zuo Y. Rapid formation, and selective stabilization of synapses for enduring motor memories. Nature 462: 915–919, 2009 [DOI] [PMC free article] [PubMed] [Google Scholar]
- Yang G, Pan F, Gan W. Stably maintained dendritic spines are associated with lifelong memories. Nature 462: 920–924, 2009 [DOI] [PMC free article] [PubMed] [Google Scholar]
- Yang JF, Winter DA. Electromyographic amplitude normalization methods: improving their sensitivity as diagnostic tools in gait analysis. Arch Phys Med Rehabil 65: 517–521, 1984 [PubMed] [Google Scholar]
- Ziemann U, Ilić T, Iliać T, Pauli C, Meintzschel F, Ruge D. Learning modifies subsequent induction of long-term potentiation-like, and long-term depression-like plasticity in human motor cortex. J Neurosci 24: 1666–1672, 2004 [DOI] [PMC free article] [PubMed] [Google Scholar]