

Abstract
We investigated the effects of resting state type on blood oxygen level-dependent (BOLD) signal and functional connectivity in two paradigms: participants either alternated between fixation and eyes closed or maintained fixation or eyes closed throughout each scan. The BOLD signal and functional connectivity of lower and higher tiers of the visual cortical hierarchy were found to be differentially modulated during eyes closed versus fixation. Fixation was associated with greater mean BOLD signals in primary visual cortex and lower mean BOLD signals in extrastriate visual areas than periods of eyes closed. In addition, analysis of thalamocortical functional connectivity during scans in which participants maintained fixation showed synchronized BOLD fluctuations between those thalamic nuclei whose mean BOLD signal was systematically modulated during alternating epochs of eyes closed and fixation, primary visual cortex and the attention network, while during eyes closed negatively correlated fluctuations were seen between the same thalamic nuclei and extrastriate visual areas. Finally, in all visual areas the amplitude of spontaneous BOLD fluctuations was greater during eyes closed than during fixation. The dissociation between early and late tiers of visual cortex, which characterizes both mean and functionally connected components of the BOLD signal, may depend on the reorganization of thalamocortical networks. Since dissociated changes in local blood flow also characterize transitions between different stages of sleep and wakefulness (Braun AR, Balkin TJ, Wesenten NJ, Gwadry F, Carson RE, Varga M, Baldwin P, Belenky G, Herscovitch P. Science 279: 91–95, 1998), our results suggest that dissociated endogenous neural activity in primary and extrastriate cortex may represent a general aspect of brain function.
Keywords: fMRI, oscillatory signals, resting state, spontaneous activity, thalamocortical networks
the first recordings of electroencephalographic (EEG) activity demonstrated that simply keeping one's eyes open or closed changes the ongoing cerebral activity at rest (Berger 1929, 1930). With the advent of functional imaging techniques, the correlates of physiological states have been further characterized. Two main results stand out. First, the cortical distribution of basal cerebral blood flow (CBF) has been shown to differ between sleep and wakefulness (e.g., Dang-Vu et al. 2010). In particular, PET studies in humans indicated that during rapid eye movement (REM) sleep posterior regions of the brain show a dissociated pattern of blood flow changes compared with slow-wave sleep (SWS) and wakefulness. Whereas medial regions, roughly corresponding to primary visual cortex, show decreased basal CBF during REM sleep (Braun et al. 1998), lateral (Braun et al. 1998) and dorsal medial (Madsen et al. 1991) regions corresponding to extrastriate visual areas show increased CBF. This dissociated pattern of CBF changes in visual regions, along with frontal and temporal regions, pons, thalamus, and limbic areas (Braun et al. 1997; Dang-Vu et al. 2010; Madsen et al. 1991), has been suggested to be specifically associated with REM sleep and to potentially account for the phenomenological qualities of oneiric activity (Braun et al. 1998; Hobson 2009). The second notable finding is that during wakefulness certain brain regions belonging to the default mode network (DMN) show systematic decrements in CBF whenever subjects engage in an active task compared with when they maintain a state of quiet wakefulness (Raichle et al. 2001; Shulman et al. 1997). Thus baseline functional signals change across different stages of sleep and between wakeful rest and behaviorally active states.
The availability of objective, physiological markers of sleep and wakefulness has been particularly important for studies mapping the neural circuitry responsible for regulating the sleep-wake cycle and alertness (Bremer 1935; Moruzzi and Magoun 1949). Thalamus plays a major role in shaping ongoing cortical rhythms (Hughes and Crunelli 2005), and both cortical and thalamic structures are endowed with the ability to maintain rhythms in the alpha frequency range (Kristiansen and Courtois 1949; Lopes da Silva and Storm van Leeuwen 1977; Lopes da Silva et al. 1980), which characterizes quiet wakefulness with eyes closed. A number of imaging studies have indicated that blood oxygen level-dependent (BOLD) signals in mediodorsal thalamus (MD) are strongly modulated by alpha power (Difrancesco et al. 2008; Feige et al. 2005; Goldman et al. 2002; Goncalves et al. 2006; Mantini et al. 2007; Moosmann et al. 2003), even though this thalamic region is not known to have direct connections to cortical visual areas (Jones 2007). In addition, opening and closing the eyes has been found to modulate the BOLD signal in mediodorsal and lateral geniculate thalamic regions (Marx et al. 2003, 2004).
In the present work, we examined modulations of the mean BOLD signal and spontaneous BOLD fluctuations across fixation and eyes-closed epochs. This was motivated in part by our previous finding that the amplitude of spontaneous BOLD fluctuations, in primary and extrastriate visual regions as well as other sensory and paralimbic cortical regions, is increased during periods of eyes closed compared with eyes open and fixation (McAvoy et al. 2008). Whether this effect could be related to changes in the underlying mean level of the BOLD signal was not determined. Earlier work has provided somewhat puzzling results regarding the effects of opening and closing one's eyes in visual cortical regions. While some have reported increased BOLD signals in primary visual cortex during eyes open compared with closed (Marx et al. 2004; Uludağ et al. 2004), others have reported increased BOLD signals in extrastriate visual cortex (e.g., Marx et al. 2003) during eyes closed compared with open. In view of the crucial role of thalamus in establishing and maintaining cortical rhythms as noted above, we also examined thalamocortical functional connectivity during fixation and eyes closed and the pattern of temporal dependencies between spontaneous activity in thalamic and cortical regions across resting states.
Overall our findings indicate that the dissociated pattern of CBF, first observed in sleep (Braun et al. 1998) between primary and extrastriate visual regions, generalizes to transitions between opening and closing the eyes as measured with the BOLD signal, and may therefore be better understood in relation to still elusive factors that change among behavioral states rather than as a hallmark of specific stages of sleep. Moreover, thalamocortical functional connectivity data suggest that these changes may be related to a reconfiguration of the transfer of information between thalamus and cortex.
MATERIALS AND METHODS
Paradigms and subjects.
Two protocols were used to investigate the relation between opening and closing the eyes and the BOLD signal: 1) the Berger paradigm, in which subjects alternated between fixation and eyes-closed conditions repeatedly within a scan, and 2) a resting-state paradigm in which subjects either maintained fixation or kept their eyes closed for the duration of the scan. Data from both paradigms have been published previously (Fox et al. 2005a, 2005b; McAvoy et al. 2008).
The Washington University Institutional Review Board approved both experimental protocols, and subjects gave written consent prior to participation. In the Berger paradigm, 11 healthy right-handed subjects (7 women, 4 men; average age 28.1 yr) participated in the fMRI experiment. The bore and scanning room were completely darkened through the use of special draperies. Participants were instructed either to fixate on a dim light presented through a fiber-optic cable within the scanner bore or to maintain a state of wakeful rest with their eyes closed. Verbal instructions to open and close the eyes were given every 40 s. The imaging session included six scans, each lasting 5.3 min. The starting state, fixation or eyes closed, was counterbalanced across subjects and scans.
In the resting-state paradigm, 10 healthy right-handed subjects (6 women, 4 men; average age 23.6 yr) participated in a simultaneous fMRI/EEG experiment. The experiment consisted of nine scans, each 5.5 min long. Before each scan, subjects were instructed to either keep their eyes open or closed or maintain fixation on a foveal cross hair for the duration of the scan. The order in which the three conditions were run was randomized. Imaging data were obtained from a public database available at brainscape.org (study BS003). In 9 of 10 subjects, EEG data were acquired simultaneously with fMRI (DC-3500 Hz, 20-kHz sampling rate) using the MagLink system and the synamps/2 amplifier (Compumedics Neuroscan) with 32 electrodes (modified 10/20), including bipolar, vertical eye, and cardiac leads. The reference electrode was located between Pz and Cz and the ground electrode between Fz and FPz. Electrodes to record the electrooculogram (EOG) were placed in a bipolar configuration ∼3 cm above and below the outer canthus of the left eye. Gradient artifact was reduced with Scan 4.3 software (Compumedics Neuroscan), with ballistocardiogram artifacts reduced with in-house software (Vincent et al. 2007). EEG was inspected both visually and with spectral information in the alpha, theta, and delta bands to ensure that subjects were not asleep. Only the EOG, not the EEG, data were used to generate predictors of the BOLD signal.
Imaging methods and preprocessing.
Images were acquired with a Siemens 3-T Allegra system (Erlangen, Germany). In the Berger paradigm, an asymmetric gradient-echo echo-planar imaging sequence was used (repetition time = 2.5 s, echo time = 25 ms, flip angle = 90°). Each scan comprised 128 volumes of 32 contiguous 4-mm axial slices (4 mm isotropic in plane) providing whole brain coverage. In the resting-state paradigm, an asymmetric gradient-echo echo-planar imaging sequence was used (repetition time = 3.013 s, which included a 1-s gap, echo time = 25 ms, flip angle = 90°). Each scan included 110 volumes of 32 contiguous 4-mm axial slices (4 mm isotropic in plane) providing whole brain coverage. Structural images included one sagittal MP-RAGE T1-weighted image (repetition time = 2.1 s, echo time = 3.93 ms, flip angle = 7°, 1 × 1 × 1.25 mm) and a T2-weighted fast spin-echo image.
Image preprocessing was carried out with the same procedure for both data sets and included the following steps: 1) compensation for slice-dependent time shifts, 2) elimination of odd/even slice intensity differences due to interpolated acquisition, 3) realignment of all data acquired in each subject within and across runs to compensate for rigid body motion, and 4) normalization to a whole brain mode value of 1,000 (Ojemann et al. 1997). The functional data were transformed into atlas space (Talairach and Tournoux 1988) by computing a sequence of affine transformations (first frame EPI sequence to T2-weighted fast spin-echo to MP-RAGE to atlas representative target), which were combined by matrix multiplication. Reslicing the functional data to 3-mm isotropic voxels in conformity with the atlas then involved only one interpolation. For cross-modal (i.e., functional to structural) image registration, a locally developed algorithm was used (Rowland et al. 2005).
Mean BOLD signals.
For the Berger data, subject-specific general linear models (GLMs) (Friston et al. 1995) were used to estimate, frame by frame, the mean BOLD signal time locked to the verbal instruction to open or close the eyes. The GLM regressors included two sets of delta functions, each modeling the BOLD response over 16 time points. Additional regressors included a constant term and linear trend for each scan to account for slow drifts in the BOLD time series. The first 40-s epoch of each scan was discarded because it included a period of non-steady-state magnetization. The estimated mean signals were normalized by the value of the constant term averaged over scans and then spatially smoothed with a 6-mm full width at half-maximum (FWHM) three-dimensional (3D) Gaussian kernel to blur interindividual differences in brain anatomy.
Statistical significance of the mean signal changes evoked by opening and closing eyes was assessed with a group-level repeated-measures analysis of variance (ANOVA) that included subjects as the random factor and two fixed factors, resting state type (eyes closed and fixation) and time (16 time points). The resulting statistical maps, which included the resting state type × time interaction (F15,150), were z-transformed and corrected for multiple comparisons (|z| ≥ 3.0, minimum 13 face-connected voxels, P < 0.05 corrected) with a Monte Carlo-based method (Forman et al. 1995; McAvoy et al. 2001).
Thalamocortical functional connectivity.
The Berger and resting-state BOLD data were detrended to remove the effects of slow drifts. Since the Berger data included BOLD signals evoked by the alternating 40-s periods of fixation and eyes closed, these mean signals were subtracted. Both data sets were low-pass filtered at a cutoff frequency of 0.08 Hz (Biswal et al. 1995; Lowe et al. 1998). Subject-specific GLMs included, as independent variables, the time series of the seed region and a constant term for each run. The seed region estimates were normalized by the value of the constant term averaged over scans and then spatially smoothed with a 6-mm FWHM 3D Gaussian kernel. Statistical significance was assessed with a group-level two-tailed, one-sample Student's t-test. The statistical maps were z-transformed and corrected for multiple comparisons (|z| ≥ 3.0, minimum 17 face-connected voxels, P < 0.05 corrected).
Since functional connectivity of the thalamus was dominated by the DMN and in order to uncover secondary patterns of thalamocortical functional connectivity, a second GLM was computed that included an additional regressor: the BOLD time series in a predefined mask of the DMN. The mask was obtained from the statistical map published in the first study, which documented the existence of the DMN (Raichle et al. 2001; Shulman et al. 1997).
The functional connectivity analysis is limited to assessing simultaneous signal changes between a given seed region and the rest of the brain, and thus provides only a limited view of the relation between thalamic and cortical spontaneous activity. A temporally extended picture of this relation can be obtained by computing the cross-covariance, which allows one to examine the nature of functional connectivity in detail. For example, if the difference in functional connectivity between eyes closed and fixation is due to changes in the relative timing between cortical and thalamic signals, then the cross-covariance will be shifted along the time axis without a change in shape. On the other hand, if changes in functional connectivity are due to a common signal being added to thalamic and cortical regions, then the cross-covariance between these regions will change by an additive, symmetric function.
Prior to computation of the cross-covariance, the resting-state BOLD time series was detrended and low-pass filtered at a cutoff frequency of 0.08 Hz, and the DMN time series and constant term were regressed out. Finally, the resulting residual time series was normalized by the value of the constant term averaged over scans. The cross-covariance was calculated by systematically shifting the seed region and voxel time series with respect to one another along the time axis and computing the covariance between temporally realigned BOLD values. The time shift, or lag, included both negative and positive delays. Each subject contributed four cross-covariances to the analysis, one for each combination of resting state type (eyes closed and fixation) and thalamic seed, that is, MD and lateral geniculate nucleus (LGN), which were spatially smoothed with a 6-mm FWHM 3D Gaussian kernel. The significance of the effects of opening and closing the eyes on the cross-covariance was evaluated with a group-level repeated-measures ANOVA that included subjects as the random factor and fixed factors of resting state type (eyes closed and fixation), lag (81 time steps spanning 2 min in both leading and lagging directions), and seed region (MD and LGN). The resulting statistical maps, which included the resting state type × lag interaction (F80,720), were z-transformed and corrected for multiple comparisons (|z| ≥ 3.0, minimum 13 face-connected voxels, P < 0.05 corrected).
Oscillatory BOLD signals.
The Berger data were also used to estimate the amplitude of spontaneous BOLD fluctuations during fixation and eyes closed. For each subject the constant term and linear trend were subtracted from the BOLD time series. The residual time series was then normalized by the value of the constant term averaged over scans. The standard deviation was computed separately for fixation and eyes-closed epochs, yielding two time courses of the amplitude of the average deviation of the BOLD signal from its mean value, each 16 time points. These estimates were spatially smoothed with a 6-mm FWHM 3D Gaussian kernel. Statistical significance was assessed with a group-level repeated-measures ANOVA that included subjects as the random factor and two fixed factors, time (16 time points) and resting state (eyes closed and fixation). The resulting statistical maps, which included the resting state type × time interaction (F15,150), were z-transformed and corrected for multiple comparisons (|z| ≥ 3.0, minimum 13 face-connected voxels, P < 0.05 corrected).
Blink and eye movement analysis.
The EOG was used to recover the timing of spontaneous blinks and eye movements. Blinks were defined as excursions of the EOG exceeding ±175 μV. The duration of a blink event was defined conventionally to be 0.5 s and was centered on the peak value of the EOG. If the EOG signal had not returned to within ±20 μV of the baseline by the end of the interval, the event duration was extended until this criterion was satisfied. The eye movement record was obtained from the EOG record after removal of all blinks. The blink and eye movement records were full-wave rectified (Ramot et al. 2011) and convolved with a canonical hemodynamic response function (Boynton et al. 1996). The contribution of blinks and eye movements to the BOLD signal during the eyes-closed and fixation scans was estimated with participant-specific GLMs. The GLMs included, beside the blink and eye movement regressors, a constant term and linear trend for each scan. The estimates were normalized by the value of the constant term averaged over scans and then spatially smoothed with a 6-mm FWHM 3D Gaussian kernel. Statistical significance was assessed with a group-level two-tailed, one-sample Student's t-test. The voxelwise statistical maps were z-transformed and corrected for multiple comparisons (|z| ≥ 3.0, minimum 17 face-connected voxels, P < 0.05 corrected).
RESULTS
Mean BOLD signals in visual cortices dissociate between fixation and eyes closed.
Figure 1 shows axial slices highlighting subcortical and cortical regions where the BOLD signal was modulated during alternating 40-s epochs of fixation and eyes closed. In two thalamic regions the BOLD signal increased during fixation. The first region was located along the medial surface of dorsal thalamus (MD); the second, more ventral, lateral, and posterior was identified as the lateral geniculate (LGN) (Marx et al. 2003, 2004). Primary and secondary visual cortex (V1), along the medial posterior occipital pole, also showed increased BOLD signals during fixation. However, extrastriate visual regions, including the lateral MT complex, showed decreased BOLD signals during periods of fixation compared with eyes closed (see Fig. 1). Dorsal and ventral extrastriate visual regions showed similar time courses (not shown). The Talairach coordinates of each region are reported in Table 1.
Fig. 1.

Mean blood oxygen level-dependent (BOLD) signals during alternating periods of fixation and eyes closed. Axial slices show the group-level statistical map of the interaction of resting state type × time, highlighting regions whose mean signal was modulated over time by eyes closed and fixation. Displayed statistics are gaussianized F statistics corrected for multiple comparisons (P < 0.05). Regions include sensory-motor cortex (SM), frontal eye fields (FEF), mediodorsal thalamus (MD), primary visual cortex (V1), medial temporal cortex (MT), and the lateral geniculate nucleus (LGN). While V1 shows a positive deflection in mean signal during fixation and a negative deflection during eyes closed, MT shows the opposite pattern. Peak coordinates are listed in Table 1.
Table 1.
Peak coordinates of regions identified in Figure 1
| Peak Coordinates |
Center of Mass |
||||||
|---|---|---|---|---|---|---|---|
| Region | Abbreviation | x | y | z | x | y | z |
| Left sensory-motor | LSM | −26 | −36 | 57 | −25 | −35 | 59 |
| Right sensory-motor | RSM | 38 | −24 | 60 | 31 | −28 | 59 |
| Left frontal eye field | LFEF | −35 | −9 | 45 | −32 | −9 | 48 |
| Right frontal eye field | RFEF | 38 | −9 | 48 | 35 | −13 | 48 |
| Left mediodorsal thalamus | LMD | −11 | −18 | 9 | −10 | −18 | 10 |
| Right mediodorsal thalamus | RMD | 11 | −15 | 9 | 11 | −16 | 10 |
| Left visual cortex | LV1 | −2 | −84 | 3 | −5 | −82 | 4 |
| Right visual cortex | RV1 | 8 | −87 | 6 | 8 | −86 | 5 |
| Left medial temporal | LMT | −47 | −75 | 6 | −46 | −74 | 4 |
| Right medial temporal | RMT | 50 | −72 | 3 | 49 | −73 | 4 |
| Left lateral geniculate nucleus | LLGN | −26 | −24 | −3 | −25 | −27 | −5 |
| Right lateral geniculate nucleus | RLGN | 26 | −27 | −6 | 25 | −26 | −4 |
Peak coordinates and center of mass are given in millimeters according to the atlas of Talairach and Tournoux (1988) All regions have a volume of 567 mm3.
Functional thalamocortical networks are reconfigured by fixation and eyes closed.
We measured thalamocortical functional connectivity in the Berger paradigm. Thalamic seed regions (i.e., MD and LGN) were defined functionally from the map shown in Fig. 1. The axial slices in Fig. 2A show regions that exhibited significant synchronization with the MD seed. These comprised mostly the DMN, including the supplementary motor area (SMA), precuneus, superior lateral prefrontal cortex (SLPFC), and retrosplenial cortex (rSplen). We also compared the correlation between the two thalamic seeds, the DMN (Raichle et al. 2001), and the attention network (Corbetta et al. 2008). The difference in correlation between spontaneous BOLD signals in the two thalamic seed regions and the DMN versus the attention network was highly significant (for MD t10 = 3.51, P < 0.01; for LGN t10 = 5.37, P < 0.001). Moreover, there was no significant correlation between MD and the attention network (t10 = 0.25, P > 0.05), while the correlation of LGN with the attention network was significant (t10 = 3.00, P < 0.05). These data clearly indicate that the DMN signal dominated thalamic connectivity and that correlation with the attention network was either small or nonsignificant.
Fig. 2.

Group-level statistical maps of thalamocortical functional connectivity between the MD seed and the brain. A: Berger data where participants alternated between eyes closed and fixation. Highlighted regions encompass mostly the default mode network (DMN) including the supplementary motor area (SMA), precuneus, superior lateral prefrontal cortex (SLPFC), medial frontal gyrus (MFG), medial prefrontal cortex (MPFC), retrosplenial cortex (rSplen), and ventral medial prefrontal cortex (VMPFC). B: Berger data after partialing out the DMN signal. LG, lingual gyrus. C: eyes closed, resting state data after partialing out the DMN signal. A number of extrastriate regions are negatively correlated with the MD seed including VipV3a, MT, and LG, along with SM. D: fixation, resting state data after partialing out the DMN signal. Regions in the attention network [e.g., FEF and intraparietal sulcus (IPS)] and V1 are positively correlated with the MD seed. Displayed values are gaussianized t statistics corrected for multiple comparisons (P < 0.05).
To uncover patterns of connectivity that did not include signals shared with the DMN, we added the DMN signal as a regressor in a second GLM. This procedure revealed a network of extrastriate visual regions including VipV3a, MT, and lingual gyrus (LG), shown in Fig. 2B, whose spontaneous BOLD fluctuations were negatively correlated with those of the MD seed, while those in the SMA, anterior cingulate (ACC), medial frontal gyrus (MFG), and basal ganglia (e.g., caudate) were positively correlated.
We also assessed thalamocortical functional connectivity of the MD seed using resting-state data, where subjects maintained either eyes closed or fixation throughout each scan. These data allowed functional connectivity to be investigated separately for fixation and eyes-closed periods. Since we wished to examine patterns of connectivity beyond those that encompassed the DMN, the DMN signal was included as a regressor in the GLM. Figure 2C shows that during eyes closed thalamic signals were negatively correlated with regions in extrastriate visual and sensory-motor (SM) cortex, while no correlation was evident with primary visual cortex and the attention network. However, during fixation thalamic signals were positively correlated with those in primary visual cortex and the attention network and negatively correlated with ventral medial prefrontal cortex (VMPFC) (see Fig. 2D).
BOLD correlates of spontaneous blinks and eye movements.
EOG data were available for nine participants, allowing us to examine the BOLD correlates of spontaneous oculomotor signals and their contribution to functional connectivity. Figure 3A shows a sample of one participant's EOG record, containing large signal changes due to blinks during fixation and smaller signal changes due to slow eye movements during eyes closed. Figure 3B highlights regions where the BOLD signal was modulated by blinks during fixation, and Fig. 3C highlights regions where the BOLD signal was modulated by eye movements during eyes closed. Not surprisingly, no statistically significant effects were found for blinks during eyes closed and for eye movements during fixation. The map of the BOLD correlates of blinks highlighted an extensive cortical and subcortical network, including the right superior parietal lobule (SPL), a region slightly anterior to the left frontal eye field (FEF; see Fig. 3B; slice Z = 57), regions medial to the ventral extension of the intraparietal sulcus (VipV3a), pulvinar, primary visual cortex, and parahippocampal gyrus. In contrast, the map of eye movement effects during eyes closed showed a network of subcortical regions including dorsal caudate, globus pallidus, posterior putamen, thalamus, substantia nigra, and superior colliculus. Moreover, we recomputed thalamocortical functional connectivity before and after removing the oculomotor signals. With a group-level repeated-measures ANOVA used to examine the effects of oculomotor signals on thalmocortical functional connectivity, no voxel survived multiple comparison correction in the map of the interaction of resting state by a factor coding whether the oculomotor signals had been removed, suggesting that oculomotor signals play a minor role, if any, in shaping thalamocortical functional connectivity.
Fig. 3.
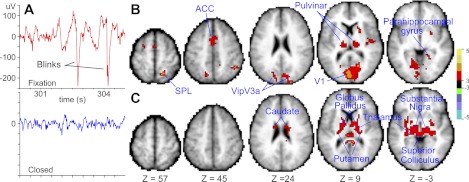
Blink and eye movement analysis. A: 5.0-s-long trace from 1 participant's electrooculogram. Top: trace obtained from a fixation scan. Bottom: trace from an eyes-closed scan. B: group-level statistical map of the main effect of blinks during fixation. C: group-level statistical map of the main effect of eye movements during eyes closed. Displayed statistics are gaussianized t statistics corrected for multiple comparisons (P < 0.05).
Resting states affect timing between thalamic and cortical BOLD fluctuations.
To examine the relation between thalamic and cortical BOLD fluctuations over time, we calculated the cross-covariance between MD and LGN and the brain, using the resting-state data. Shown in Fig. 4 is the group-level statistical map of the interaction of resting state type × lag, highlighting cortical regions in which the thalamocortical cross-covariance changed between eyes closed and fixation. Also shown are the regional cross-covariances with the MD thalamic seed for V1, MT, SM, and FEF. During fixation, thalamic and cortical signals were synchronized as indexed by a fairly narrow peak at 0.0-s lag. However, during eyes closed there was a dramatic reorganization of the temporal dependencies between thalamic and cortical signals. For some regions, such as MT, SM, and FEF, the cross-covariances became antisymmetric, with thalamic signals showing negative covariances with leading cortical signals and positive covariances with lagging cortical signals. In contrast, V1 showed a complex, bimodal relation. These results indicate that differences in functional connectivity of primary and extrastriate visual cortex, during fixation and eyes closed, extend to time lags >0.0 s and include not only a change in the location of the peak cross-covariance value but also a change in the shape of the temporal dependencies between thalamic and cortical fluctuations. Interestingly, the cross-covariances do not clearly suggest that thalamic signals preceded cortical signals or vice versa.
Fig. 4.

Group-level statistical map of the interaction of resting state type × lag, highlighting regions whose BOLD signals showed time-dependent covariations with those in the thalamic seeds between fixation and eyes closed. Displayed statistics are gaussianized F statistics corrected for multiple comparisons (P < 0.05). The regional cross-covariances are computed from time series extracted from the MD seed and visual cortex (V1), MT, SM, and FEF during fixation and eyes closed. For negative lags, the regional time courses lead MD. Cross-covariances show marked effects of resting state type, being larger, broader, and more complex during eyes closed than during fixation.
Amplitude of spontaneous BOLD signals is modulated by opening and closing the eyes.
We examined the standard deviation of the BOLD signal for the Berger data. Figure 5 shows the group-level statistical map of the resting state type × time interaction. A number of posterior cortical regions, mostly within visual areas, showed modulations of epoch-to-epoch variability between fixation and eyes closed. Also shown in Fig. 5 is the time course of the standard deviation of the BOLD signal for V1 and MT regions. In both regions the variability of the BOLD signal increased during eyes closed and decreased during fixation. Previous reports have indicated that the amplitude of spontaneous BOLD fluctuations is greater during eyes closed than during eyes open or fixation (Bianciardi et al. 2009; McAvoy et al. 2008), while others have found the opposite result (Yang et al. 2007). A straightforward account, consistent with the former findings, is that during eyes closed the within-epoch amplitude of spontaneous oscillations increased, leading to the observed increase in between-epoch variability, compared with the fixation condition. Furthermore, increased BOLD variability was observed both in primary and extrastriate visual regions during eyes closed, suggesting that BOLD signal variability, and by extension the amplitude of spontaneous BOLD fluctuations, do not demonstrate the dissociated pattern observed for mean and thalamocortical functional connectivity signals. Whether factors affecting mean and functional connectivity signals, on the one hand, and those affecting the amplitude of spontaneous BOLD oscillations, on the other, differ remains to be established.
Fig. 5.
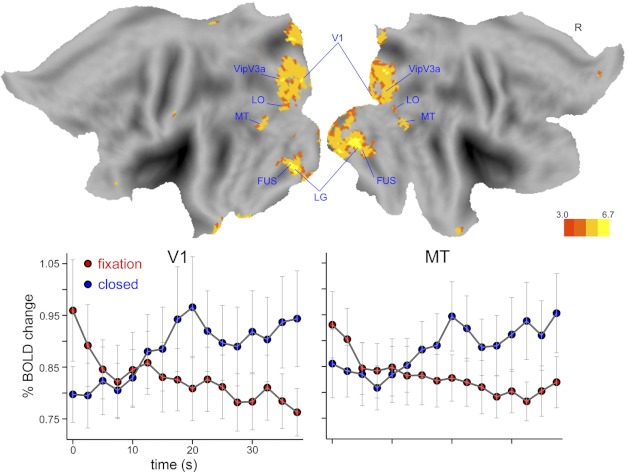
Group-level statistical map of the interaction of resting state type × time, highlighting regions in which the amplitude of spontaneous fluctuations was modulated over time by opening and closing the eyes. Displayed statistics are gaussianized F statistics corrected for multiple comparisons (P < 0.05). In all regions the time course of the BOLD standard deviation increased in amplitude upon eye closure compared with fixation. FUS, fusiform; LO, lateral occipital.
DISCUSSION
Large-scale reorganization of ongoing neural activity during eyes open and closed has been studied in human and animal models and is thought to be associated with changes in both thalamic visual nuclei as well as posterior cortical regions (Hughes and Crunelli 2005). In this work we examined BOLD changes associated with opening and closing one's eyes across the entire brain. We found changes in 1) mean signals of both thalamic and cortical regions, 2) thalamocortical functional connectivity, and 3) the amplitude of spontaneous fluctuations of the BOLD signal. Crucially, eyes closed and fixation produced changes in mean signals and functional connectivity that differed between primary and higher tiers of visual cortex.
Dissociated functional signals between primary and extrastriate visual cortex.
The dissociated mean BOLD signal changes between primary and extrastriate visual regions (see Fig. 1) broadly replicate the dissociated pattern of CBF changes reported in previous PET studies where CBF was observed to increase in extrastriate visual cortex during REM sleep compared with wakefulness (Braun et al. 1998; Madsen et al. 1991) and SWS (Braun et al. 1998) while CBF in primary visual cortex decreased (Braun et al. 1998) during REM sleep compared with SWS. This was a somewhat puzzling result since dissociated signals in primary and extrastriate visual cortex have not been observed for visually evoked responses. Interestingly, in somatosensory discrimination tasks, positive BOLD responses, time locked to the presentation of a tactile stimulus, were found in primary visual cortex while negative responses were found in extrastriate visual cortex of healthy sighted individuals but not blind participants (Burton et al. 2004, 2006). These findings suggest that dissociated signals in visual regions may not reflect sensory processing per se, but more likely endogenous activity, either triggered by phasic changes in the external environment or tonically generated during the sleep-wake cycle.
Transcranial magnetic stimulation (TMS) of the FEF has been reported to increase the BOLD signal in primary visual cortex and decrease the BOLD signal in extrastriate visual cortex in both the absence and the presence of visual stimuli (Ruff et al. 2006). However, these findings could not be replicated in later studies from the same group (Ruff et al. 2008). While results from TMS experiments need to be interpreted cautiously, given the uncertainty regarding its physiological underpinnings, it is of some interest that the MD thalamic region we found to show prominent tonic changes in baseline BOLD signals (see Fig. 1) was primarily functionally connected with elements of the DMN (see Fig. 2A). Whether regions of the attention network, such as FEF, or the DMN may be involved in resetting thalamocortical functional connectivity is a possibility raised by these observations.
On the other hand, there is good evidence of dissociated CBF responses in visual cortex with pharmacological challenges in healthy human participants (Furey et al. 2008; Mentis et al. 2001). In fact, decreased CBF in extrastriate and increased CBF in primary visual cortex are observed during cholinergic stimulations, suggesting a central role of subcortical cholinergic afferents in driving dissociated blood flow changes in visual regions. Moreover, augmentation of cholinergic transmission sharpens the spatial spread of visually evoked BOLD responses in early retinotopic visual cortex (Silver et al. 2008). Conversely, increased noradrenergic activity through stimulation of brain stem nuclei (Goadsby and Duckworth 1989), nonspecific amplification of aminergic transmission (Devous et al. 2001), and use of selective noradrenergic agonists (Swartz et al. 2000) is followed by decreases of CBF in both primary and extrastriate visual regions.
Oculomotor signals do not contribute to resting state effects on thalamocortical connectivity.
We found that oculomotor signals were associated with significant BOLD modulations during fixation and eyes closed (see Fig. 3, B and C, respectively), raising the possibility that resting state differences in functional connectivity reflect low-level differences in motor behavior. Many of the regions that showed BOLD effects to spontaneous blinking have also been reported in previous fMRI studies (Chung et al. 2006; Tse et al. 2010; Yoon et al. 2005), suggesting that our EOG data were of comparable quality. Others have suggested that spontaneous fluctuations in the DMN (Ramot et al. 2011) are correlated with oculomotor signals during eyes closed. Instead, we observed prominent subcortical activations, in agreement with neurophysiological evidence suggesting a prominent role of basal ganglia in self-generated eye movements (Shires et al. 2010; Utter and Basso 2008). Furthermore, the study by Ramot et al. (2011) included BOLD effects that exceeded a low, uncorrected statistical threshold despite the study having a large number of participants, suggesting that the size of the eye movement effects on cortical BOLD signals was rather small. More importantly, we did not find oculomotor signals to significantly alter the connectivity between thalamic seeds and cortical spontaneous fluctuations.
Relation between thalamus and cortex.
On the basis of comparisons of mean BOLD signal changes during eyes open and closed, other investigators have inferred an organization of cortical activity whereby eyes-open periods are characterized by increased activity in an exteroceptive network, encompassing the attention network, while eyes closed is characterized by increased activity in an interoceptive network, which includes extrastriate visual regions and somatosensory cortex (Brandt 2006; Marx et al. 2003, 2004). Although this proposal agrees with our functional connectivity results, a dissociation between primary and extrastriate visual regions was not found in a previous report that examined the functional connectivity of mediodorsal and lateroventral thalamic structures during eyes open and closed (Zou et al. 2009). Nonetheless, a number of functional connectivity studies have found that primary and extrastriate visual cortices belong to separate resting state networks (Beckmann et al. 2005; Damoiseaux et al. 2006; Smith et al. 2009; Tyszka et al. 2011), indicating that spontaneous BOLD fluctuations in primary and extrastriate visual regions are not always coherent. An obvious, if speculative, interpretation of the changes we observed in mean and functional connectivity signals between fixation and eyes closed is that they both reflect changes in the thalamocortical transfer of information. Simpler explanations can probably be ruled out. For example, Schölvinck et al. (2010) found that the temporal phase between neural and BOLD signals can change with resting state type. One may then infer that resting state effects on functional connectivity reflect changes in the delay between thalamic and cortical BOLD signals. This hypothesis would predict a change in the location of the peak value but not the shape of the cross-covariance function, contrary to what we found (see Fig. 4).
Dissociated changes between primary and extrastriate visual cortex suggest that the relation between neural signals in thalamic and extrastriate visual regions may not require mediation through primary visual cortex, either because there are direct thalamic projections to extrastriate visual regions (Schmid et al. 2010) or because BOLD changes in posterior regions reflect the effects of ascending modulatory, rather than sensory, projections. Alternatively, the flow of information from thalamus to higher tiers of visual cortex may be variably gated in primary visual cortex, according to physiological state (Damoiseaux and Greicius 2009; Schroeder et al. 2008; Watson et al. 2008).
Accounting for BOLD effects of physiological state.
In trying to account for BOLD effects of eyes open and closed described here, and more generally those of physiological state on basal CBF and metabolism, it is obvious to consider concomitant changes in electrophysiological signals. Increased power in the alpha band is observed routinely during eyes closed compared with open (Berger 1929, 1930), and its modulation is considered the hallmark of that transition (Adrian and Matthews 1934). An extensive literature has addressed the BOLD correlates of the alpha rhythm and found that increased alpha activity is associated with increased BOLD signals in thalamic regions (de Munck et al. 2007; Difrancesco et al. 2008; Feige et al. 2005; Goldman et al. 2002; Goncalves et al. 2006; Larson-Prior et al. 2011; Mantini et al. 2007; Moosmann et al. 2003) and decreased BOLD signals in primary and extrastriate visual cortex (de Munck et al. 2007; Difrancesco et al. 2008; Feige et al. 2005; Goldman et al. 2002; Goncalves et al. 2006; Laufs et al. 2006; Larson-Prior et al. 2011). Clearly, modulations of the alpha rhythm, by themselves, cannot account for the effects of eyes closed and fixation on the BOLD signal, since one would expect greater thalamic BOLD signals and smaller visual cortical BOLD signals during eyes closed than during fixation, contrary to what we found (see Fig. 1). Second, alpha power does not appear prominently during either SWS or REM sleep (Rechtschaffen and Kales 1968; Silber et al. 2007) and therefore could not account for the fact that transitions from eyes open to closed as well as from SWS to REM sleep show dissociated changes in functional signals between primary and extrastriate visual cortex.
An alternative possibility is that BOLD changes during eyes closed and fixation are driven by changes in cholinergic innervation of thalamic and cortical regions. Administration of cholinergic drugs is associated with dissociated CBF changes in primary and extrastriate visual cortex, as noted above (Furey et al. 2008; Mentis et al. 2001). However, the effects of cholinergic drugs on local BOLD signals and CBF are exactly opposite those measured during states of increased cholinergic tone, such as periods of increased alpha rhythm (Hughes and Crunelli 2005) and REM sleep (Hobson 2009). The lack of obvious, simple physiological or pharmacological correlates of the effects of eyes open and closed on BOLD signals and thalamocortical functional connectivity may therefore suggest that they stem from physiological and pharmacological interactions more complex than those considered in the imaging literature so far.
GRANTS
This work was supported by National Institute of Neurological Disorders and Stroke Grant NS-006833.
DISCLOSURES
No conflicts of interest, financial or otherwise, are declared by the author(s).
AUTHOR CONTRIBUTIONS
Author contributions: M.M., M.L., and D.Z. analyzed data; M.M. and G.d. interpreted results of experiments; M.M. prepared figures; M.M. and G.d. drafted manuscript; M.M., L.L.-P., M.E.R., and G.d. edited and revised manuscript; A.Z.S., D.L.G., and M.E.R. conception and design of research; M.E.R. approved final version of manuscript.
ACKNOWLEDGMENTS
We thank Tom Conturo and Erbil Akbudak for development of MRI procedures. We thank Russ Hornbeck for help with data collection, preprocessing, and constructing the Default Mode Network mask. Mike D. Fox, Daniel S. Marcus, Timothy R. Olsen, Mohana Ramaratnam, and Kevin A. Archie are the developers of brainscape.org.
REFERENCES
- Adrian ED, Matthews BH. The Berger rhythm: potential changes from the occipital lobes in man. Brain 57: 355–385, 1934 [DOI] [PubMed] [Google Scholar]
- Beckmann CF, DeLuca M, Devlin JT, Smith SM. Investigations into resting-state connectivity using independent component analysis. Philos Trans R Soc Lond B Biol Sci 360: 1001–1013, 2005 [DOI] [PMC free article] [PubMed] [Google Scholar]
- Berger H. On the electroencephalogram of man I. Eur Arch Psychiatry Clin Neurosci 87: 527–570, 1929 [Google Scholar]
- Berger H. On the electroencephalogram of man II. Eur J Psychol Neurol 40: 160–179, 1930 [Google Scholar]
- Bianciardi M, Fukunaga M, van Gelderen P, Horovitz SG, de Zwart JA, Duyn JH. Modulation of spontaneous fMRI activity in human visual cortex by behavioral state. Neuroimage 45: 160–168, 2009 [DOI] [PMC free article] [PubMed] [Google Scholar]
- Biswal B, Yetkin FZ, Haughton VM, Hyde JS. Functional connectivity in the motor cortex of resting human brain using echo-planar MRI. Magn Reson Med 34: 537–541, 1995 [DOI] [PubMed] [Google Scholar]
- Boynton GM, Engel SA, Glover GH, Heeger DJ. Linear systems analysis of functional magnetic resonance imaging in human V1. J Neurosci 16: 4207–4221, 1996 [DOI] [PMC free article] [PubMed] [Google Scholar]
- Brandt T. How to see what you are looking for in fMRI and PET—or the crucial baseline condition. J Neurol 253: 551–555, 2006 [DOI] [PubMed] [Google Scholar]
- Braun AR, Balkin TJ, Wesensten NJ, Carson RE, Varga M, Baldwin P, Selbie S, Belensky G, Herscovitch P. Regional cerebral blood flow throughout the sleep-wake cycle: an H215O PET study. Brain 120: 1173–1197, 1997 [DOI] [PubMed] [Google Scholar]
- Braun AR, Balkin TJ, Wesenten NJ, Gwadry F, Carson RE, Varga M, Baldwin P, Belenky G, Herscovitch P. Dissociated pattern of activity in visual cortices and their projections during human rapid eye movement sleep. Science 279: 91–95, 1998 [DOI] [PubMed] [Google Scholar]
- Bremer F. Cerveau isolé et physiologie du sommeil. CR Soc Biol Paris 118: 1235–1241, 1935 [Google Scholar]
- Burton H, Sinclair RJ, McLaren DG. Cortical activity to vibrotactile stimulation: an fMRI study in blind and sighted individuals. Hum Brain Mapp 23: 210–228, 2004 [DOI] [PMC free article] [PubMed] [Google Scholar]
- Burton H, McLaren DG, Sinclair RJ. Reading embossed capital letters: an fMRI study in blind and sighted individuals. Hum Brain Mapp 27: 325–339, 2006 [DOI] [PMC free article] [PubMed] [Google Scholar]
- Chung JY, Yoon HW, Song MS, Park HW. Event related fMRI studies of voluntary and inhibited eye blinking using a time marker of EOG. Neurosci Lett 395: 196–200, 2006 [DOI] [PubMed] [Google Scholar]
- Corbetta M, Patel G, Shulman GL. The reorienting system of the human brain: from environment to theory of mind. Neuron 58: 306–324, 2008 [DOI] [PMC free article] [PubMed] [Google Scholar]
- Dang-Vu TT, Schabus M, Desseilles M, Sterpenich V, Bonjean M, Maquet P. Functional neuroimaging insights into the physiology of human sleep. Sleep 33: 1589–1603, 2010 [DOI] [PMC free article] [PubMed] [Google Scholar]
- Damoiseaux JS, Rombouts SA, Barkhof F, Scheltens P, Stam CJ, Smith SM, Beckmann CF. Consistent resting-state networks across healthy subjects. Proc Natl Acad Sci USA 103: 13848–13853, 2006 [DOI] [PMC free article] [PubMed] [Google Scholar]
- Damoiseaux JS, Greicius MD. Greater than the sum of its parts: a review of studies combining structural connectivity and resting-state functional connectivity. Brain Struct Funct 213: 525–533, 2009 [DOI] [PubMed] [Google Scholar]
- Devous MD, Trivedi MH, Rush AJ. Regional cerebral blood flow response to oral amphetamine challenge in healthy volunteers. J Nucl Med 42: 535–542, 2001 [PubMed] [Google Scholar]
- de Munck JC, Gonçalves SI, Huijboom L, Kuijer JP, Pouwels PJ, Heethaar RM, Lopes da Silva FH. The hemodynamic response of the alpha rhythm: an EEG/fMRI study. Neuroimage 35: 1142–1151, 2007 [DOI] [PubMed] [Google Scholar]
- Difrancesco MW, Holland SK, Szaflarski JP. Simultaneous EEG/functional magnetic resonance imaging at 4 Tesla: correlates of brain activity to spontaneous alpha rhythm during relaxation. J Clin Neurophysiol 25: 255–64, 2008 [DOI] [PMC free article] [PubMed] [Google Scholar]
- Feige B, Scheffler K, Esposito F, Di Salle F, Hennig J, Seifritz E. Cortical and subcortical correlates of electroencephalographic alpha rhythm modulation. J Neurophysiol 93: 2864–2872, 2005 [DOI] [PubMed] [Google Scholar]
- Forman SD, Cohen JD, Fitzgerald M, Eddy WF, Mintun MA, Noll DC. Improved assessment of significant activation in functional magnetic resonance imaging (fMRI): use of a cluster-size threshold. Magn Reson Med 33: 636–647, 1995 [DOI] [PubMed] [Google Scholar]
- Fox MD, Snyder AZ, Vincent JL, Corbetta M, Van Essen DC, Raichle ME. The human brain is intrinsically organized into dynamic, anticorrelated functional networks. Proc Natl Acad Sci USA 102: 9673–9678, 2005a [DOI] [PMC free article] [PubMed] [Google Scholar]
- Fox MD, Snyder AZ, Barch DM, Gusnard DA, Raichle ME. Transient BOLD responses at block transitions. Neuroimage 28: 956–966, 2005b [DOI] [PubMed] [Google Scholar]
- Friston KJ, Holmes AP, Poline JB, Grasby PJ, Williams SC, Frackowiak RS, Turner R. Analysis of fMRI time-series revisited. Neuroimage 2: 45–53, 1995 [DOI] [PubMed] [Google Scholar]
- Furey ML, Ricciardi E, Schapiro MB, Rapoport SI, Pietrini P. Cholinergic enhancement eliminates modulation of neural activity by task difficulty in the prefrontal cortex during working memory. J Cogn Neurosci 20: 1342–1353, 2008 [DOI] [PMC free article] [PubMed] [Google Scholar]
- Goadsby PJ, Duckworth JW. Low frequency stimulation of the locus coeruleus reduces regional cerebral blood flow in the spinalized cat. Brain Res 476: 71–77, 1989 [DOI] [PubMed] [Google Scholar]
- Goldman RI, Stern JM, Engel J, Jr, Cohen MS. Simultaneous EEG and fMRI of the alpha rhythm. Neuroreport 13: 2487–2492, 2002 [DOI] [PMC free article] [PubMed] [Google Scholar]
- Goncalves SI, de Munck JC, Pouwels PJ, Schoonhoven R, Kuijer JP, Maurits NM, Hoogduin JM, Van Someren EJ, Heethaar RM, Lopes da Silva FH. Correlating the alpha rhythm to BOLD using simultaneous EEG/fMRI: inter-subject variability. Neuroimage 30: 203–213, 2006 [DOI] [PubMed] [Google Scholar]
- Hobson JA. REM sleep and dreaming: towards a theory of protoconsciousness. Nat Rev Neurosci 10: 803–13, 2009 [DOI] [PubMed] [Google Scholar]
- Hughes SW, Crunelli V. Thalamic mechanisms of EEG alpha rhythms and their pathological implications. Neuroscientist 11: 357–72, 2005 [DOI] [PubMed] [Google Scholar]
- Jones EG. The Thalamus. New York: Cambridge Univ. Press, 2007 [Google Scholar]
- Kristiansen K, Courtois G. Rhythmic electrical activity from isolated cerebral cortex. Electroencephalogr Clin Neurophysiol 1: 265–272, 1949 [PubMed] [Google Scholar]
- Larson-Prior LJ, Power JD, Vincent JL, Nolan TS, Coalson RS, Zempel J, Snyder AZ, Schlaggar BL, Raichle ME, Petersen SE. Modulation of the brain's functional network architecture in the transition from wake to sleep. Prog Brain Res 193: 277–294, 2011 [DOI] [PMC free article] [PubMed] [Google Scholar]
- Laufs H, Holt JL, Elfont R, Krams M, Paul JS, Krakow K, Kleinschmidt A. Where the BOLD signal goes when alpha EEG leaves. Neuroimage 31: 1408–1418, 2006 [DOI] [PubMed] [Google Scholar]
- Lopes da Silva FH, Storm van Leeuwen W. The cortical source of the alpha rhythm. Neurosci Lett 6: 237–241, 1977 [DOI] [PubMed] [Google Scholar]
- Lopes da Silva FH, Vos JE, Mooibroek J, Van Rotterdam A. Relative contributions of intracortical and thalamo-cortical processes in the generation of alpha rhythms, revealed by partial coherence analysis. Electroencephalogr Clin Neurophysiol 50: 449–456, 1980 [DOI] [PubMed] [Google Scholar]
- Lowe MJ, Mock BJ, Sorenson JA. Functional connectivity in single and multislice echoplanar imaging using resting state fluctuations. Neuroimage 7: 119–132, 1998 [DOI] [PubMed] [Google Scholar]
- Madsen PL, Holm S, Vorstrup S, Friberg L, Lassen NA, Wildschiodtz G. Human regional cerebral blood flow during rapid-eye-movement sleep. J Cereb Blood Flow Metab 11: 502–507, 1991 [DOI] [PubMed] [Google Scholar]
- Mantini D, Perrucci MG, Del Gratta C, Romani GL, Corbetta M. Electrophysiological signatures of resting state networks in the human brain. Proc Natl Acad Sci USA 104: 13170–13175, 2007 [DOI] [PMC free article] [PubMed] [Google Scholar]
- Marx E, Stephan T, Nolte A, Deutschländer A, Seelos KC, Dieterich M, Brandt T. Eye closure in darkness animates sensory systems. Neuroimage 19: 924–934, 2003 [DOI] [PubMed] [Google Scholar]
- Marx E, Deutschländer A, Stephan T, Dieterich M, Wiesmann M, Brandt T. Eyes open and eyes closed as rest conditions: impact on brain activation patterns. Neuroimage 21: 1818–1824, 2004 [DOI] [PubMed] [Google Scholar]
- McAvoy MP, Ollinger JM, Buckner RL. Cluster size thresholds for assessment of significant activation in fMRI. Neuroimage 13: S198, 2001 [Google Scholar]
- McAvoy M, Larson-Prior L, Nolan TS, Vaishnavi SN, Raichle ME, d'Avossa G. Resting states affect spontaneous BOLD oscillations in sensory and paralimbic cortex. J Neurophysiol 100: 922–931, 2008 [DOI] [PMC free article] [PubMed] [Google Scholar]
- Mentis MJ, Sunderland T, Lai J, Connolly C, Krasuski J, Levine B, Friz J, Sobti S, Schapiro M, Rapoport SI. Muscarinic versus nicotinic modulation of a visual task: a PET study using drug probes. Neuropsychopharmacology 25: 555–564, 2001 [DOI] [PubMed] [Google Scholar]
- Moosmann M, Ritter P, Krastel I, Brink A, Thees S, Blankenburg F, Taskin B, Obrig H, Villringer A. Correlates of alpha rhythm in functional magnetic resonance imaging and near infared spectroscopy. Neuroimage 20: 145–158, 2003 [DOI] [PubMed] [Google Scholar]
- Moruzzi G, Magoun HW. Brain stem reticular formation and activation of the EEG. Electroencephalogr Clin Neurophysiol 1: 455–473, 1949 [PubMed] [Google Scholar]
- Ojemann JG, Akbudak E, Snyder AZ, McKinstry RC, Raichle ME, Conturo TE. Anatomic localization and quantitative analysis of gradient refocused echo-planar fMRI susceptibility artifacts. Neuroimage 6: 156–167, 1997 [DOI] [PubMed] [Google Scholar]
- Raichle ME, MacLeod AM, Snyder AZ, Powers WJ, Gusnard DA, Shulman GL. A default mode of brain function. Proc Natl Acad Sci USA 98: 676–682, 2001 [DOI] [PMC free article] [PubMed] [Google Scholar]
- Ramot M, Wilf M, Goldberg H, Weiss T, Deouell LY, Malach R. Coupling between spontaneous (resting state) fMRI fluctuations and human oculo-motor activity. Neuroimage 58: 213–225, 2011 [DOI] [PubMed] [Google Scholar]
- Rechtschaffen A, Kales A. (Editors) A Manual of Standardized Terminology, Techniques and Scoring System for Sleep Stages of Human Subjects. Bethesda, MD: National Institute of Neurological Diseases and Blindness, Neurological Information Network, 1968 [Google Scholar]
- Rowland DJ, Garbow JR, Laforest R, Snyder AZ. Registration of [18F]FDG microPET and small-animal MRI. Nucl Med Biol 6: 567–572, 2005 [DOI] [PubMed] [Google Scholar]
- Ruff CC, Blankenburg F, Bjoertomt O, Bestmann S, Freeman E, Haynes JD, Rees G, Josephs O, Deichmann R, Driver J. Concurrent TMS-fMRI and psychophysics reveal frontal influences on human retinotopic visual cortex. Curr Biol 16: 1479–1488, 2006 [DOI] [PubMed] [Google Scholar]
- Ruff CC, Bestmann S, Blankenburg F, Bjoertomt O, Josephs O, Weiskopf N, Deichmann R, Driver J. Distinct causal influences of parietal versus frontal areas on human visual cortex: evidence from concurrent TMS-fMRI. Cereb Cortex 18: 817–827, 2008 [DOI] [PMC free article] [PubMed] [Google Scholar]
- Schmid MC, Mrowka SW, Turchi J, Saunders RC, Wilke M, Peters AJ, Ye FQ, Leopold DA. Blindsight depends on the lateral geniculate nucleus. Nature 466: 373–377, 2010 [DOI] [PMC free article] [PubMed] [Google Scholar]
- Schölvinck ML, Maier A, Ye FQ, Duyn JH, Leopold DA. Neural basis of global resting-state fMRI activity. Proc Natl Acad Sci USA 107: 10238–10243, 2010 [DOI] [PMC free article] [PubMed] [Google Scholar]
- Schroeder CE, Lakatos P, Kajikawa Y, Partan S, Puce A. Neuronal oscillations and visual amplification of speech. Trends Cogn Sci 12: 106–113, 2008 [DOI] [PMC free article] [PubMed] [Google Scholar]
- Shires J, Joshi S, Basso MA. Shedding new light on the role of the basal ganglia-superior colliculus pathway in eye movements. Curr Opin Neurobiol 20: 717–725, 2010 [DOI] [PMC free article] [PubMed] [Google Scholar]
- Shulman GL, Fiez JA, Corbetta M, Buckner RL, Miezin FM, Raichle ME, Petersen SE. Common blood flow changes across visual tasks. II. Decreases in cerebral cortex. J Cogn Neurosci 9: 648–663, 1997 [DOI] [PubMed] [Google Scholar]
- Silber MH, Ancoli-Israel S, Bonnet MH, Chokroverty S, Grigg-Damberger MM, Hirshkowitz M, Kapen S, Keenan SA, Kryger MH, Penzel T, Pressman MR, Iber C. The visual scoring of sleep in adults. J Clin Sleep Med 3: 121–131, 2007 [PubMed] [Google Scholar]
- Silver MA, Shenhav A, D'Esposito Cholinergic enhancement reduces spread of visual responses in human early visual cortex. Neuron 60: 904–914, 2008 [DOI] [PMC free article] [PubMed] [Google Scholar]
- Smith SM, Fox PT, Miller KL, Glahn DC, Fox PM, Mackay CE, Filippini N, Watkins KE, Toro R, Laird AR, Beckmann CF. Correspondence of the brain's functional architecture during activation and rest. Proc Natl Acad Sci USA 106: 13040–13045, 2009 [DOI] [PMC free article] [PubMed] [Google Scholar]
- Swartz BE, Kovalik E, Thomas K, Torgersen D, Mandelkern MA. The effects of an alpha-2 adrenergic agonist, guanfacine, on rCBF in human cortex in normal controls and subjects with focal epilepsy. Neuropsychopharmacology 23: 263–275, 2000 [DOI] [PubMed] [Google Scholar]
- Talairach J, Tournoux P. Co-planar Stereotaxic Atlas of the Human Brain. New York: Thieme, 1988 [Google Scholar]
- Tse PU, Baumgartner FJ, Greenlee MW. Event-related functional MRI of cortical activity evoked by microsaccades, small visually-guided saccades, and eyeblinks in human visual cortex. Neuroimage 49: 805–816, 2010 [DOI] [PMC free article] [PubMed] [Google Scholar]
- Tyszka JM, Kennedy DP, Adolphs R, Paul LK. Intact bilateral resting-state networks in the absence of the corpus callosum. J Neurosci 31: 15154–15162, 2011 [DOI] [PMC free article] [PubMed] [Google Scholar]
- Uludaǧ K, Dubowitz DJ, Yoder EJ, Restom K, Liu TT, Buxton RB. Coupling of cerebral blood flow and oxygen consumption during physiological activation and deactivation measured with fMRI. Neuroimage 23: 148–155, 2004 [DOI] [PubMed] [Google Scholar]
- Utter AA, Basso MA. The basal ganglia: an overview of circuits and function. Neurosci Biobehav Rev 32: 333–342 2008 [DOI] [PubMed] [Google Scholar]
- Vincent JL, Larson-Prior LJ, Zempel JM, Snyder AZ. Moving GLM ballistocardiogram artifact reduction for EEG acquired simultaneously with fMRI. Clin Neurophysiol 118: 981–998, 2007 [DOI] [PubMed] [Google Scholar]
- Watson BO, MacLean JN, Yuste R. Up states protect ongoing cortical activity from thalamic inputs. PLoS One 3: 1–15, 2008 [DOI] [PMC free article] [PubMed] [Google Scholar]
- Yang H, Long XY, Yang Y, Yan H, Zhu CZ, Zhou XP, Zang YF, Gong QY. Amplitude of low frequency fluctuation within visual areas revealed by resting-state functional MRI. Neuroimage 36: 144–152, 2007 [DOI] [PubMed] [Google Scholar]
- Yoon HW, Chung JY, Song MS, Park HW. Neural correlates of eye blinking; improved by simultaneous fMRI and EOG measurement. Neurosci Lett 381: 26–30, 2005 [DOI] [PubMed] [Google Scholar]
- Zou Q, Long X, Zuo X, Yan C, Zhu C, Yang Y, Liu D, He Y, Zang Y. Functional connectivity between the thalamus and visual cortex under eyes closed and eyes open conditions: a resting-state fMRI study. Hum Brain Mapp 30: 3066–3078, 2009 [DOI] [PMC free article] [PubMed] [Google Scholar]