

Abstract
In the presence of multiple, spatially separated sound sources, the binaural cues used for sound localization in the horizontal plane become distorted from the cues from each sound in isolation, yet localization in everyday multisource acoustic environments remains robust. We examined changes in the azimuth tuning functions of inferior colliculus (IC) neurons in unanesthetized rabbits to a target broadband noise when a concurrent broadband noise interferer was presented at different locations in virtual acoustic space. The presence of an interferer generally degraded sensitivity to target azimuth and distorted the shape of the tuning function, yet most neurons remained significantly sensitive to target azimuth and maintained tuning function shapes somewhat similar to those for the target alone. Using binaural cue manipulations in virtual acoustic space, we found that single-source tuning functions of neurons with high best frequencies (BFs) were primarily determined by interaural level differences (ILDs) or monaural level, with a small influence of interaural time differences (ITDs) in some neurons. However, with a centrally located interferer, the tuning functions of most high-BF neurons were strongly influenced by ITDs as well as ILDs. Model-based analysis showed that the shapes of these tuning functions were in part produced by decorrelation of the left and right cochlea-induced envelopes that occurs with source separation. The strong influence of ITD on the tuning functions of high-BF neurons poses a challenge to the “duplex theory” of sound localization and suggests that ITD may be important for localizing high-frequency sounds in multisource environments.
Keywords: azimuth, interaural time difference, interaural level difference, inferior colliculus, rabbit
in everyday acoustic environments, we are often engaged in attending to, identifying, and localizing a sound source of interest in the midst of concurrent, interfering sounds coming from various spatial locations. The acoustic cues used to localize single sources in simple, anechoic space are well known; for localization in the horizontal plane, ITDs dominate perceived location when low frequencies are present and ILDs dominate when only high frequencies are present (Macpherson and Middlebrooks 2002; Wightman and Kistler 1992). For a target sound source in the presence of a spatially separated interferer, both binaural cues become distorted from their target-alone values and fluctuate moment by moment (Fig. 1). How humans and animals negotiate these distorted binaural cues to separately localize distinct sources is unclear.
Fig. 1.
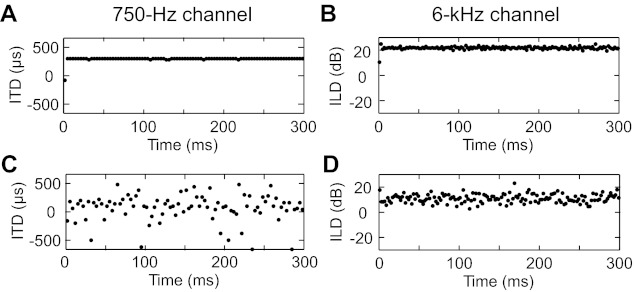
Instantaneous interaural time difference (ITD) and interaural level difference (ILD) computed over a sliding 2-ms window. Broadband noise was bandpass filtered with a center frequency of 750 Hz for ITD and 6 kHz for ILD. ITD was computed as the delay associated with the peak of the normalized interaural correlation function. ILD was computed as the ratio of the Hilbert envelopes of the left and right filtered waveforms. A and B: ITD and ILD, respectively, for a single sound source at +90° azimuth. C and D: ITD and ILD, respectively, for 2 concurrent sources of equal intensity at 0° and 90°.
Ethologically relevant sounds, such as speech and animal vocalizations, are spectrotemporally sparse such that at a given moment in time, the energy in some frequency channels may largely originate from a single source even though multiple sources are present (Cooke 2006). One possible strategy to localize multiple sources is to avoid mixed binaural cues by using “glimpses” of one sound in relative isolation from others; however, this strategy would still need an indicator of which glimpses contain mixed binaural cues and which contain single-source cues (Faller and Merimaa 2004). It is therefore important to compare and contrast the neural encoding of single vs. multiple sources in conditions when the sources overlap in time and frequency.
In the present study, we investigated the challenging case when mixed binaural cues cannot be avoided; both target and interferer sources were broadband noises uncorrelated with each other and therefore nearly identical spectrally and temporally. Psychophysical evidence shows that such concurrent noises (presented at equal intensity) can be distinguished from a single source when separated by as little as 15° (Best et al. 2004) and can be individually localized as two sources when separated by 90° azimuth (Damaske 1967/1968). Localization accuracy for a broadband noise source in the presence of another broadband noise improves when the onset of one stimulus precedes the other (Braasch and Hartung 2002). Reasonably accurate localization of more than two noise sources is even possible when the sources are turned on sequentially (Brungart and Simpson 2005).
We examined how azimuth tuning functions of IC neurons in unanesthetized rabbits are altered by the presence of a fixed interferer. This species can discriminate ITDs (Ebert et al. 2008) and demonstrates a binaural masking level difference comparable to humans (Early et al. 2001). The IC is a nearly obligatory station along the ascending auditory pathway and receives inputs from brain stem nuclei, where neurons are sensitive to ITDs and ILDs, as well as monaural spectral cues (Winer and Schreiner 2005). Although the precise timing of spikes in some IC neurons can enhance the neural representation of binaural localization cues, the majority of information regarding ITD and ILD in most IC neurons is encoded by their firing rates (Chase and Young 2006). We therefore hypothesized that the pattern of rate responses across the population of IC neurons encodes the location of a target broadband noise in the presence of a spatially separated, interfering broadband noise.
METHODS
Surgical preparation.
Surgical methods for the unanesthetized Dutch-belted rabbit (Oryctolagus cuniculus) experimental preparation were as described previously (Devore and Delgutte 2010). All surgical and recording procedures were approved by the Institutional Animal Care and Use Committees (IACUCs) of the Massachusetts Eye and Ear Infirmary and the Massachusetts Institute of Technology. Experiments were performed on two female rabbits.
Briefly, an initial aseptic surgery was performed under anesthesia to mount a stainless steel cylinder and a brass head bar to the skull. After recovery, animals were habituated to the experimental setup for 1–2 wk. A second aseptic surgery was performed under anesthesia to make a small craniotomy (∼3 mm in diameter) inside the cylinder over the occipital cortex and to create custom ear molds.
Virtual acoustic space stimuli.
Sound stimuli presented to the two ears through pinna inserts were convolved with directional impulse responses to give the sound directional characteristics appropriate for a rabbit. We used simplified directional impulse responses derived from rabbit head-related transfer functions (HRTFs) that captured the general covariance of ITD and ILD across frequency and azimuth specific to rabbits.
We recorded acoustic impulse responses in the ear canals of a cadaver rabbit for free-field sounds presented in an anechoic chamber, using the setup and procedure described by Koka et al. (2008). These measurements were performed at the University of Colorado Medical School and approved by that institution's IACUC. The pinnae were positioned erect using thin wire. Impulse responses were measured by a probe tube microphone inserted through a hole (made with a 14-gauge needle) in the posterior aspect of the pinna with the tip near the tympanic membrane. Stimuli consisted of 11th-order maximum-length sequences (Rife and Vanderkooy 1989) of 20-ms duration repeated without interruption 128 times at a sampling rate of 97.7 kHz. These stimuli were presented through a loudspeaker located 1 m from the rabbit head. Impulse responses were measured for 325 locations in the frontal hemisphere, spanning azimuths from −90° to +90° (positive sign indicates right) and elevations from −45° to +90° (positive sign indicates up) in 7.5° steps. Separate impulse responses were also measured for correction of speaker and microphone filtering by placing probe tubes, in the absence of the animal, where the center of the head would be located. The HRTFs were derived by dividing the Fourier transform of each impulse response by the Fourier transform of the speaker calibration response. We then computed the magnitude directional transfer functions (DTFs) by dividing the magnitude spectra of each HRTF by the mean magnitude spectrum over all spatial locations for each ear (Middlebrooks and Green 1990). This normalization removes the large, nondirectional ear canal resonance (Middlebrooks et al. 1989), leaving the components of the HRTFs that are directionally dependent.
The monaural and interaural spectral shapes of DTFs at high frequencies differed substantially across azimuths and contained peaks and notches presumably specific to the individual animal they were recorded from. However, azimuth perception by human subjects is influenced primarily by the gross ILD, and not the detailed interaural level spectrum or the monaural spectra (Macpherson and Middlebrooks 2002). Moreover, psychophysical results suggest that spectral cues are not used in the perceptual segregation of two concurrent, spatially separated broadband noises; Best et al. (2004) found that the separation of such concurrent sources could not be detected when the sources had identical ITDs and ILDs but different spectral cues. To remove the unwanted effects of an individualized DTF applied to a different animal, we performed a principal components analysis on the log magnitude spectra of our 650 DTFs from 0.5 to 25 kHz. Human subjects have been shown to judge azimuth accurately with simplified DTFs constructed from only the first principal component of the complete DTFs; these simplified DTFs provide information primarily on the gross ILD across frequency (Kistler and Wightman 1992). The first principal component accounted for 77% of the variance in the log magnitude spectra across spatial locations. The first principal component, p1(f), where f is frequency, weighted appropriately at each location, was used to specify the magnitude spectra of our directional filters (Fig. 2A). We focused on creating directional filters for azimuths spanning −90° to +90° in the horizontal plane. ILD weights were derived as the difference between left and right first principal component weights at each azimuth. The dependence of ILD weight on azimuth θ was fit by the sinusoid wmax sin θ, which minimized the sum of squared errors (Fig. 2B). This function was used to assign a symmetric weight to the basis function at each azimuth for the left and right sides; i.e., the left and right log magnitude spectra of our directional filters were log |DL(θ, f)| = −½wmax p1(f) sin θ and log |DR(θ, f)| = ½wmax p1(f) sin θ. The magnitude spectra of the left and right directional filters for +90° are shown in Fig. 2A.
Fig. 2.

Directional filters derived from principal components analysis of rabbit directional transfer functions. A: magnitude spectra of the left (dashed line) and right (solid line) directional filters at +90° (positive sign indicates right). Magnitude spectra have the shape of the first principal component basis function, p1(f). B: ILD weight of the first principal component vs. azimuth, with sinusoidal fit (curve). C: ITD at 1.5 kHz between left and right rabbit head-related transfer functions, with sinusoidal fit (curve). D and E: ILDs and ITDs, respectively, across frequency for directional filters used in the present study. From top to bottom, directional filters correspond to +90°, +75°, …, −90° azimuth.
The azimuth dependence of high-frequency ITD (measured at 1.5 kHz) between left and right HRTFs was fit by a sinusoid, τmax sin θ, with the fit value of τmax = 275 μs (Fig. 2C). To avoid the possibility of measurement errors due to inadequate sound absorption in the anechoic chamber at low frequencies, we modeled the low-frequency dependence of ITDs as an exponential function given by 1 + ½e−f/fd with fd = 400 Hz. This function smoothly transitions between the high-frequency ITD and the low-frequency limit of the spherical head model (Kuhn 1987). We then set the phase of the left directional filters to zero and that of the right directional filters so as to obtain the appropriate ITD at each azimuth; i.e., the phase spectra of the left and right directional filters were ∢DL(θ, f) = 0 and ∢DR(θ, f) = 2πfτmax(1 + ½e−f/fd) sin θ. The magnitude and phase of the DTF described above were combined using an inverse Fourier transform to create a pair of directional impulse responses for each azimuth. The frequency-dependent ILDs and ITDs of impulse responses at different azimuths are shown in Fig. 2, D and E, and are broadly consistent with the frequency-dependence, azimuth-dependence, and maximal values of ILD and ITD in a previous report of rabbit HRTFs (Kim et al. 2010).
Modified directional impulse responses were also created to achieve independent control over ITD and ILD. First, three sets of directional impulse responses were created where phase was allowed to vary naturally with azimuth while magnitude remained fixed at the value corresponding to 0°, +90°, or −90° (“ITD-only” filters; positive sign indicates contralateral). In this condition ITD varies with azimuth while ILD and monaural levels remain constant. Next, three other sets of directional impulse responses were created where magnitude was allowed to vary naturally with azimuth while phase remained fixed at the value corresponding to 0°, +90°, or −90° (“fixed-ITD” filters). In this condition both ILD and monaural levels vary with azimuth while ITD remains constant. The overall spectral tilt of these magnitude spectra also varies somewhat with azimuth, since left and right filters are both scaled versions of p1(f), which itself has a pronounced tilt (Fig. 2A); however, as mentioned above, the precise shapes of these spectra do not strongly influence perception of azimuth in humans.
Experimental procedures.
During each recording session, animals were wrapped in a body blanket and head-fixed in the experimental apparatus for typically 1.5–2.5 h while being monitored over a closed-circuit video system. If the animal showed signs of distress, the experiment was terminated immediately.
Stimuli were created in MATLAB (MathWorks), digitally filtered to correct for the transfer function of the acoustic assembly, and converted to analog signals by a 24-bit digital-to-analog converter (National Instruments PXI-4461) at a sampling rate of 50 kHz. The acoustic signal was produced by a pair of speakers (Beyer-Dynamic DT-48) attached to sound tubes running through custom-fitted ear molds. A probe-tube microphone (Etymotic ER-7C) measured acoustic pressure in the ear canal at the end of the sound delivery tube. At the beginning of each recording session, we measured sound pressure in each ear in response to a broadband chirp stimulus and created inverse filters over the range of 0.1–18 kHz to correct for filtering by the acoustic assembly. This range covers frequencies to which rabbits are most sensitive (Heffner and Masterton 1980).
Single neurons were isolated using epoxy-insulated tungsten electrodes (A-M Systems) with 1-kHz impedances of ∼2–4 MΩ. The neural signal was amplified (Axon Instruments Axoprobe-1A), bandpass filtered from 1–3 kHz (Ithaco 1201), sampled at 100 kHz (National Instruments PXI-6123), and fed to a software spike detector triggering on level crossings. The electrode was lowered through occipital cortex into the IC. For this approach, penetration into the IC coincided with a large, sudden increase in background entrainment to broadband noise bursts, usually at a depth of ∼6–7 mm below the dural surface. The majority of recordings were likely from the central nucleus of the IC as inferred from the orderly sequence from low to high best frequencies with advancement of the electrode and a nonhabituating response across trials (Aitkin et al. 1975). In a previous experiment using the same experimental preparation on a different rabbit, electrolytic lesions were made at two sites where azimuth-sensitive responses to broadband noise were recorded; subsequent histological analysis recovered one of these sites, which was located within the central nucleus of the IC.
The search stimulus was a binaural broadband noise burst at 60 dB SPL alternating between ITDs of 0 and +500 μs (where a positive ITD indicates contralateral-leading sound). When a single neuron was well isolated, its noise threshold was determined from a rate-level function for broadband noise at 0 ITD (and sometimes +300 or +500 μs ITD). A single neuron could generally be held for ∼5–25 min. Near the end of recording from a neuron, contralateral frequency tuning was measured either by an automatic threshold tracking procedure (Kiang and Moxon 1974) to determine the characteristic frequency (CF; the frequency yielding the lowest threshold) or by a frequency sequence of iso-level tone pips to determine best frequency (BF; the frequency that evokes the strongest firing rate). Since neighboring neurons in the IC have similar frequency tuning (Seshagiri and Delgutte 2007), frequency tuning was sometimes determined from the background activity after contact with a neuron was lost. The distinction between CF and BF is not of critical importance in the present study, and for simplicity we refer to both as “BF.”
Characterization of target azimuth tuning functions in the presence of an interferer.
Azimuth tuning functions (mean firing rate as a function of azimuth) were determined for a target source that varied in azimuth in the presence of a fixed-location interferer. Both target and interferer were reproducible broadband noise bursts (300 ms followed by 200 ms of silence, 4 ms on/off raised cosine ramp), uncorrelated with each other and each presented 20 dB above the noise threshold. The target was presented from −90° to +90° azimuth in 15° increments. The interferer was fixed at 0°, −90°, or +90° or was co-located with the target to produce a single source with equal overall intensity (23 dB re. threshold) as in the separated-interferer conditions. All 13 × 4 target/interferer combinations were presented in pseudorandom order using 3–10 repetitions (most had 8 repetitions). Figure 3 shows the time course of spike responses of one IC neuron to the concurrent stimuli. Mean firing rate was computed over the 300-ms stimulus window, shifted by 10 ms to account for response latency. Spontaneous firing rate was estimated over the last 100 ms of silence between stimuli. Further recordings from a neuron were discontinued if the firing rate did not vary by at least 50% of the maximum rate across all target/interferer combinations.
Fig. 3.

Target azimuth tuning functions from 1 IC neuron, with best frequency (BF) = 7.88 kHz. A–D: raster plots of spike times grouped by location of interferer: co-located, +90°, 0°, and −90°, respectively (positive sign indicates contralateral). Each raster band shows the spike times over multiple repetitions at 1 target azimuth, with each band alternately shaded for clarity. Inset in each panel shows the target azimuth tuning function for the associated interferer location. Target azimuth tuning functions for this neuron overlaid across all interferer conditions are shown in Fig. 4E.
For a majority of neurons, azimuth tuning functions were also measured under manipulated binaural cue conditions applied to both the target and interferer. As described above, in the “ITD-only” condition, ITD was allowed to vary naturally with azimuth while the magnitude spectra were fixed at the values corresponding to 0°. In the “fixed-ITD” condition, magnitude spectra (and therefore ILD) were allowed to vary naturally while ITD was fixed to its value at 0°. For each of the ITD-only and fixed-ITD cases, the target was again presented from −90° to +90° in 15° increments, while the interferer was either fixed at 0° or co-located with the target (single source). All 13 × 2 × 2 target/interferer/cue combinations were presented in pseudorandom order. For a smaller number of neurons, binaural cue manipulations were tested with lateral interferers (±90°). A total of 13 × 2 × 2 target/interferer/cue combinations were again presented, but with different interferer/cue conditions: with an interferer at either +90° or −90° and using either ITD-only or fixed-ITD filters. In these manipulations, the fixed binaural cue was set to the value corresponding to the interferer location. For example, for the ITD-only condition with a +90° interferer, the left and right monaural spectra were fixed to their values at +90°, and therefore the ILD was fixed to its value at +90° as well.
Characterization of tuning to ITD and interaural correlation.
ITD tuning was assessed by measuring firing rate as a function of ITD (±1,000 μs in 100-μs steps presented in random order) for broadband noise bursts (300 ms on, 200 ms off; 8 repetitions) at 20 dB above threshold. An additional ITD tuning function was measured with the waveform polarity reversed in one ear to determine if neurons were tuned to fine-structure and/or envelope ITD (Joris 2003). The best delay (BD) was defined as the ITD that elicited the maximum firing rate in the same-polarity condition.
Sensitivity to interaural correlation was assessed by measuring firing rate to broadband noise at 20 dB above threshold as a function of its interaural cross-correlation coefficient (IACC) (300 ms on, 200 ms off; 10 repetitions; presented in random order). Here, IACC refers to the value of the normalized interaural cross-correlation function (IACF) at 0 ITD. We used a Gramm-Schmidt orthogonalization procedure to create 9 pairs of broadband noise bursts with prescribed IACCs between 0 and 1 (Culling et al. 2001; Licklider and Dzendolet 1948). These “broadband” IACCs were calculated from the broadband left and right sound pressure waveforms at the eardrums, as opposed to “neuron-specific” IACCs (described below) calculated from an approximation of peripherally filtered waveforms.
Data analysis.
To gain confidence that data came from single neurons, all spikes were subjected to off-line analysis of the interspike intervals. We excluded data for which more than 1% of interspike intervals were shorter than a presumed 0.75-ms refractory period.
The sensitivity of firing rate to target azimuth was quantified using a “directional signal-to-noise ratio” (SNR), modified from Hancock et al. (2010). In an ANOVA of rate-azimuth data where each target azimuth is a different group, the directional SNR is the ratio of the between-group sum of squares (representing the variability in the mean firing rates due to changes in azimuth) to the within-group sum of squares (representing the variability in the firing rate over multiple repetitions of the same stimulus). A larger directional SNR indicates a higher sensitivity of firing rate to target azimuth. This metric takes into account the degrading effect of neural noise on azimuth sensitivity and makes no assumption of the shape of the azimuth tuning function. Since the metric is based on ANOVA, it assumes that most information about azimuth can be accounted for by second-order statistics and requires fewer stimulus repetitions to be reliably estimated than mutual information, which depends on the entire distribution of spike counts. Statistical significance of the dependence of firing rate on azimuth was determined using an ANOVA F-test.
The numerator and denominator of the directional SNR can be expressed as “signal” and “noise” terms, SNR = SSsignal/SSnoise. A change in directional SNR between any two conditions (e.g., 2 interferer locations) can be expressed as
Following rearrangement of terms and log transformation, the change in directional SNR can be expressed as the difference between the change in the signal and the change in noise,
This equation was used in a linear regression to determine if observed changes in directional SNR across interferer conditions were mainly caused by changes in the signal or noise terms.
In the presence of a central (0°) interferer, we often saw a sharp peak or notch in the azimuth tuning function at 0° (e.g., Fig. 3C), demonstrating a pronounced rate suppression or enhancement as the target was separated from the interferer. We characterized whether the rate changed significantly in the same direction when the target was moved to +15° or −15° from being co-located with the interferer at 0°. Rate suppression was said to occur when both the mean rates for targets at ±15° were significantly smaller than the mean rate for a target co-located with the 0° interferer [Tukey's honestly significant difference (HSD) test]. Similarly, rate enhancement was said to occur when both the mean rates at ±15° were significantly larger than the mean rate at 0°. For data that showed significant suppression or enhancement, the degree of enhancement or suppression was quantified by the “central enhancement/suppression (E/S) index”, defined as ES = 1/rmax{r(0) − ½[r(+15) + r(−15)]}, where r(θ) is the rate at target azimuth θ with a central interferer and rmax = max{r(−15), r(0), r(+15)}. For neurons that did not exhibit significant rate enhancement or suppression, ES was set to 0. The central E/S index can take values from −1 to +1, with positive values indicating rate suppression and negative values indicating rate enhancement.
All hypothesis tests regarding directional SNRs were performed on log-transformed data, and all tests regarding correlation coefficients were performed on tangent-transformed data; these transformations were done to give the data approximately normal distributions to meet the assumptions of parametric hypothesis tests. Statements of statistical inference refer to the transformed data, as presented in the figures.
Interaural cross-correlation model.
An interaural cross-correlation model was used to predict firing rate for a target with a central interferer in selected high-BF neurons. In the model, left and right sound waveforms were first bandpass filtered (Butterworth) with center frequency equal to the neuron's BF and bandwidth based on median Q10 values of rabbit auditory nerve data for that BF (Borg et al. 1988). The normalized IACF was computed from the Hilbert envelopes of the left and right filtered waveforms [without subtracting the mean (Trahiotis et al. 2005)], and the output of the model, which we termed the “neuron-specific” IACC, was the value of this IACF at a delay equal to the neuron's BD. Stimuli with different broadband IACCs (as described above) were input into the model to obtain a corresponding neuron-specific IACC. The neuron's rate-vs.-broadband IACC function could therefore be remapped into a rate-vs.-neuron-specific IACC function. To predict firing rate for a particular target/interferer combination, the neuron-specific IACC was computed for the stimulus mixture, and the rate was linearly interpolated from the rate-vs.-neuron-specific IACC function.
RESULTS
We studied the effects of a concurrent, spatially separated interferer on the rate encoding of target sound azimuth in neurons in the IC of unanesthetized rabbits. Our aims were to characterize how interferers at different spatial locations influence both the sensitivity to target azimuth and shapes of azimuth tuning functions for IC neurons, and to determine the contribution from ITDs and ILDs to these effects.
We report data from 78 single neurons from the right IC of two unanesthetized female rabbits with BFs spanning 0.2–17 kHz. All neurons had firing rates that were modulated by at least 50% of the maximum rate over all combinations of target and interferer azimuths in at least one interferer condition; neurons with unmodulated firing rates were infrequently encountered (∼5 neurons) and not studied further.
Target azimuth sensitivity with a concurrent interferer.
We measured the azimuth tuning functions to a target both for a single source and in the presence of an interferer at each of three locations: central (0°), ipsilateral (−90°), and contralateral (+90°). Both target and interferer sounds were broadband noise bursts, uncorrelated with each other, with simultaneous onsets and offsets; therefore, the target and interferer had nearly identical spectral and temporal characteristics.
Examples of target azimuth tuning functions for single sources and with interferers at different locations are shown in Fig. 4, ordered by increasing BF. Because overall stimulus levels at the source were matched between single-source and interferer conditions, the single-source and two-source tuning functions have the same mean firing rates at −90°, 0°, and +90° for the ipsilateral, central, and contralateral interferers, respectively. For single-source azimuth tuning functions (e.g., solid black lines in Fig. 4), the majority of neurons had best azimuths (the azimuth that elicits the maximum rate) between 45° and 90°, consistent with a previous study of IC neurons in awake rabbits (Kuwada et al. 2011). Therefore, neurons were generally more excited at contralateral azimuths than at ipsilateral azimuths, although some neurons showed little or no tuning to single-source azimuth (e.g., Fig. 4C). In all neurons in Fig. 4 for which the single-source firing rate clearly depended on azimuth (Fig. 4, A, B, and D–F), the range of firing rates encoding target azimuth tended to decrease when an interferer was introduced relative to the single-source condition. The neurons tuned to higher frequencies also demonstrated a pronounced notch (Fig. 4, C and F) or peak (Fig. 4, D and E) in firing rate at 0° with a central interferer (red dashed line). The characteristics of these example tuning functions are discussed further below.
Fig. 4.
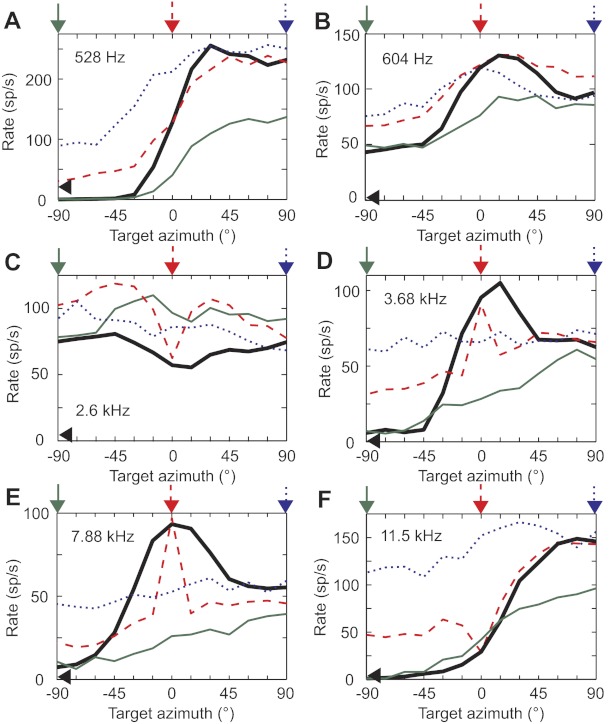
Target azimuth tuning functions in the presence of an interferer. A–F: target azimuth tuning functions of 6 neurons for a single source (thick black line) and in the presence of a contralateral (blue dotted line), central (red dashed line), or ipsilateral interferer (green solid line). Arrows above each panel indicate the interferer locations. Black arrowhead on the y-axis indicates the neuron's spontaneous rate. Frequency value in each panel indicates the neuron's BF. Directional signal-to-noise ratios (SNRs) for each neuron are as folllows (single source/contralateral/central/ipsilateral): 8.0/3.9/9.0/21 (A), 13/2.9/7.8/7.1 (B), 0.32/0.37/1.1/0.67 (C), 12/0.19/2.5/7.7 (D), 15/0.66/8.2/2.2 (E), 6.4/0.29/2.7/4.0 (F). sp/s, Spikes/s.
We used directional SNR to quantify the sensitivity of firing rate to target azimuth (directional SNRs of example neurons are given in the legend of Fig. 4). A large majority (73/78) of neurons were directionally sensitive to single sources (F-test, P < 0.001) (Fig. 5, A–C, x-axis values). Of the 7 neurons with directional SNRs <1, only 2 had statistically significant directional sensitivity; we therefore defined all neurons with directional SNRs <1 as “nondirectional” and the rest as “directional.” Directional SNRs of nondirectional neurons (Fig. 5, A–C, filled squares) tended be slightly larger with an interferer compared with the single-source condition (paired t-tests, P < 0.001, P = 0.04, and P = 0.02 for ipsilateral, central, and contralateral interferers, respectively) but largely remained ≤1 (Fig. 5, A–C, shaded area). By our selection criteria, nondirectional neurons had firing rates that were significantly dependent on target azimuth (F-test, P < 0.001) for at least one interferer location (e.g., Fig. 4C, red dashed line).
Fig. 5.
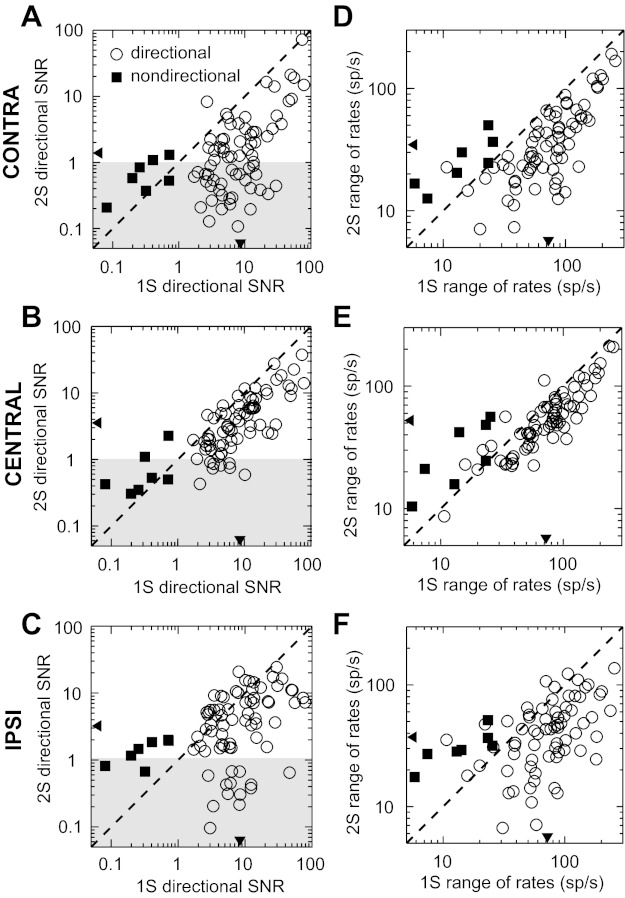
Sensitivity to target azimuth in the presence of an interferer. A–C: scatterplot of single-source directional SNR vs. 2-source directional SNR for the contralateral, central, and ipsilateral interferers, respectively. Shaded area indicates a 2-source directional SNR < 1. D–F: scatterplots of the range of mean firing rates in the single-source azimuth tuning function vs. those in the 2-source tuning function with contralateral, central, and ipsilateral interferers, respectively. One outlier with a small 2-source range of rates was omitted from F. Circles indicate directional neurons (n = 71), and squares indicate nondirectional neurons (n = 7). Triangles on the x- and y-axes indicate the geometric means of the data from directional neurons. Dashed lines indicate unity. 1S, single source; 2S, 2-source.
Directional SNRs of directional neurons (Fig. 5, A–C, open circles) typically decreased with an interferer compared with the single-source condition (paired t-tests, all P < 0.001, n = 71). The mean directional SNR was 8.5 in the single-source condition compared with 1.4, 3.5, and 3.2 for the contralateral, central, and ipsilateral interferer conditions, respectively. (In this and all other statistical tests involving directional SNRs, “mean” refers to the geometric mean.) A repeated-measures ANOVA found a significant effect of interferer location on the change in directional SNR between single-source and two-source conditions for directional neurons [F(2,140) = 18.22, P < 0.001], with the decrease in the mean directional SNR for the contralateral interferer being larger than the decrease for the central and ipsilateral interferers (paired t-tests with Bonferroni correction, both P < 0.001). The greater decrease in directional SNR for a contralateral interferer (in a sense, the greater masking of target azimuth by a contralateral interferer) is consistent with the majority of neurons having a preference for contralateral azimuths; in this condition the interferer is placed in the most responsive part of the tuning function. Although directional SNRs were decreased with an interferer, the majority of directional neurons maintained a significant dependence of their firing rates on target azimuth (F-test, P < 0.001) [contralateral interferer: 76% (54/71); central: 100% (71/71); ipsilateral: 87% (62/71); approximated by unshaded area in Fig. 5, A–C].
Directional neurons for which frequency tuning information was available were split into a lower BF group (BF ≤ 1.5 kHz, n = 14) and higher BF group (BF > 1.5 kHz, n = 46) with the 1.5-kHz cutoff chosen to separate neurons sensitive to fine-structure ITD from those sensitive to envelope ITD (near the border found in Devore and Delgutte 2010). A multivariate ANOVA found a significant interaction of frequency tuning and interferer location on the change in directional SNR between single-source and two-source conditions (Wilk's lambda test, P = 0.035). Specifically, the change in directional SNRs was only significantly different between frequency-tuning groups for the contralateral interferer (unpaired t-test with Bonferroni correction, P = 0.003), for which the mean directional SNR was smaller for higher BF neurons than for lower BF neurons. The additional degrading effect of a contralateral interferer on directional SNRs observed in the full data set is therefore largely conferred by higher BF neurons.
The reduction in directional SNR with an interferer could come from either a decrease in the range of mean firing rates available to encode azimuth or an increase in the firing rate variability (the neural noise), or both (see methods). A linear regression using only the change in mean firing rates between single-source and two-source conditions accounted for 88% of the variance in the change in directional SNR with an interferer (n = 234 over all 3 interferer conditions). Therefore, the reduction in directional SNR was largely caused by a decrease in the range of mean firing rates available to encode azimuth rather than by an increase in neural noise. To further illustrate this point, Fig. 5, D–F, shows scatterplots of the range of mean firing rates across azimuths in the two-source condition against the range of mean firing rates in the single-source condition separately for each interferer location. Consistent with results for the directional SNR, the mean range of firing rates among directional neurons was significantly lower in each interferer condition than in the single-source condition (paired t-tests, all P < 0.001). This decrease in the range of mean firing rates is apparent in the tuning function examples in Fig. 4, A, B, and D–F. The range of firing rates of azimuth tuning functions in both anechoic and reverberant conditions has been shown to be highly correlated with the information transfer between azimuth and firing rate for IC neurons (Devore and Delgutte 2010; “information transfer” is proportional to mutual information); therefore, it is likely that the introduction of an interferer generally decreases the information available from firing rates about target azimuth.
In summary, target azimuth sensitivity is generally degraded among directional neurons in the presence of an interferer. This degradation is largely attributable to a decrease in the range of mean firing rates available to encode azimuth and is generally consistent across the extent of the tonotopic axis and interferer locations, except the degradation is greater among higher BF neurons with a contralateral interferer. Despite this degradation, the firing rates of the majority of directional neurons still depend significantly on target azimuth in the presence of an interferer.
Shape of target azimuth tuning functions with a concurrent interferer.
The directional SNR characterizes the neural sensitivity to azimuth regardless of the shape of the tuning function. To investigate changes in shape, we quantified the similarity of the shapes between target azimuth tuning functions in the presence and the absence of an interferer using the Pearson product-moment correlation coefficient. Since the correlation coefficient is invariant to scaling, the directional SNR and the correlation coefficient are complementary measures describing changes in azimuth tuning caused by an interferer.
Figure 6 shows the distribution of correlations of tuning functions between single-source and two-source conditions for each interferer location. Nondirectional neurons (n = 7) had near-zero or even negative correlations between single-source and interferer conditions; only one nondirectional neuron reached a correlation >0.9. Dissimilarity occurred because nondirectional neurons became more sensitive to target azimuth with an interferer, whereas they were, by definition, not sensitive for a single source (e.g., Fig. 4C).
Fig. 6.
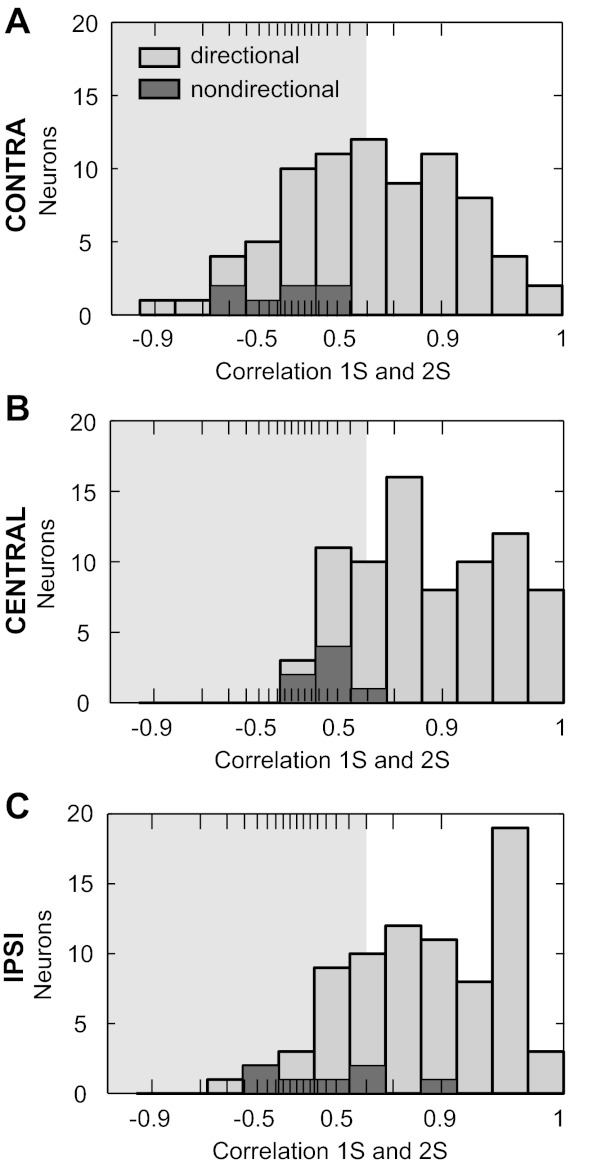
Comparison of the shapes of azimuth tuning functions between single-source and interferer conditions. A–C: histograms of the correlation between the single-source azimuth tuning function and the tuning function in the presence of a contralateral, central, or ipsilateral interferer, respectively. X-axis is tangent-transformed. Shaded area indicates r2 < 0.5.
A repeated-measures ANOVA on the correlation values of directional neurons (Fig. 6, n = 71) found a significant effect of interferer location [F(2,140) = 22.87, P < 0.001], with the mean correlation for the contralateral interferer being significantly smaller than the mean correlations for central and ipsilateral interferers (multiple paired t-tests with Bonferroni correction, both P < 0.001). The shapes of tuning functions with an interferer were similar (r2 > 0.5, positive r, Fig. 6, unshaded area) to those in the single-source condition for 83% (59/71) and 77% (55/71) of directional neurons with the central and ipsilateral interferers, respectively, whereas this held true for only 52% (37/71) of directional neurons with the contralateral interferer.
We performed an additional analysis on those directional neurons for which we had frequency-tuning information, using the same division (1.5 kHz) between lower and higher BF groups as for the directional SNR analysis (n = 14 and 46, respectively). Across interferer locations, more than one-half of lower BF neurons had both significant directional SNRs and tuning function shapes that were highly similar (r2 > 0.8, positive r) between single-source and interferer conditions, whereas this held true for less than one-half of all higher BF neurons (Table 1). Furthermore, 57% (8/14) of lower BF neurons met the strict criterion of high similarity for every interferer location, whereas this held true for only 11% (5/46) of higher BF neurons. Figure 4A shows an example lower BF neuron whose tuning function shapes for every interferer location are highly similar to the single-source shape.
Table 1.
Percentage of neurons with similar tuning function shapes between single-source and interferer conditions
| Highly Similar Shape |
Similar Shape |
|||
|---|---|---|---|---|
| Interferer Location | Low BF | High BF | Low BF | High BF |
| Contralateral | 57 | 26 | 71 | 43 |
| Central | 79 | 37 | 93 | 80 |
| Ipsilateral | 71 | 43 | 71 | 67 |
Values are percentages of neurons that, in the presence of an interferer, have tuning functions that are both sensitive to target azimuth (F test, P < 0.001) and that are highly similar (r2 > 0.8, positive r) or somewhat similar (r2 > 0.5, positive r) between single-source and interferer conditions. Neurons are grouped according to low-frequency (BF ≤ 1.5 kHz; n = 14) or high-frequency (BF > 1.5 kHz; n = 46) tuning, where BF is best frequency.
Many neurons in our sample showed a sharp peak or notch at 0° in their azimuth tuning function with the central interferer (e.g., Fig. 4, C–F, red dashed lines), demonstrating a rate enhancement or suppression as the target became separated in either direction from the interferer. We quantified the degree of rate enhancement or suppression using the central E/S index, a measure that compares the rate when the target and interferer are co-located at 0° with the average of the rates when the target is at +15° and −15° and the interferer remains at 0°. Positive values of the central E/S index indicate rate suppression (e.g., Fig. 4E, index = 0.60), and negative values indicate rate enhancement (e.g., Fig. 4C, index = −0.36).
Significant rate enhancement or suppression with target separation from a central interferer was only observed in higher BF neurons (BF > 1.5 kHz; Tukey's HSD test, P < 0.05) (Fig. 7). Specifically, 43% (20/46) of higher BF neurons exhibited rate suppression and 28% (13/46) exhibited rate enhancement.
Fig. 7.
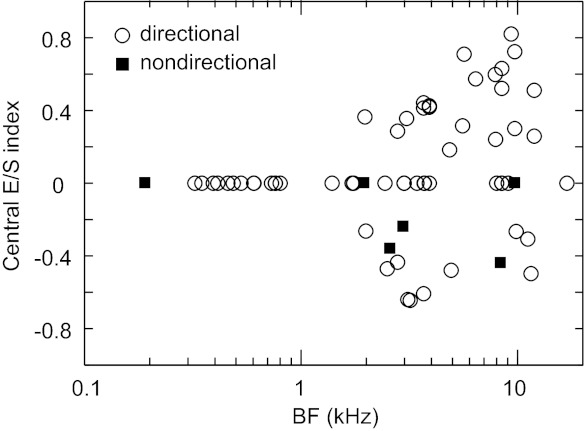
Distribution of the central enhancement/suppression (E/S) index, a measure quantifying the characteristic rate enhancement or suppression observed when the target is separated from a central interferer in either direction.
In summary, for most neurons the introduction of an interferer caused the shape of the azimuth tuning function to be distorted from, yet remain somewhat similar to, its shape for a single source. Target azimuth tuning tended to be more distorted in higher BF neurons than in lower BF neurons, and the contralateral interferer had the most distorting effect for all neurons. Furthermore, 72% of higher BF neurons exhibited a sharp peak or notch at 0° in their azimuth tuning function with a central interferer.
Influence of ITDs and ILDs.
The use of virtual acoustic space techniques allows independent manipulation of the individual cues used to localize sound sources. We measured azimuth tuning functions when either ITD or ILD was fixed across azimuths, both for single sources and with an interferer (central interferer only: n = 43; all 3 interferer locations: n = 9). For the ITD-only condition, ILD and monaural levels were fixed to their values at 0° while ITD was allowed to vary naturally across azimuth. For the fixed-ITD condition, ITD was fixed to zero while ILD and monaural levels were allowed to vary naturally with azimuth. These partial-cue conditions were compared with the full-cue condition (“standard”). Examples of azimuth tuning functions with cue manipulations are shown for four neurons in Fig. 8, ordered by increasing BF. Figure 8, A and B, shows azimuth tuning functions of a low-BF neuron for single sources and with a central interferer, respectively. For this neuron, tuning functions in the ITD-only condition closely match the standard tuning functions, while the fixed-ITD functions are nearly flat, suggesting ITD is the dominant cue underlying tuning to azimuth. Figure 8c-h show azimuth tuning functions from three high-BF neurons. For single sources, the tuning functions in the fixed-ITD and standard conditions match fairly well for all 3 neurons. However, the match between fixed-ITD and standard tuning functions is much poorer with a central interferer; in particular the sharp peaks and notches near 0° apparent in the standard condition are fairly well reproduced in the ITD-only condition, but not the fixed-ITD condition. Thus, azimuth tuning in these high-frequency neurons appears dependent on both ITD and ILD. These characteristics are discussed further below.
Fig. 8.

Target azimuth tuning functions under altered binaural cue conditions. A, C, E, G: target azimuth tuning functions of 4 neurons for single sources under 3 binaural cue conditions: standard (solid line), ITD only (dashed line; only ITD varies), and fixed ITD (dotted line; ITD fixed to zero). Frequency value in each panel indicates the neuron's BF. B, D, F, H: target azimuth tuning functions in the presence of a central interferer (arrowheads) for the neurons with corresponding single-source tuning functions in panel at left.
We split neurons into low-BF (BF < 1.5 kHz; n = 7) and high-BF (BF ≥ 2.5 kHz; n = 25) groups, with the rest having either mid-BF tuning (BF from 1.5 to 2.5 kHz; n = 4) or no frequency tuning data available (n = 7). The stricter division between low- and high-BF neurons used here was to ascertain that low-BF neurons would be sensitive to fine-structure ITDs and high-BF neurons sensitive to envelope ITDs. Neurons in the mid-BF range (1.5–2.5 kHz) are often sensitive to both fine-structure and envelope ITDs (Devore and Delgutte 2010; Joris 2003).
Our broadband noise stimuli are unmodulated and do not have dramatic envelope fluctuations; however, the responses of a cochlear filter to these stimuli do have substantial envelope fluctuations. Many high-BF neurons in the IC are sensitive to ITDs in these cochlea-induced envelopes (Devore and Delgutte 2010; Joris 2003). To verify sensitivity to envelope ITD in our neurons, we recorded responses to broadband noise with varying ITD, both with the same waveform polarity at the two ears and with reversed polarity at one ear (Joris 2003). Envelope ITD sensitivity was defined as a significant, positive correlation between same-polarity and reversed-polarity ITD tuning functions (e.g., Fig. 12, C and D). Figures 9–11 use filled circles to indicate neurons sensitive to envelope ITD, all of which had correlation coefficients >0.65.
Fig. 12.
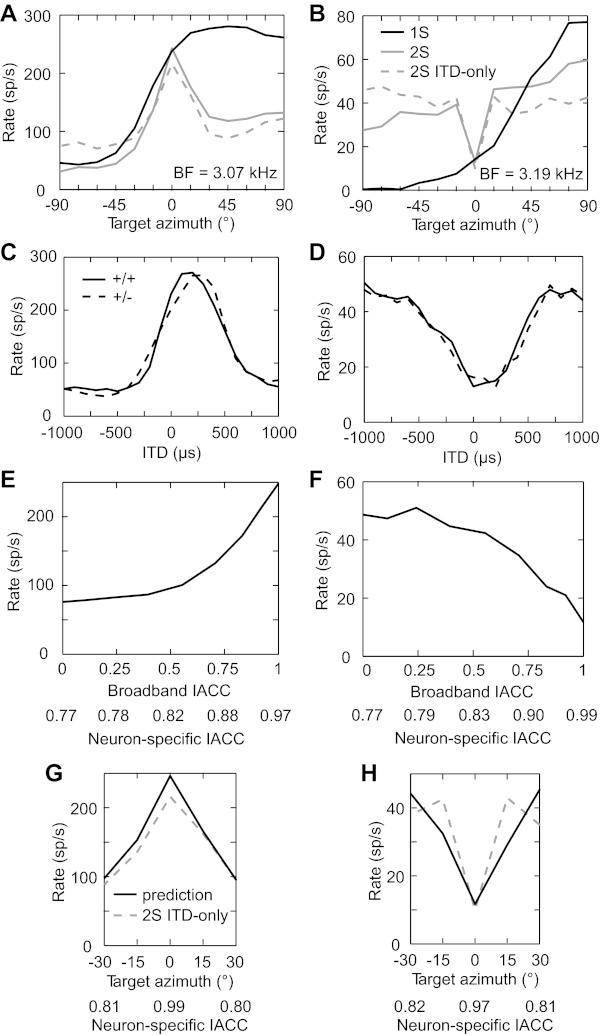
Interaural envelope decorrelation predicts firing rates when a target is separated from a central interferer. A and B: target azimuth tuning functions of 2 IC neurons for single source (black solid line), central interferer (gray solid line), and central interferer in the ITD-only condition (gray dashed line). C and D: ITD tuning functions for the neurons in A and B, respectively. Solid lines indicate the same left/right waveform polarity, and dashed lines indicate reversed polarity. E and F: rate as a function of broadband IACC for the neurons in A and B, respectively. X-axes were alternatively converted into neuron-specific IACC. G and H: rate prediction (black solid line) based on the neuron-specific IACC of the target/interferer stimuli (see methods) and the rate-vs.-neuron-specific IACC function in E and F. Gray dashed line indicates target azimuth tuning function in the presence of a central interferer in the ITD-only condition.
Fig. 9.
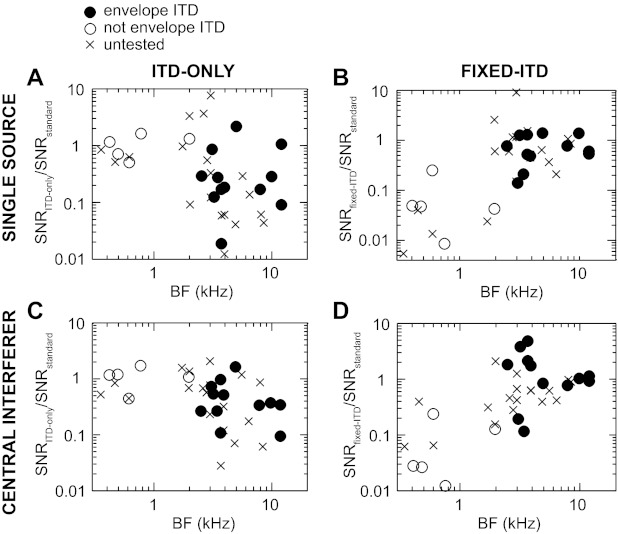
Sensitivity to target azimuth under altered binaural cue conditions. For single sources, the ratio of the ITD-only directional SNR to the standard directional SNR (A) and the ratio of the fixed-ITD directional SNR to the standard directional SNR (B) is plotted vs. BF for all neurons for which frequency tuning data were collected. A ratio of 1 indicates the altered cue condition did not change the neural sensitivity to target azimuth. C and D: same directional SNR ratios as in A and B, respectively, calculated instead from target tuning functions in the presence of a central interferer. Filled circles indicate envelope ITD sensitivity, open circles indicate weak or no envelope ITD sensitivity, and crosses indicate ITD tuning data were not collected.
Fig. 10.
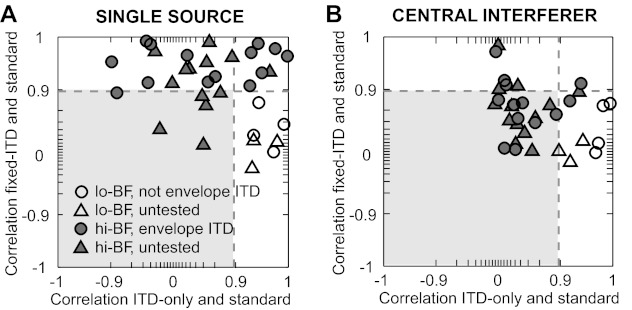
Comparison of the shapes of azimuth tuning functions under altered binaural cue conditions. A: for single sources, the correlation of the shapes of the target azimuth tuning functions between fixed-ITD and standard conditions is plotted against the correlation between ITD-only and standard conditions. B: same as in A for target azimuth tuning functions in the presence of a central interferer. Open symbols denote neurons with BF ≤ 1.5 kHz; solid symbols denote neurons with BF ≥ 2.5 kHz. Filled circles indicate envelope ITD sensitivity, open circles indicate no envelope ITD sensitivity, and triangles indicate that ITD tuning data were not collected. Dashed lines indicate r2 = 0.8 (positive r), and the area bounded by r2 < 0.8 for both axes is shaded.
Fig. 11.
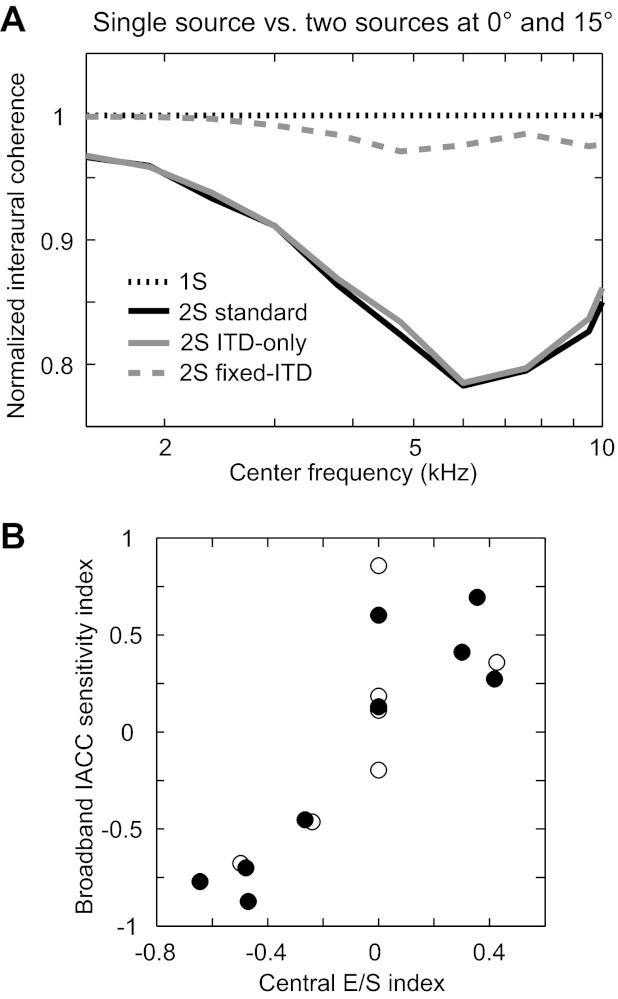
Sound source separation and interaural correlation. A: left and right sound waveforms were bandpass filtered, and the envelopes of the filtered waveforms were cross-correlated to obtain the interaural envelope coherence. In A, the interaural envelope coherence is plotted against filter center frequency for single sources (black dotted line; same plot for all single-source azimuths) and for the target at +15° and the interferer at 0° under standard (black solid line), ITD-only (gray solid line), and fixed-ITD conditions (gray dashed line). B: broadband interaural cross-correlation coefficient (IACC) sensitivity index is plotted against the central E/S index for every neuron for which both measures were available (n = 16). Filled circles indicate envelope ITD sensitivity, and open circles indicate either no envelope ITD sensitivity or that ITD tuning data were not collected.
We first compared directional SNRs in the ITD-only and fixed-ITD conditions with those in the standard condition. Figure 9 shows the ratio of ITD-only or fixed-ITD directional SNR to standard directional SNR for each neuron, across the tonotopic axis. For single sources, there was no significant difference of the mean directional SNRs of low-BF neurons between ITD-only and standard conditions (Fig. 9A), whereas there was a significant difference between fixed-ITD and standard conditions (Fig. 9B) (Table 2). This was expected for the frequency range of low-BF neurons, where ILD is small (Fig. 2D) and ITD dominates. On the other hand, there was no significant difference in the mean directional SNRs of high-BF neurons between fixed-ITD and standard conditions (Fig. 9B), whereas directional SNRs in the ITD-only condition were lower than for the standard condition (Fig. 9A). This suggests that ILD and/or monaural level cues are dominant for high-BF neurons in response to single sources. Results with a central interferer (Fig. 9, C and D) were qualitatively similar to those for single sources: directional SNRs were generally similar between ITD-only and standard conditions for low-BF neurons and generally similar between fixed-ITD and standard conditions for high-BF neurons (Table 2).
Table 2.
Directional SNRs across cue-manipulated conditions
| Cue-Manipulated Condition |
||||
|---|---|---|---|---|
| Interferer Location | Frequency Tuning | Standard | ITD-only | Fixed-ITD |
| Single source | Low | 9.4 | 7.7 | 0.28 |
| High | 6.6 | 1.4 | 4.6 | |
| Central | Low | 4.5 | 3.8 | 0.28 |
| High | 2.7 | 0.94 | 2.2 | |
| Ipsilateral | High | 3.1 | 0.18 | 1.8 |
| Contralateral | High | 1.8 | 0.25 | 0.70 |
Values are geometric means of directional signal-to-noise ratios (SNRs) grouped by interferer location, frequency tuning, and cue-manipulated condition (ITD, interaural time difference). A repeated-measures ANOVA on each frequency group and interferer location (each row) found a significant effect of cue-manipulated condition (F tests, P < 0.003). Bold type indicates that the cue-manipulated condition is significantly different (paired t-tests with Bonferroni correction, P < 0.05) from both the standard condition and the other cue-manipulated condition. Italic type indicates only a significant difference from the standard condition. Sample sizes for single-source and central interferer were n = 7 and 25 for low-BF (<1.5 kHz) and high-BF (≥2.5 kHz) neurons, respectively. Sample size for the ipsilateral and contralateral interferer locations was n = 9.
For a few high-BF neurons (n = 9), we also collected partial-cue tuning functions in the presence of lateral interferers. In these conditions the fixed interaural cue was set to its value at the location of the interferer (either +90° or −90°) while the other interaural cue varied naturally with target azimuth. Results from high-BF neurons with lateral interferers were generally similar to those with a central interferer (Table 2). Specifically, with an ipsilateral interferer, directional SNRs were generally similar between fixed-ITD and standard conditions. However, with a contralateral interferer, directional SNRs (including the standard condition) were always small, i.e., the neurons were nearly insensitive to target azimuth regardless of cue condition.
Although directional SNRs of high-BF neurons were generally comparable for fixed-ITD and standard conditions, this metric does not capture the observation that the shapes of azimuth tuning functions in Fig. 8 clearly differ between these two conditions with a central interferer. We used correlation to quantify the similarity in shapes of azimuth tuning functions between the standard and partial-cue conditions (Fig. 10). For low-BF neurons in response to single sources, the shapes of the tuning functions were highly similar (r2 > 0.8, positive r) between ITD-only and standard conditions, but function shapes in the fixed-ITD condition were clearly different (Fig. 10A, bottom right quadrant). Thus ITD is both necessary and sufficient to produce azimuth sensitivity in low-BF neurons. For a majority of high-BF neurons, the shapes of the tuning functions were highly similar between fixed-ITD and standard conditions (Fig. 10A, top 2 quadrants; e.g., Fig. 8, C, E, and G), suggesting that naturally varying ITDs are not necessary to produce the shapes of the azimuth tuning functions of high-BF neurons. However, ITD did influence azimuth sensitivity in some high-BF neurons in that the tuning functions in the ITD-only and standard conditions were similar in shape (Fig. 10A, top right quadrant).
Results from low-BF neurons with a central interferer were similar to those for the single-source condition in that ITD was both necessary and sufficient to produce the shapes of the azimuth tuning functions (Fig. 10B, bottom right quadrant). However, responses of high-BF neurons with a central interferer showed a different pattern of results than for single sources. For the majority of high-BF neurons, shapes of the tuning functions in neither the fixed-ITD condition nor the ITD-only condition were strongly similar to those in the standard condition (Fig. 10B, shaded area), suggesting that both ILD and envelope ITD are necessary to produce the shapes of the tuning functions of these neurons with a central interferer. Thus azimuth tuning functions of high-BF neurons for a single source are primarily determined by ILD (with perhaps a small influence of monaural levels), even though most of these neurons are also sensitive to envelope ITD (Fig. 10A, filled circles). This influence of envelope ITD is amplified with a central interferer, where ILD alone is insufficient to produce azimuth tuning functions resembling those in the standard condition. Next, we show that envelope ITD is particularly important for producing the sharps peaks and notches frequently observed near 0° with a central interferer.
We compared the central E/S indexes of high-BF neurons in the ITD-only and fixed-ITD conditions with those in the standard condition to investigate whether the characteristic rate suppression or enhancement is dependent on one of the binaural cues. Central E/S indexes in the ITD-only condition were correlated with those in the standard condition (r = 0.84, P < 0.001, n = 31), but no neuron showed significant rate enhancement or suppression in the fixed-ITD condition (see also Fig. 8, D, F, and H). This demonstrates that the features of a stimulus causing rate enhancement or suppression with target separation from a central interferer are dependent on ITD.
Role of interaural envelope decorrelation in sound source separation.
The pronounced rate suppression or enhancement when the target is separated from a central interferer, exhibited by most high-BF neurons, is a surprising finding given that firing rate can change little when the azimuth of a single source is varied from −15° to 0° to +15°. For example, the neuron in Fig. 4E fires ∼85 spikes/s whether a single source is presented at −15°, 0°, or +15°, whereas the concurrent presentation of two sources at either 0° and +15° or 0° and −15° suppresses the rate to ∼35 spikes/s. For neurons such as this, the rate for concurrent sources is not simply midway between the rates for single sources at each location. As shown above, rate suppression or enhancement is only observed in high-BF neurons (Fig. 7) and is observed in the ITD-only condition (specifically envelope ITD), but not the fixed-ITD condition.
Interaural cross-correlation, which quantifies the similarity between the acoustic inputs at the two ears, is thought to underlie sensitivity to ITD (Yin et al. 1987). We computed the interaural envelope coherence (IEC; i.e., the peak value of the IACF across lags) for simulated cochlea-filtered signals at high frequencies. The IEC was estimated for both single sources and two sources separately in the standard, ITD-only, and fixed-ITD conditions (Fig. 11A). To roughly simulate peripheral processing, the ear input waveforms were first bandpass filtered (0.3 oct) at different center frequencies, and then the normalized correlation was calculated from the Hilbert envelopes of the filtered signals. The IEC for single sources were near 1 at all center frequencies, over all azimuths, and over all binaural cue conditions, as expected (Fig. 11A). In contrast, the IEC for two concurrent sources at 0° and 15° (or −15°, equivalently) was dramatically decreased relative to the single-source IEC in the standard condition, and the decrease was more pronounced at higher frequencies (∼6 kHz) than at low frequencies. This decrease was also observed in the ITD-only condition, but not in the fixed-ITD condition. The large decrease in IEC with source separation at high frequencies is consistent with the large changes in firing rate observed in high-BF neurons. Because high-BF IC neurons are sensitive to changes in IACC (Devore and Delgutte 2010; Joris et al. 2006), we hypothesized that the rate suppression or enhancement observed in high-BF neurons is caused by interaural decorrelation of the cochlea-induced envelopes.
To test this hypothesis, we measured responses of some neurons to noise stimuli that systematically varied in broadband IACC (i.e., the value of the normalized IACF at 0 ITD, which is in the vicinity of the ITDs for 0° and ±15° azimuths). If rate suppression were caused by the interaural decorrelation associated with source separation, then the neuron should exhibit a decrease in rate as the broadband IACC decreases. Conversely, rate enhancement should be associated with an increase in rate as broadband IACC decreases.
Rate responses of high-BF neurons varied monotonically with broadband IACC (e.g., Fig. 12, E and F). We calculated a sensitivity index due to changes in broadband IACC from 1 to 0, [rate(1) − rate(0)]/ratemax, for all neurons from which we collected IACC data. The broadband IACC sensitivity index was highly correlated with the central E/S index (r = 0.84, P < 0.001, n = 16) (Fig. 11B); i.e., the change in firing rate with target separation from a central interferer tended to be in the same direction as the change in rate caused by decorrelation of a broadband noise with zero ITD. This result is consistent with our hypothesis that sensitivity to interaural envelope decorrelation underlies the rate suppression or enhancement with target separation from a central interferer.
As a more direct test of this hypothesis, we used a cross-correlation model to predict the azimuth tuning functions of neurons with a central interferer in the ITD-only condition. Figure 12, A and B, shows the tuning functions of two high-BF neurons, one showing rate suppression and the other showing rate enhancement. For both neurons, the suppression or enhancement clearly occurred in the ITD-only condition as well as the standard condition. Both neurons were sensitive to envelope ITD, as demonstrated by their nearly identical same-polarity and reversed-polarity ITD tuning functions (Fig. 12, C and D). The neuron showing rate suppression had a “peak-type” ITD tuning function (i.e., a single broad peak) with the peak centered at ∼200 μs, whereas the neuron showing rate enhancement had a “trough-type” ITD tuning function (i.e., a single broad trough) with the trough centered at ∼100 μs. As expected, the neuron showing rate suppression exhibited a decrease in rate with decreasing broadband IACC, and vice versa for the neuron showing rate enhancement (Fig. 12, E and F). The association of peak-type envelope ITD tuning with rate suppression and of trough-type envelope ITD tuning with rate enhancement held for all envelope ITD-sensitive neurons in our sample (peak-type: n = 13, trough-type: n = 6). This is consistent with a coincidence model: the decreased coincidence of excitatory inputs with interaural decorrelation leads to rate suppression, whereas the decreased coincidence of excitatory and inhibitory inputs with interaural decorrelation leads to rate enhancement. We remapped broadband IACC values into neuron-specific IACC values by taking into account cochlear filtering and the neuron's BD, and we then used the resulting dependence of firing rate on neuron-specific IACC to predict the firing rate from the neuron-specific IACC at each target location with a central interferer (see methods). The predicted rates from the cross-correlation model were compared with the measured rates in the ITD-only condition (Fig. 12, G and H). The model well approximates the enhancement or suppression near the central interferer. Note that model predictions are completely specified by the measured BD, BF, and rate-vs.-broadband IACC function, with no free parameter. This evidence strongly supports our hypothesis that interaural envelope decorrelation underlies rate enhancement or suppression with target separation from a central interferer.
We further investigated whether rate enhancement or suppression also occurs for target separation from a lateral interferer. The change in ITD from 0° to 15° is nearly the same as that from 45° to 90° (or from −90° to −45°; Fig. 2E). Correspondingly, the IEC for a target at 45° and an interferer at 90° is nearly the same as that for a target at 15° and an interferer at 0°. Since the amount of decorrelation is similar for lateral interferers and central interferers, we might then expect neurons that exhibit rate suppression or enhancement with a central interferer to also exhibit the same suppression or enhancement with lateral interferers. However, our data show that this is not always the case. For example, Fig. 4, D and E, shows azimuth tuning functions from two high-BF neurons exhibiting rate suppression with a central interferer (red dashed lines). For these same neurons, the firing rate changes little when the target is moved either from +90° to +45° with a fixed contralateral interferer at +90° (blue dotted line) or from −90° to −45° with an ipsilateral interferer at −90° (green solid line). Similarly, Fig. 4F shows data from a neuron showing rate enhancement with a central interferer (red dashed line) but little rate change with target separation from lateral interferers (blue dotted and green solid lines).
The absence of a strong enhancement or suppression with lateral interferers is likely due to the influence of ILD. The average ILD at high frequencies is 18 dB for the +45°/+90° target/interferer combination, whereas it is only 3 dB for the 15°/0° combination. In a coincidence model, a large ILD, i.e., a large input from one ear and a small input from the other, will reduce the probability of binaural coincidences even if the normalized interaural correlation of the input signals is high. Therefore, the influence of changes in interaural correlation on the output of a coincidence model would be weakened with a large ILD.
Different effects of an interferer on interaural correlation at low and high frequencies.
Why is rate enhancement or suppression only observed in high-BF neurons sensitive to envelope ITD, but not in low-BF neurons sensitive to fine-structure ITD? We used a simple model to investigate the case when target and interferer only differ in ITD (and not ILD). Figure 13, A and B, shows narrowband IACC (i.e., the IACF at zero delay) as a function of target ITD for both a low-frequency band (500 Hz) and a high-frequency band (6 kHz). The cross-correlation was performed on the whole waveforms of the filtered noise for the 500-Hz band and on the waveform envelopes for the 6-kHz band. For the 500-Hz band, the dependence of IACC on target ITD with a central interferer is a scaled and shifted version of that for a single source (Fig. 13A). This is because the IACC of the sum of two uncorrelated, same-intensity sources is simply the average of the IACCs of each source presented alone. Therefore, the whole waveform IACC with an interferer is always midway between the single-source IACCs at the interferer ITD and the target ITD. This is consistent with the absence of any pronounced rate suppression or enhancement in low-BF neurons in our data (Fig. 7).
Fig. 13.
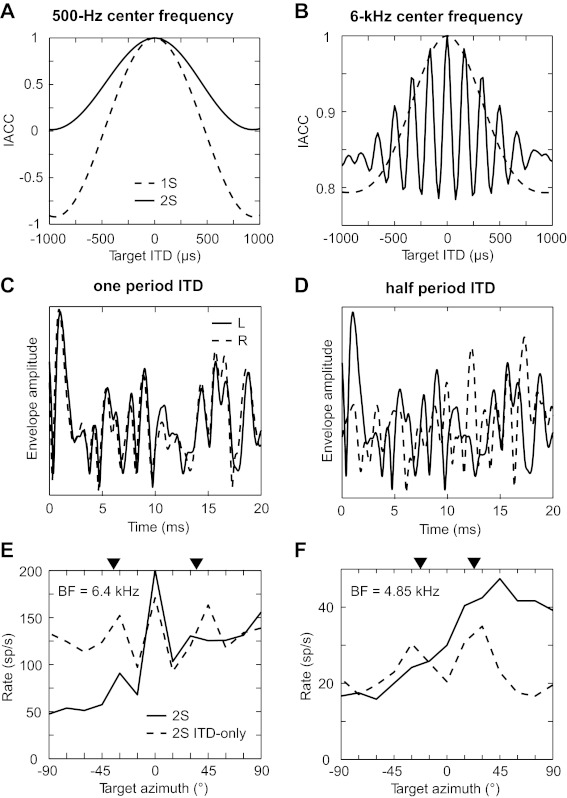
Differences in the cross-correlation of whole waveforms and envelopes. Left and right broadband noises were bandpass filtered at center frequencies of 500 Hz (A; 0.6-oct bandwidth) and 6 kHz (B; 0.25-oct bandwidth). The normalized IACC was computed from the whole waveforms (A) and from the envelopes (B) as a function of target ITD. IACC was computed for a single source (dashed line) and in the presence of an interferer at zero ITD (solid line). C: a 20-ms segment of the left (solid line) and right envelopes (dashed line) used to compute the IACC in the presence of an interferer when the target ITD is equal to one period of the center frequency (i.e., at the side peak of the solid curve in B). D: same as in C for a target ITD equal to one-half period of the center frequency (i.e., at the side trough of the solid curve in B). E and F: tuning functions in the presence of a central interferer in the ITD-only condition that oscillate with azimuth for 2 neurons. Dashed lines indicates ITD-only condition, and solid line indicates standard condition. Arrowheads indicate the azimuths corresponding to ITDs of one period (E) and one-half period (F) of the BF away from zero.
With the use of envelopes for the 6-kHz band, IACCs for a single source and in the presence of an interferer are dramatically different from each other (Fig. 13B). The IACC for a single source shows a broad maximum, whereas the IACC with a central interferer oscillates as a function of target ITD at the period of the band center frequency. This high-frequency oscillation occurs despite the lack of high-frequency components in the envelopes being cross-correlated. At a target ITD of 0, the sum of the target and interferer waveforms are identical in both ears, leading to perfect interaural correlation of their envelopes. The target and interferer waveforms are quasi-periodic due to narrowband filtering. At a target ITD equal to one period of the center frequency, the right target waveform becomes again correlated with the left target waveform because of their quasi-periodicity; therefore, the waveform interactions between target and interferer are similar to the case of 0 ITD, leading to similar left and right envelopes (Fig. 13C) and high interaural correlation. In contrast, at a target ITD equal to one-half the period of the center frequency, the left and right target waveforms are nearly in antiphase for the same reason of quasi-periodicity; therefore, the waveform interactions between target and interferer are very different from the case of 0 ITD, leading to very different left and right envelopes (Fig. 13D) and sharply reduced interaural correlation.
The sharp envelope decorrelation when the target is shifted a small ITD away from the interferer is consistent with the pronounced rate enhancement or suppression seen in high-BF neurons. Some neurons even showed oscillatory behavior in their azimuth tuning functions with an interferer as predicted by the IACC model. Figure 13E shows the target azimuth tuning function with a central interferer in the ITD-only condition (dashed line) for a high-BF (6.4 kHz) neuron showing rate suppression. The tuning function oscillates with side peaks near the azimuths associated with ITDs of ±1 period of the BF (arrowheads). Figure 13F shows results from a different high-BF neuron (4.85 kHz) showing rate enhancement and oscillation in the ITD-only condition; the rate peaks near the azimuths associated with ITDs of ±½ the period of the BF (arrowheads), as expected for a trough-type neuron where firing rate increases with decorrelation. In the standard condition (solid lines in Fig. 13, E and F), the oscillations are no longer apparent due to the effect of ILD, which masks sensitivity to interaural correlation as explained above. Therefore, in the standard condition, rate enhancement or suppression due to interaural envelope decorrelation is mostly observed in a small range of target azimuth separations from a central interferer.
DISCUSSION
In a complex acoustic environment with multiple, spatially separated sound sources, the binaural cues for sound localization are distorted from their values for each source presented in isolation. Consequently, we found that azimuth sensitivity of IC neurons is degraded and the shapes of their tuning functions are altered in the presence of an interferer. However, this degradation did not preclude the ability to encode target azimuth; the firing rates of a large majority of IC neurons remained sensitive to target azimuth in the presence of an interferer, and the shapes of their tuning functions remained somewhat similar to those of single-source tuning functions (the one exception being high-BF neurons with a contralateral interferer). Therefore, our results suggest that the pattern of firing rates across the population of IC neurons can represent the azimuth of a broadband noise source in the presence of another spatially separated noise source at the same stimulus level. It remains to be seen to what extent these results are robust to variations in target-to-interferer ratio and also how they depend on overall stimulus level.
We found that the azimuth tuning functions of low-BF neurons were exclusively dominated by sensitivity to naturally varying ITD and tended to be more robust than tuning functions of high-BF neurons to the effect of an interferer. However, azimuth sensitivity (i.e., directional SNR) with an interferer was equally strong for low- and high-BF neurons, consistent with previous results from the IC in the presence of reverberation when both ITD and ILD were available (Devore and Delgutte 2010). For single sources, naturally varying ITD was not necessary to reproduce the overall shape of azimuth tuning functions in high-BF neurons. However, ITD played a greater role in high-BF neurons with a central interferer, because the interaural decorrelation of cochlea-induced envelopes caused by source separation substantially influenced the shape of the tuning function by introducing a sharp peak or notch near 0°. This finding suggests that ITD information may be important for the localization of high-frequency sound sources in multisource environments, challenging the long-standing “duplex theory” of sound localization, which posits that ITD information is mainly used for localizing low-frequency sources and ILD information is mainly used for localizing high-frequency sources (Rayleigh 1907).
Comparison with previous studies of concurrent-source encoding.
It is interesting to compare the present results with those of a related study in the IC of barn owl, where neurons were found to respond only when the location of one of two concurrent, spatially separated sound sources fell within their spatial receptive fields (Keller and Takahashi 2005). Spatial receptive fields in the barn owl are extremely narrow compared with those in the rabbit due to the sharp ITD sensitivity at high frequencies in the barn owl (Sullivan and Konishi 1984). In the Keller and Takahashi study, sources were always separated by 30° azimuth, essentially guaranteeing that if one source was inside the receptive field of a neuron, the other one would be outside. In contrast, sources separated by 30° would, if presented individually, excite the same neurons to a large extent in the rabbit IC. The closest comparable condition to the barn owl in our study is with an ipsilateral interferer; because most azimuth tuning functions show a contralateral preference, a contralateral target is then within the receptive field while the interferer is outside. As in the results of Keller and Takahashi (2005), we found that an interferer outside of the receptive field decreased the rate response to a target located inside the receptive field, yet the shape of the azimuth tuning function remained comparable to that for a single source. Interestingly, Keller and Takahashi also found that barn owl IC neurons selectively encode temporal information related to the stimulus located within the receptive field. It will be of interest whether mammalian IC neurons do the same, and whether they can faithfully represent the temporal information from each source when both are placed within their receptive field.
A few neurophysiological studies in mammals have examined the neural encoding of a target in the presence of a spatially separated interferer in anesthetized preparations, including studies of the gerbil dorsal nucleus of the lateral lemniscus (Siveke et al. 2007), cat IC (Lane and Delgutte 2005), and cat auditory cortex (Brugge et al. 1998; Furukawa and Middlebrooks 2001). Among these, the experimental paradigm in the Furukawa and Middlebrooks study was closest to our own. In that study, neurons in cortical area A2 were found to remain sensitive to target azimuth in the presence of the interferer, and the shape of the tuning function was dependent on interferer location. Evidence of pronounced rate enhancement or suppression with target separation from a central interferer was not reported, possibly due to a coarse sampling of target azimuth (40° steps).
Comparison to previous studies of single-source encoding.
The majority of directional IC neurons had contralateral best azimuths, consistent with virtual space studies in the IC of awake rabbit (Kuwada et al. 2011) and marmoset (Slee and Young 2011). We only measured tuning to azimuth in the frontal hemifield, for which relevant psychophysical data exist regarding concurrent source localization. It is possible that some neurons in our sample would have best azimuths in the contralateral rear hemifield had we measured tuning functions over the entire 360°; however, both Kuwada et al. and Slee and Young found that only a small fraction of IC neurons have best azimuths in the rear hemifield at 20 dB above neural threshold.
Our results with binaural cue manipulation for single sources show that azimuth tuning functions of low-BF neurons are determined by sensitivity to ITD and that tuning functions of high-BF neurons are primarily determined by sensitivity to ILD and/or monaural level, although ITD also had an influence on azimuth tuning of some high-BF neurons (Figs. 9, A and B, and 10A). This is consistent with previous results in anesthetized cat, where the shapes of azimuth tuning functions of high-BF IC neurons were largely determined by ILD and possibly monaural level (Delgutte et al. 1995). The dominance of ILD among high-BF neurons in our data is consistent with the results of Slee and Young (2011) from the IC of awake marmosets. Using stimuli with misaligned localization cues in virtual acoustic space, they found ILD had more influence than ITD and spectral shape on the azimuth tuning functions of high-BF neurons. Moreover, high-BF neurons in the lateral superior olive, which provides a major input to the IC (Winer and Schreiner 2005), have azimuth tuning functions that are largely determined by their sensitivity to ILD (Joris and Yin 1995; Tollin and Yin 2002).
Since monaural spectrum also varies systematically with azimuth, it is possible that the azimuth sensitivity of our high-BF neurons is influenced by monaural sound levels near their BF as well as by ILD. However, previous studies in both anesthetized cat (Delgutte et al. 1999) and awake rabbit (Kuwada et al. 2011) have explicitly shown that azimuth tuning functions of most IC neurons are shaped by binaural interactions rather than by monaural cues.
Relation to psychophysics.
Localization of single sources in anechoic space is primarily influenced by ITD at low frequencies and ILD at high frequencies (Macpherson and Middlebrooks 2002; Wightman and Kistler 1992). Consistent with this, our results show that, for single sources, azimuth tuning functions are determined by ITD for low-BF neurons and by ILD, with a possible minor contribution from monaural level, for high-BF neurons. Unlike the single-source condition, azimuth tuning functions of most high-BF neurons in the presence of a central interferer were influenced by envelope ITD as well as ILD or monaural level (Fig. 10B). To our knowledge, the role of individual binaural cues in the localization of low-frequency and high-frequency sound sources has only been investigated for a single-source in anechoic space. Our results suggests that, unlike for single sources, ITD may have more influence on the localization of high-frequency sources in multisource environments, thereby challenging the duplex theory of sound localization.
In a study of human sound localization, Lorenzi et al. (1999) found that a click train was localized with better accuracy in the presence of an interfering noise at 0° than at +90° or −90°, and this result held when the click train was filtered to retain only low or high frequencies. This is consistent with our result that azimuth tuning functions of both low- and high-BF neurons are more distorted by a contralateral interferer than by a central interferer (Table 1). Lorenzi et al. further showed that localization in the presence of a noise at +90° was more accurate when the click train was filtered to retain only high frequencies as opposed to only low frequencies. In contrast, we found that both neural sensitivity to target azimuth and shapes of azimuth tuning functions are more degraded in high-BF neurons than in low-BF neurons with a contralateral interferer. The different pattern of results between our physiological study and the psychophysical study of Lorenzi et al. (1999) may partly reflect our use of target and interferer stimuli with nearly identical spectrotemporal properties. It will be of interest to investigate whether the results of the present study change when the target has a different temporal pattern than the interferer (e.g., amplitude modulation, or onset/offset differences).
The pronounced rate suppression or enhancement observed in the majority of high-BF neurons due to interaural decorrelation of envelopes with source separation has important implications for the neural mechanisms underlying auditory perception. Such pronounced rate changes could reliably signal to areas further along the auditory pathway that multiple auditory sources are present. Consistent with this idea, Best et al. (2004) found that subjects are able to detect that two sources rather than one are present when two concurrent broadband noises are separated by only 15° azimuth in front of the listener. This small threshold of separability was maintained when the sounds were highpass filtered but was strongly impaired in a fixed-ITD condition, consistent with a key role of envelope ITD in this task. Consistent with this idea, a signal detection analysis of our neural data yielded comparably low neural detection thresholds for source separation from a central interferer when using only high-BF neurons in the ITD-only condition as when using all neurons in our sample (Day and Delgutte 2011). Best et al. further found that a greater separation of sources was required to detect two concurrent sources when the sources were located laterally as opposed to in front of the listener. Neural detection thresholds for source separation were also higher for lateral interferers than for a central interferer (Day and Delgutte 2011).
Spatial release from masking, i.e., the decrease in detection threshold for a target when it is separated from a masker, has been studied extensively at low frequencies and modeled using interaural cross-correlation of the whole ear input waveforms (Durlach and Colburn 1978). Spatial release from masking also exists at high frequencies and is just as strong as at low frequencies for a central (0°) masker when the target is separated by 45° (Gilkey and Good 1995). Spatial release from masking at high frequencies is usually attributed primarily to the monaural head shadow effect; however, our data suggest that neural sensitivity of high-BF neurons to interaural decorrelation of the envelope may also contribute to this phenomenon for a central interferer.
Neural decoding.
The present study focused on neural encoding of target azimuth in the presence of a fixed interferer. We asked the questions, is the azimuth tuning to a target robust to the presence of an interferer, and is it equally robust for all interferer locations? An equally important question is, what information does the pattern of firing rates across the neural population provide about both the target and interferer locations? The azimuth tuning functions in Fig. 4 demonstrate that a given firing rate of any individual neuron may correspond to several target/interferer combinations, leading to ambiguity. If concurrent sources are localized by focusing on glimpses of sound that contain one source in relative isolation from others, then some neural indicator would be needed to identify which time periods contain single sources and which do not. The general decrease in the range of firing rates available to encode azimuth in the presence of an interferer implies that the pattern of activity across the IC neuron population is very different between single-source and multisource conditions so that this pattern of activity may be a candidate neural indicator signaling which glimpses contain single sources in relative isolation. It will be of interest to investigate whether neural decoding models can use the pattern of firing rates across the population of IC neurons to robustly identify single sources vs. multiple, spatially separated sources, and possibly to localize each.
GRANTS
This work was supported by National Institute on Deafness and Other Communication Disorders Grants R01 DC002258 and P30 DC005209 (B. Delgutte) and R01 DC011555 (D. J. Tollin).
DISCLOSURES
No conflicts of interest, financial or otherwise, are declared by the authors.
AUTHOR CONTRIBUTIONS
M.L.D. and B.D. conception and design of research; M.L.D. and K.K. performed experiments; M.L.D. analyzed data; M.L.D. and B.D. interpreted results of experiments; M.L.D. prepared figures; M.L.D. drafted manuscript; M.L.D. and B.D. edited and revised manuscript; M.L.D., K.K., and B.D. approved final version of manuscript.
ACKNOWLEDGMENTS
We thank Michaël Slama for help with the rabbit preparation, Ken Hancock for software support, and Yoojin Chung for technical assistance. We thank Dan Tollin for a critical reading of the manuscript and for providing facilities for rabbit HRTF measurement.
REFERENCES
- Aitkin LM, Webster WR, Veale JL, Crosby DC. Inferior colliculus. I. Comparison of response properties of neurons in central, pericentral, and external nuclei of adult cat. J Neurophysiol 38: 1196–1207, 1975 [DOI] [PubMed] [Google Scholar]
- Best V, van Schaik A, Carlile S. Separation of concurrent broadband sound sources by human listeners. J Acoust Soc Am 115: 324–336, 2004 [DOI] [PubMed] [Google Scholar]
- Borg E, Engstrom B, Linde G, Marklund K. Eighth nerve fiber firing features in normal-hearing rabbits. Hear Res 36: 191–201, 1988 [DOI] [PubMed] [Google Scholar]
- Braasch J, Hartung K. Localization in the presence of a distracter and reverberation in the frontal horizontal plane. I. Psychoacoustical data. Acta Acust Acust 88: 942–955, 2002 [Google Scholar]
- Brugge JF, Reale RA, Hind JE. Spatial receptive fields of primary auditory cortical neurons in quiet and in the presence of continuous background noise. J Neurophysiol 80: 2417–2432, 1998 [DOI] [PubMed] [Google Scholar]
- Brungart DS, Simpson BD. Localization in the presence of multiple simultaneous sounds. Acta Acust Acust 91: 471–479, 2005 [Google Scholar]
- Chase SM, Young ED. Spike-timing codes enhance the representation of multiple simultaneous sound-localization cues in the inferior colliculus. J Neurosci 26: 3889–3898, 2006 [DOI] [PMC free article] [PubMed] [Google Scholar]
- Cooke M. A glimpsing model of speech perception in noise. J Acoust Soc Am 119: 1562–1573, 2006 [DOI] [PubMed] [Google Scholar]
- Culling JF, Colburn HS, Spurchise M. Interaural correlation sensitivity. J Acoust Soc Am 110: 1020–1029, 2001 [DOI] [PubMed] [Google Scholar]
- Damaske P. Subjektive Untersuchungen von Schallfeldern [Subjective investigations of sound fields]. Acustica 19: 198–213, 1967/1968 [Google Scholar]
- Day ML, Delgutte B. Neural correlates of the detection of concurrent, spatially-separated sound sources in the inferior colliculus. In: Association for Research in Otolaryngology Mid-winter Meeting, Baltimore, MD, 2011 [Google Scholar]
- Delgutte B, Joris PX, Litovsky RY, Yin TC. Receptive fields and binaural interactions for virtual-space stimuli in the cat inferior colliculus. J Neurophysiol 81: 2833–2851, 1999 [DOI] [PubMed] [Google Scholar]
- Delgutte B, Joris PX, Litovsky RY, Yin TC. Relative importance of different acoustic cues to the directional sensitivity of inferior-colliculus neurons. In: Advances in Hearing Research, edited by Manley GA, Klump GM, Koeppl C, Fastl H, Oeckinghaus H. Singapore: World Scientific, 1995, p. 288–299 [Google Scholar]
- Devore S, Delgutte B. Effects of reverberation on the directional sensitivity of auditory neurons across the tonotopic axis: influences of interaural time and level differences. J Neurosci 30: 7826–7837, 2010 [DOI] [PMC free article] [PubMed] [Google Scholar]
- Durlach NI, Colburn HS. Binaural phenomena. In: Handbook of Perception, edited by Carterette EC, Friedman MP. New York: Academic, 1978 [Google Scholar]
- Early SJ, Mason CR, Zheng L, Evilsizer M, Idrobo F, Harrison JM, Carney LH. Studies of binaural detection in the rabbit (Oryctolagus cuniculus) with Pavlovian conditioning. Behav Neurosci 115: 650–660, 2001 [DOI] [PubMed] [Google Scholar]
- Ebert CS, Jr, Blanks DA, Patel MR, Coffey CS, Marshall AF, Fitzpatrick DC. Behavioral sensitivity to interaural time differences in the rabbit. Hear Res 235: 134–142, 2008 [DOI] [PMC free article] [PubMed] [Google Scholar]
- Faller C, Merimaa J. Source localization in complex listening situations: selection of binaural cues based on interaural coherence. J Acoust Soc Am 116: 3075–3089, 2004 [DOI] [PubMed] [Google Scholar]
- Furukawa S, Middlebrooks JC. Sensitivity of auditory cortical neurons to locations of signals and competing noise sources. J Neurophysiol 86: 226–240, 2001 [DOI] [PubMed] [Google Scholar]
- Gilkey RH, Good MD. Effects of frequency on free-field masking. Hum Factors 37: 835–843, 1995 [DOI] [PubMed] [Google Scholar]
- Hancock KE, Noel V, Ryugo DK, Delgutte B. Neural coding of interaural time differences with bilateral cochlear implants: effects of congenital deafness. J Neurosci 30: 14068–14079, 2010 [DOI] [PMC free article] [PubMed] [Google Scholar]
- Heffner H, Masterton B. Hearing in Glires: domestic rabbit, cotton rat, feral house mouse, and kangaroo rat. J Acoust Soc Am 68: 1584–1599, 1980 [Google Scholar]
- Joris PX, Yin TC. Envelope coding in the lateral superior olive. I. Sensitivity to interaural time differences. J Neurophysiol 73: 1043–1062, 1995 [DOI] [PubMed] [Google Scholar]
- Joris PX, van de Sande B, Recio-Spinoso A, van der Heijden M. Auditory midbrain and nerve responses to sinusoidal variations in interaural correlation. J Neurosci 26: 279–289, 2006 [DOI] [PMC free article] [PubMed] [Google Scholar]
- Joris PX. Interaural time sensitivity dominated by cochlea-induced envelope patterns. J Neurosci 23: 6345–6350, 2003 [DOI] [PMC free article] [PubMed] [Google Scholar]
- Keller CH, Takahashi TT. Localization and identification of concurrent sounds in the owl's auditory space map. J Neurosci 25: 10446–10461, 2005 [DOI] [PMC free article] [PubMed] [Google Scholar]
- Kiang NY, Moxon EC. Tails of tuning curves of auditory-nerve fibers. J Acoust Soc Am 55: 620–630, 1974 [DOI] [PubMed] [Google Scholar]
- Kim DO, Bishop B, Kuwada S. Acoustic cues for sound source distance and azimuth in rabbits, a racquetball and a rigid spherical model. J Assoc Res Otolaryngol 11: 541–557, 2010 [DOI] [PMC free article] [PubMed] [Google Scholar]
- Kistler DJ, Wightman FL. A model of head-related transfer functions based on principal components analysis and minimum-phase reconstruction. J Acoust Soc Am 91: 1637–1647, 1992 [DOI] [PubMed] [Google Scholar]
- Koka K, Read HL, Tollin DJ. The acoustical cues to sound location in the rat: measurements of directional transfer functions. J Acoust Soc Am 123: 4297–4309, 2008 [DOI] [PMC free article] [PubMed] [Google Scholar]
- Kuhn GF. Physical acoustics and measurements pertaining to directional hearing. In: Directional Hearing, edited by Yost WA, Gourevitch G. New York: Springer, 1987 [Google Scholar]
- Kuwada S, Bishop BB, Alex C, Condit DW, Kim DO. Spatial tuning to sound source azimuth in the inferior colliculus of the unanesthetized rabbit. J Neurophysiol 106: 2698–2708, 2011 [DOI] [PMC free article] [PubMed] [Google Scholar]
- Lane CC, Delgutte B. Neural correlates and mechanisms of spatial release from masking: single-unit and population responses in the inferior colliculus. J Neurophysiol 94: 1180–1198, 2005 [DOI] [PMC free article] [PubMed] [Google Scholar]
- Licklider JC, Dzendolet E. Oscillographic scatterplots illustrating various degrees of correlation. Science 107: 121–124, 1948 [DOI] [PubMed] [Google Scholar]
- Lorenzi C, Gatehouse S, Lever C. Sound localization in noise in normal-hearing listeners. J Acoust Soc Am 105: 1810–1820, 1999 [DOI] [PubMed] [Google Scholar]
- Macpherson EA, Middlebrooks JC. Listener weighting of cues for lateral angle: the duplex theory of sound localization revisited. J Acoust Soc Am 111: 2219–2236, 2002 [DOI] [PubMed] [Google Scholar]
- Middlebrooks JC, Green DM. Directional dependence of interaural envelope delays. J Acoust Soc Am 87: 2149–2162, 1990 [DOI] [PubMed] [Google Scholar]
- Middlebrooks JC, Makous JC, Green DM. Directional sensitivity of sound-pressure levels in the human ear canal. J Acoust Soc Am 86: 89–108, 1989 [DOI] [PubMed] [Google Scholar]
- Rayleigh L. On our perception of sound direction. Philos Mag 13: 214–232, 1907 [Google Scholar]
- Rife DD, Vanderkooy J. Transfer-function measurement with maximum-length sequences. J Audio Eng Soc 37: 419–444, 1989 [Google Scholar]
- Seshagiri CV, Delgutte B. Response properties of neighboring neurons in the auditory midbrain for pure-tone stimulation: a tetrode study. J Neurophysiol 98: 2058–2073, 2007 [DOI] [PMC free article] [PubMed] [Google Scholar]
- Siveke I, Leibold C, Grothe B. Spectral composition of concurrent noise affects neuronal sensitivity to interaural time differences of tones in the dorsal nucleus of the lateral lemniscus. J Neurophysiol 98: 2705–2715, 2007 [DOI] [PubMed] [Google Scholar]
- Slee SJ, Young ED. Information conveyed by inferior colliculus neurons about stimuli with aligned and misaligned sound localization cues. J Neurophysiol 106: 974–985, 2011 [DOI] [PMC free article] [PubMed] [Google Scholar]
- Sullivan WE, Konishi M. Segregation of stimulus phase and intensity coding in the cochlear nucleus of the barn owl. J Neurosci 4: 1787–1799, 1984 [DOI] [PMC free article] [PubMed] [Google Scholar]
- Tollin DJ, Yin TC. The coding of spatial location by single units in the lateral superior olive of the cat. II. The determinants of spatial receptive fields in azimuth. J Neurosci 22: 1468–1479, 2002 [DOI] [PMC free article] [PubMed] [Google Scholar]
- Trahiotis C, Bernstein LR, Stern RM, Buell TN. Interaural correlation as the basis of a working model of binaural processing: an introduction. In: Sound Source Localization, edited by Popper AN, Fay RR. New York: Springer, 2005 [Google Scholar]
- Wightman FL, Kistler DJ. The dominant role of low-frequency interaural time differences in sound localization. J Acoust Soc Am 91: 1648–1661, 1992 [DOI] [PubMed] [Google Scholar]
- Winer JA, Schreiner CE. (editors). The Inferior Colliculus. New York: Springer, 2005 [Google Scholar]
- Yin TC, Chan JC, Carney LH. Effects of interaural time delays of noise stimuli on low-frequency cells in the cat's inferior colliculus. III. Evidence for cross-correlation. J Neurophysiol 58: 562–583, 1987 [DOI] [PubMed] [Google Scholar]