

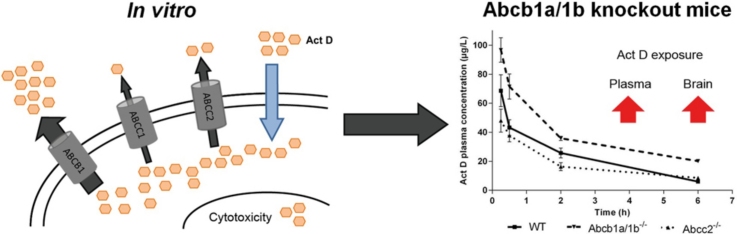
Graphical abstract
Abbreviations: ABC transporter, ATP-binding cassette transporter; Act D, actinomycin D; ANOVA, analysis of variance; GI50, concentration at 50% growth inhibition; LC/MS, liquid chromatography/mass spectrometry; SEM, standard error of the mean; SNPs, single nucleotide polymorphisms
Keywords: Actinomycin D, ABC transporters, Cancer
Abstract
Actinomycin D plays a key role in the successful treatment of Wilms tumour. However, associated liver toxicities remain a drawback to potentially curative treatment. We have used MDCKII cells over-expressing ABCB1, ABCC1, ABCC2 and ABCG2, alongside knockout mouse models to characterise actinomycin D transport and its impact on pharmacokinetics. Growth inhibition, intracellular accumulation and cellular efflux assays were utilised. A 59-fold difference in GI50 was observed between MDCKII-WT and MDCKII-ABCB1 cells (12.7 nM vs. 745 nM, p < 0.0001). Reduced sensitivity was also seen in MDCKII-ABCC1 and ABCC2 cells (GI50 25.7 and 40.4 nM respectively, p < 0.0001). Lower intracellular accumulation of actinomycin D was observed in MDCKII-ABCB1 cells as compared to MDCKII-WT (0.98 nM vs. 0.1 nM, p < 0.0001), which was reversed upon ABCB1 inhibition. Lower accumulation was also seen in MDCKII-ABCC1 and ABCC2 cells. Actinomycin D efflux over 2 h was most pronounced in MDCKII-ABCB1 cells, with 5.5-fold lower intracellular levels compared to WT. In vivo studies showed that actinomycin D plasma concentrations were significantly higher in Abcb1a/1b−/− as compared to WT mice following administration of 0.5 mg/kg actinomycin D (AUC0–6 h 242 vs. 152 μg/L h respectively). While comparable actinomycin D concentrations were observed in the kidneys and livers of Abcb1a/1b−/− and Abcc2−/− mice, concentrations in the brain were significantly higher at 6 h following drug administration in Abcb1a/1b−/− mice compared to WT. Results confirm actinomycin D as a substrate for ABCB1, ABCC1 and ABCC2, and indicate that Abcb1a/1b and Abcc2 can influence the in vivo disposition of actinomycin D. These data have implications for ongoing clinical pharmacology trials involving children treated with actinomycin D.
1. Introduction
First discovered in the 1940s [1], actinomycin D (Act D) now plays a pivotal role as an anti-tumour antibiotic in the treatment of several paediatric cancers. As part of a successful multidisciplinary approach, Act D is a key component in the treatment of Wilms tumour, resulting in cure rates between 80% and 90% [2,3]. Act D binds to DNA in a guanine-dependent manner, preventing the synthesis of RNA [4] and it has also been shown to inhibit the incorporation of nucleotide triphosphates into DNA [5].
Act D is a relatively well-tolerated drug with minimal side effects in the majority of patients in a paediatric setting. However, a major drawback to Act D treatment is the incidence of liver toxicities, previously reported in 1.7–13.5% of cases [6–9]. Risk factors include Wilms tumour, younger age at treatment and dose-intensity [8]. A pharmacokinetic study published in 2005, involving 31 patients receiving Act D, indicated a high level of inter-patient variability in Act D exposure among patients on similar dosage regimens. Despite the relatively small number of patients studied, these data suggested that higher concentrations may correlate with an increased risk of toxicity [10].
ATP-binding cassette (ABC) transporters are present throughout the body, facilitating the removal of a wide range of substrates from cells. In the liver, kidney and intestine, p-glycoprotein (ABCB1/MDR1), multidrug resistance protein 2 (ABCC2/MRP2) and breast cancer resistance protein (ABCG2/BCRP) are present at the apical cell membrane, facilitating the elimination of substrates via the bile, urine and faeces [11]. ABCB1 is also found on the apical membrane at the blood–brain barrier and blood–testis barrier, protecting vital organs from harmful toxins [12,13]. In contrast, multidrug resistance protein 1 (ABCC1/MRP1) is present at the basolateral membrane, facilitating transport of substrates into blood [14].
Many anti-cancer agents are substrates for ABC transporters, and as such drug disposition and efficacy can be affected by genetic variation in expression and function. For example, Abcb1a/1b knockout mice have been reported to exhibit 1.4-fold higher plasma concentrations of etoposide compared to wild type (WT) mice, indicating reduced transporter-mediated drug elimination [15]. In clinical studies transporter genotype has been shown to influence drug exposure for known substrates. Lal et al. reported that in an Asian breast cancer patient population, individuals who were homozygous mutant for all three common single nucleotide polymorphisms (SNPs) of ABCB1 (C1236T, G2677T/A and C3435T) had significantly higher exposure to the anticancer agent doxorubicin [16].
Although it has long been postulated that Act D is a substrate for ABCB1 [17–19], with additional studies indicating that ABCC2 plays a role in Act D transport [20], the majority of studies published in this area involve screening of large numbers of candidate drugs, as opposed to detailed in vitro and in vivo studies designed to characterise Act D as a substrate for the major ABC transport proteins.
Transport of Act D by ABC transporters could be clinically relevant, with the potential to alter drug exposure and influence associated toxicities. As an initial step to investigate the factors which may impact on the observed inter-patient variation in Act D exposure [10], the transport of Act D was investigated in vitro using the Madin–Darby canine kidney-II (MDCKII) cell lines stably over-expressing human ABCB1, ABCC1, ABCC2 and ABCG2. Experimental approaches including Act D growth inhibition (GI) studies, intracellular accumulation assays and a fluorescent competition assay were utilised. Based on the in vitro data, in vivo studies were carried out with Abcb1a/1b−/− and Abcc2−/− mice to investigate actinomycin D pharmacokinetics and tissue accumulation as compared to WT. Information from these studies will be relevant to the analysis of pharmacogenetic data currently being generated from national clinical pharmacology studies involving the treatment of childhood cancer patients with actinomycin D in both the US and the UK.
2. Materials and methods
2.1. Chemicals
HPLC-grade solvents (methanol, acetonitrile and acetic acid) were supplied by Fisher Scientific (Loughborough, UK), concentrated ammonia was supplied by BDH (Dorset, UK). KO143 and MK571 were from Tocris Bioscience (Bristol, UK), CellTiter 96® AQueous One Solution Cell Proliferation Assay (MTS) substrate was from Promega Corporation (Southampton, UK) and Pierce protein assay kits were supplied by Thermo-Scientific. All other chemicals were from Sigma–Aldrich (UK).
2.2. Cell lines
Wild-type polarised canine kidney MDCKII cell lines and those transfected with human ABCB1 (MDR1), ABCC1 (MRP1), ABCC2 (MRP2) and ABCG2 (BCRP), kindly provided by Dr A.H. Schinkel (Amsterdam, the Netherlands), were used for growth inhibition, intracellular accumulation assays and the fluorescent competition assay. Cells were cultured as a monolayer in DMEM with 10% FBS, 2 mM l-glutamate, 2 mM penicillin, and 2 mM of streptomycin, at 37 °C, 5% CO2, in a humidified incubator, and were routinely screened for mycoplasma.
2.3. Growth inhibition
Growth inhibition (GI) assays were carried out in 96-well plates (Corning Costar, Amsterdam, the Netherlands). All cells were seeded at a density of 4000 cells/well on day 0, and allowed to establish growth over 24 h. Cells were treated with varying concentrations of Act D on day 1 in the presence or absence of the appropriate transport inhibitor; verapamil (1 μM) for ABCB1, MK571 (25 μM) for ABCC1/2 and KO143 (0.2 μM) for ABCG2. Act D concentrations (0–10 μM) chosen after initial GI experiments were carried out to determine half-maximal inhibitory concentration (IC50) values of Act D in these cell lines. Following a 72 h drug incubation, Promega MTS substrate (12 μl) was added and plates were returned to the incubator for 2–4 h. The plates were read on a Spectramax 250 (Molecular Devices, USA) at 490 nm. Results were reported as a percentage of growth inhibition compared to cells incubated with medium alone.
2.4. Intracellular accumulation and efflux
All cell lines were seeded at 25,000 cells per well in 6-well plates on day 0 and left to establish growth over 4 days. On day 4 individual plates of cells were incubated with 0.01–2 μM Act D alone for up to 12 h to determine doses which did not cause cellular toxicity over defined time periods. Experiments were then carried out over 12 h with 0.01 μM Act D, or over 4 h with 0.1 μM Act D (to ensure detectability on the LC/MS), and increasing concentrations (0–25 μM) of the appropriate inhibitor. For efflux experiments, cell growth was established and cells were incubated with 0.1 μM Act D for 4 h at 37 °C, 5% CO2 in a humidified incubator. The medium was then replaced with medium containing no drug and intracellular levels were determined at 0, 1 and 2 h to determine the rate of drug efflux. After the defined time course, medium was removed and the cells were washed twice with 1 ml ice-cold PBS to remove excess Act D and to prevent any further ABC-mediated drug transport. Methanol (200 μl) was added to each well and cell scrapers were used to collect cells. Intracellular Act D concentrations in cell lysates were then determined by LC/MS analysis.
2.5. Fluorescence competition assay
Fluorescence competition assays were carried out in black, clear bottom 96-well plates (Greiner Bio-One, Stonehouse, UK). MDCKII-WT and MDCKII-ABCB1 cells were seeded at 1000 cells per well, and allowed to establish growth over 4 days. Cells were then pre-incubated with varying levels of Act D (0–100 μM) for 1 h. The fluorescent ABCB1 substrate doxorubicin (10 μM) was added for a further 1 h, to assess doxorubicin efflux in the presence of Act D. Hoechst 33342 was used as a nuclear stain once cells had been formalin fixed and permeabilised with 0.1% Triton-X. Cells were then imaged for doxorubicin fluorescence on a BD HT Pathway (BD Biosciences, Oxford, UK). Doxorubicin was excited at 488 nm and a 515 nm long-pass filter was used to collect emitted fluorescence.
2.6. Animals
All in vivo experiments were reviewed and approved by the institutional animal welfare committee, and performed according to National Cancer Research Institute Guidelines [21] and National Law. Abcb1a/1b−/− [22,23], Abcc2−/− [24] constitutive knockout mice, along with the parental FVB strain, were supplied by Taconic (Hudson, USA) with 12 mice used per strain, 3 mice per time point. Mice were treated with Act D (Merck Sharp & Dohme, UK) supplied by the Pharmacy, Royal Victoria Infirmary, Newcastle upon Tyne. Act D was reconstituted in saline and administered intravenously at a dose of 0.5 mg/kg via the tail vein.
2.7. Plasma pharmacokinetics of Act D in WT, Abcb1a/1b−/− and Abcc2−/− mice
At the appropriate sampling times (15 min, 30 min, 2 h and 6 h), 3 mice were anesthetised with 10 ml/kg of an anaesthetic cocktail 0.75 mg/kg fentanyl citrate, and 25 mg/kg fluanisone (Janssen, High Wycombe, UK) with 12.5 mg/kg midazolam (Roche, Welwyn Garden City, UK) and euthanized by cervical dislocation. Blood was taken via cardiac puncture using a heparin-coated needle (Terumo, Inchinnan, UK) and syringe (BD Biosciences, Oxford, UK), and placed in 1.5 ml capped vials. Plasma was separated by centrifugation (1000 × g for 5 min) and stored at −20 °C until needed. From each mouse, liver, kidney and brain samples were also taken for analysis immediately after blood sampling and stored at −80 °C until analysis.
2.8. Tissue distribution of Act D in WT, Abcb1a/1b−/− and Abcc2−/− mice
Tissue samples were washed in PBS, weighed and homogenised in 3× PBS (1 g tissue: 3 ml PBS). Act D was extracted from all tissues using acetonitrile and Act D concentrations were determined in liver and kidneys via the method of addition using standards in acetonitrile. The method of addition was not used for brain samples due to volume constraints, with Act D concentrations in the brain reported as peak area. Extracted samples in acetonitrile were dried down under nitrogen and reconstituted in 50:50 1% acetic acid (pH 4.0) and methanol for LC/MS analysis. All results were expressed per gram of tissue.
2.9. LC/MS analysis
An API4000 mass spectrometer (Applied Biosystems, CA, USA) was used for analysis, attached to a Series 200 micropump, autosampler and peltier column oven (Perkin Elmer Ltd., Beckonsfield, UK). A Luna 3μ C8 (2) mercury column (20 mm × 4 mm) fitted with a security guard cartridge C8 (4 mm × 2 mm) was used (Phenomenex, Cheshire, UK). A validated LC/MS was used for analysis; using 1% acetic acid pH 4 and 100% methanol as mobile phases [25]. Samples in methanol were diluted appropriately, combined with 1% acetic acid (pH 4.0) and a 50:50 solution injected onto the LC/MS.
2.10. Statistical analysis
For growth inhibition assays, non-linear regression was performed, with upper limit set to 100% and lower limit set to 0%. An F-test was then used to compare GI50 values. For intracellular accumulation and cellular efflux assays, two-way analysis of variance (ANOVA) was used to assess both cell line and inhibitor effect. GraphPad Prism 5.04 was used for all statistical analysis. WinNonlin Professional Version 5.3 software (Pharsight Corp., Mountain View, CA) was used to calculate the area under the plasma concentration–time curve to 6 h (AUC0–6 h) and to estimate area under the plasma concentration–time curve to infinity (AUC0–∞) and t1/2.
3. Results
3.1. Impact of ABC transporter expression on growth inhibition
To determine the influence of ABC transporters on growth inhibition, MDCKII-WT, MDCKII-ABCB1, MDCKII-ABCC1, MDCKII-ABCC2 and MDCKII-ABCG2 cell lines were incubated with Act D. ABCB1 over-expressing cell lines were 59-fold less sensitive than the parental cell lines (GI50 values 745 nM vs. 12.7 nM, p < 0.0001), indicating that Act D undergoes ABCB1-mediated efflux (Fig. 1 and Table 1). Inhibition of ABCB1 with verapamil (1 μM) over a 72 h period resulted in a partial reversal of resistance in the MDCKII-ABCB1 cell line, with a 6-fold decrease in GI50 (745 nM vs. 129 nM, p < 0.0001, Fig. 1 and Table 1). Inhibition with verapamil also caused a 3-fold reduction (12.7 nM vs. 4.4 nM, p < 0.0001) in GI50 in the parental cell line, due to inhibition of endogenous canine ABCB1.
Fig. 1.
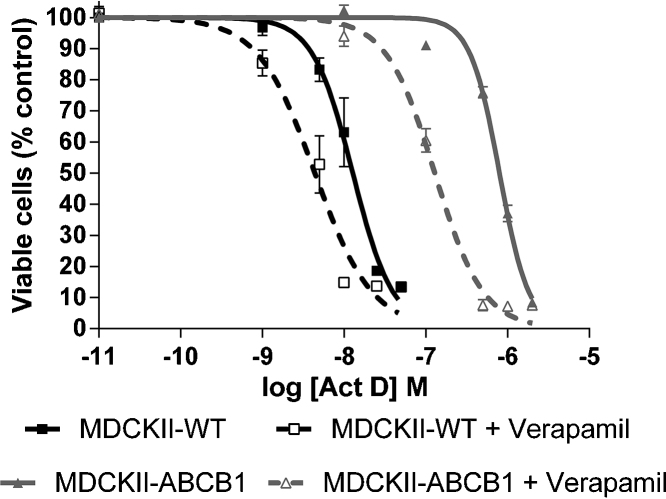
Growth inhibitory effects of Act D (0–10 μM) in MDCKII-WT and MDCKII-ABCB1 cells either alone or in the presence of verapamil (1 μM). Each point represents mean ± SEM from ≥3 experiments.
Table 1.
Growth inhibitory effects of Act D in MDCKII cell lines over-expressing specific drug transporters.
| MDCKII-WT |
MDCKII-ABCB1 |
MDCKII-ABCC1 |
MDCKII-ABCC2 |
MDCKII-ABCG2 |
||||||
|---|---|---|---|---|---|---|---|---|---|---|
| GI50 (nM) | 95% CI | GI50 (nM) | 95% CI | GI50 (nM) | 95% CI | GI50 (nM) | 95% CI | GI50 (nM) | 95% CI | |
| Act D | 12.7 | – | 745 | (680.8, 905.3) | 25.7 | (18.3, 36.1) | 40.4 | (32.2, 50.7) | 14.0 | (11.7, 16.8) |
| Act D + verapamil | 4.4 | (3.31, 5.85) | 129 | (109.8, 150.5) | – | – | – | – | – | – |
| Act D + MK571 | 4.1 | (3.02, 5.55) | – | – | 5.90 | (3.35, 10.4) | 32.3 | 23.3, 44.7) | – | – |
| Act D + KO143 | 13.1 | (10.2, 16.9) | – | – | – | – | – | – | 13.0 | (10.3, 15.4) |
–, not applicable.
GI50 assessed by MTS assay after 72 h of drug exposure. Values are the mean of ≥3 experiments.
Both ABCC1 (Fig. 2A) and ABCC2 (Fig. 2B) over-expressing cell lines showed reduced sensitivity to Act D compared to the parental cell line. GI50 values were 25.7 nM for ABCC1 and 40.4 nM for ABCC2, compared to the parental GI50 of 12.7 nM (p < 0.0001, Table 1), indicating that Act D may be a substrate for ABCC1 and ABCC2. To further investigate this, experiments were carried out with the pan ABCC family inhibitor MK571. MK571 (25 μM) increased sensitivity to Act D by 3-fold in the parental cell line (p < 0.0001), whilst a greater than 4-fold increase was seen in MDCKII-ABCC1 (p < 0.0001). There was no effect on the sensitivity of the MDCKII-ABCC2 cell line (p = 0.23) (Fig. 2C–E and Table 1).
Fig. 2.
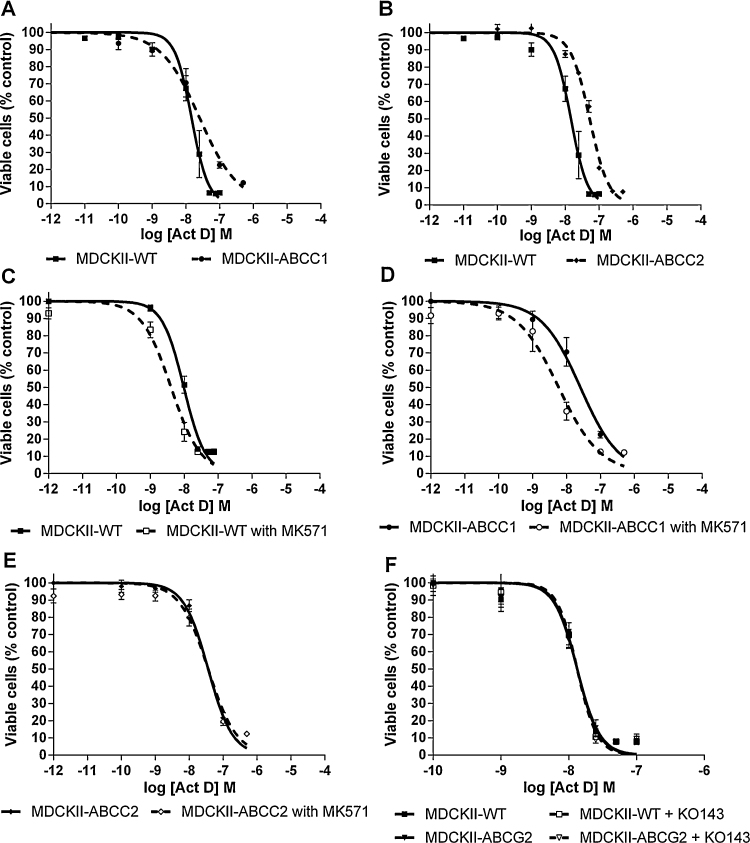
Growth inhibition of Act D (0–10 μM) in MDCKII-WT and MDCKII-ABCC1 (A), MDCKII-ABCC2 (B) and MDCKII-ABCG2 (F) cells alone or in the presence of a transporter inhibitor (ABCC1/ABCC2 – MK571 (25 μM), ABCG2 – KO143 (0.2 μM)) (C, D, E and F). Each point represents mean ± SEM from ≥3 experiments.
No difference in sensitivity was observed between the parental cell line and ABCG2 over-expressing cells, when incubated with Act D alone or in combination with the specific ABCG2 inhibitor KO143 (p = 0.74; Fig. 2F and Table 1).
3.2. Intracellular accumulation of Act D in MDCKII cell lines
To confirm the results obtained from growth inhibition experiments, intracellular accumulation of Act D was investigated in all cell lines. When incubated for between 2 and 12 h with Act D alone, a time-dependent accumulation of Act D was observed in all cell lines (Fig. 3A). Accumulation of Act D was 9.8-fold lower in MDCKII-ABCB1, compared to the parental cell line (0.1 nM vs. 0.98 nM, p < 0.0001, Fig. 3A and Table 2). Intracellular Act D concentrations in MDCKII-ABCB1 cells were significantly lower than WT at 4 h (p < 0.05), 6 h (p < 0.0001) and 12 h (p < 0.0001). When co-incubated with verapamil, intracellular levels of Act D increased in a concentration-dependent manner, indicating that Act D efflux is reduced in the presence of ABCB1 inhibition (Fig. 3B). Treating MDCKII-ABCB1 cells with 10 μM verapamil caused a 7.9-fold increase in intracellular Act D (p < 0.01). Reversal of resistance was achieved with verapamil concentrations of 10 μM or greater.
Fig. 3.
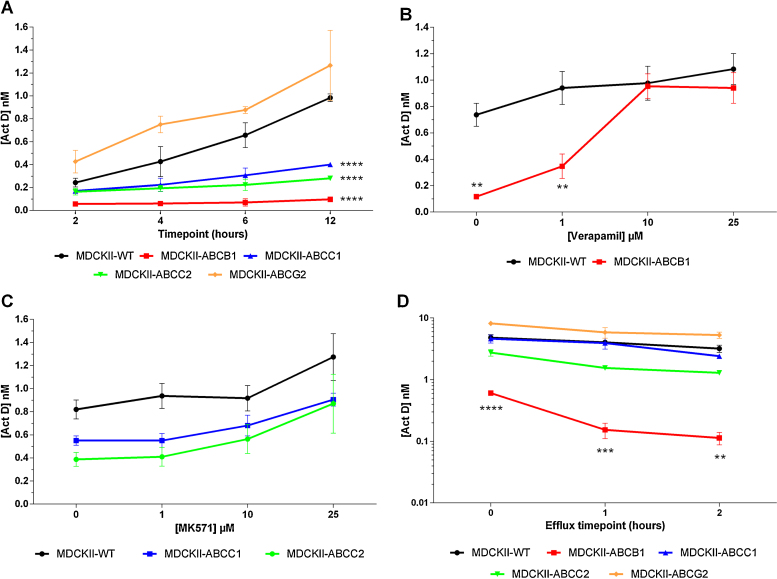
Intracellular accumulation of Act D following incubation with Act D (0.01 μM) over 12 h in MDCKII-WT, MDCKII-ABCB1, MDCKII-ABCC1, MDCKII-ABCC2 and MDCKII-ABCG2 cell lines (A). Intracellular accumulation with Act D (0.1 μM) over 4 h in the presence of a specific inhibitor (ABCB1 – verapamil, ABCC1/ABCC2 – MK571, ABCG2 – KO143), with MDCKII-WT and MDCKII-ABCB1 (B) and MDCKII-WT, MDCKII-ABCC1 and MDCKII-ABCC2 (C). Cellular efflux after a 4 h incubation with 0.1 μM Act D in all MDCKII cell lines (D). Each point represents mean ± SEM from ≥3 experiments. **p < 0.01, ***p < 0.001, ****p < 0.0001 compared with MDCKII-WT at the same time point.
Table 2.
Act D plasma concentrations and pharmacokinetic parameters in WT, Abcb1a/1b−/− and Abcc2−/− mice following intravenous administration of 0.5 mg/kg Act D.
| Act D concentration (μg/L) |
|||
|---|---|---|---|
| WT | Abcb1a/1b−/− | Abcc2−/− | |
| 0.25 h | 68.6 ± 15.6 | 96.7 ± 12.0* | 48.0 ± 11.1 |
| 0.5 h | 43.3 ± 7.68 | 71.6 ± 12.3* | 37.7 ± 6.07 |
| 2 h | 25.8 ± 4.78 | 35.8 ± 2.01 | 16.3 ± 3.73 |
| 6 h | 6.0 ± 0.65 | 20.1 ± 0.78 | 8.6 ± 0.96 |
| AUC0–6 h (μg/L h) | 151.5 | 242.0 | 114.8 |
| AUC0–∞ (μg/L h) | 168.1 | 322.6 | 145.2 |
| Cmax (μg/L) | 68.6 ± 15.6 | 96.7 ± 12.0 | 48.0 ± 11.1 |
| Tmax (h) | 0.25 | 0.25 | 0.25 |
| t1/2 (h) | 1.92 | 2.78 | 2.46 |
Individual plasma concentration time points are mean ± SD from 3 mice.
p < 0.05 compared to the WT.
Accumulation studies over 12 h indicated that Act D is also transported by ABCC1 and ABCC2, with 2.5-fold and 3.5-fold lower accumulation respectively, compared to the parental cell line (p < 0.0001; Fig. 3A). Intracellular Act D concentrations in MDCKII-ABCC1 cells were significantly lower than WT at 12 h (p < 0.0001). Intracellular Act D concentrations in MDCKII-ABCC2 cells were significantly lower than WT at 6 h (p < 0.01) and 12 h (p < 0.0001). A small trend of increased accumulation, compared to the absence of inhibitor (1.2-fold in MDCKII-ABCC1 and 1.4-fold in MDCKII-ABCC2) was seen when co-incubating Act D with MK571, but was not statistically significant (Fig. 3C).
Act D accumulation in MDCKII-ABCG2 cell lines was not different to WT cells (Fig. 3A) and no effect was seen with co-incubation of Act D and KO143 (data not shown).
3.3. Cellular efflux of Act D in MDCKII cell lines
To further confirm results from both the GI and intracellular accumulation assays, Act D efflux from cell lines was assessed following a 4 h initial uptake period. Over a 2 h period following drug removal, a time-dependent reduction in intracellular Act D was seen in all cell lines. MDCKII-ABCB1 cellular efflux was again the most pronounced, with a 5.5-fold reduction over 2 h (Fig. 3D, p < 0.01). Intracellular Act D concentrations in MDCKII-ABCB1 cells were significantly lower than WT at 0 h (p < 0.0001), 1 h (p < 0.001) and 2 h (p < 0.01). In support of both GI and intracellular accumulation assay data, efflux over 2 h in MDCKII-ABCC1 and MDCKII-ABCC2 cells was greater than the parental cell line with a 1.9- and 2.1-fold reduction in intracellular Act D respectively (Fig. 3D). Although, intracellular Act D was 1.5-fold higher in MDCKII-ABCG2 cells after 2 h, this difference was not statistically significant.
3.4. Drug transport competition assay using the fluorescent ABCB1 substrate doxorubicin and Act D
Competition for ABCB1-mediated efflux was used to confirm the results obtained from Act D growth inhibition and intracellular drug accumulation experiments (Fig. 4). Pre-incubation with Act D (0–100 μM) resulted in an increase in intracellular levels of the fluorescent ABCB1 substrate doxorubicin. Intracellular doxorubicin levels in the parental cells plateaued at low Act D concentrations (0.1–1 μM), whereas in the ABCB1 over-expressing cell line concentrations of 1–25 μM were required to maximally inhibit doxorubicin efflux.
Fig. 4.
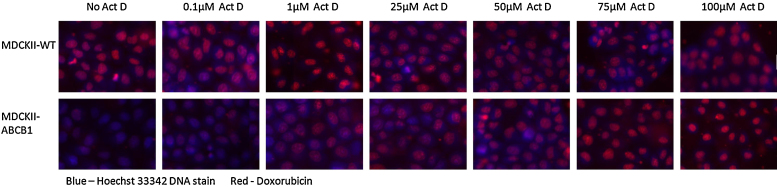
Act D competition assay using the fluorescent ABCB1 substrate doxorubicin. MDCKII-WT and MDCKII-ABCB1 cell lines were pre-incubated with varying levels of Act D for 1 h and 10 μM of fluorescent ABCB1 substrate doxorubicin was added for a further 1 h, to assess doxorubicin efflux in the presence of Act D.
3.5. Impact of Abcb1a and Abcc2 on plasma pharmacokinetics of Act D
To investigate the role of Abcb1a/1b and Abcc2 on the pharmacokinetics of Act D, Act D was administered at a dose of 0.5 mg/kg to WT, Abcb1a/1b−/− and Abcc2−/− mice and blood samples were taken at 15 min, 30 min, 2 h and 6 h. Plasma concentrations were consistently higher in Abcb1a/1b−/− mice than WT (Fig. 5A and Table 2) over the 6 h period. The Cmax at 15 min was 1.4-fold higher in Abcb1a/1b−/− mice compared to WT (96.7 vs. 68.6 μg/L, p < 0.05) and at 30 min, the difference was 1.7-fold (71.6 vs. 43.3 μg/L, p < 0.05). Abcb1a/1b−/− mice had a 1.6-fold higher AUC0–6 h (AUC0–6 h; 242 vs. 152 μg/L h). In addition, the elimination half-life (t1/2) was 1.5-fold longer in Abcb1a/1b−/− mice, resulting in a 1.9-fold greater AUC0–∞ (323 vs. 168 μg/L h). The absence of systemic Abcb1a/1b is associated with a reduced rate of elimination of Act D and a higher overall drug exposure.
Fig. 5.
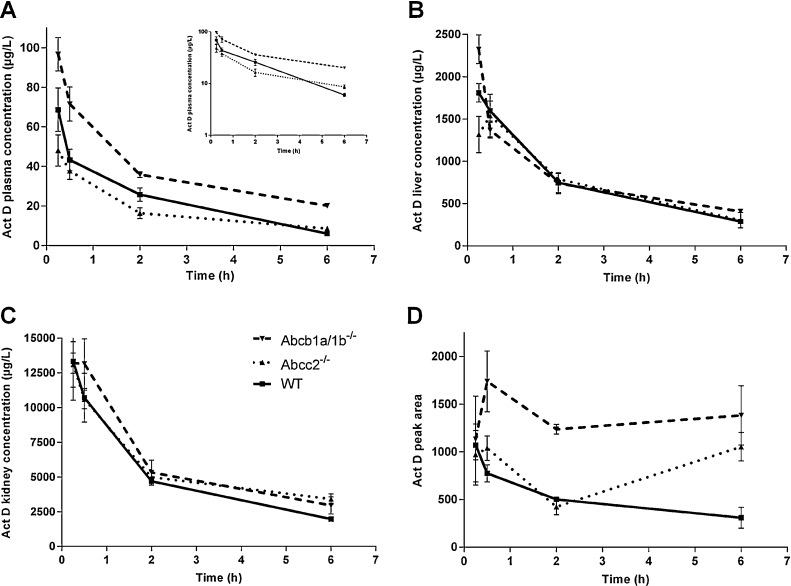
Act D (0.5 mg/kg) was administered to wild-type, Abcb1a/1b−/− and Abcc2−/− mice. Blood (A), liver (B), kidney (C) and brain (D) samples were taken at 15 min, 30 min, 2 h and 6 h and Act D concentrations were determined by LC/MS analysis. (A) Inset – semi-logarithmic representation of data. Each point represents mean ± SEM from 3 mice.
In contrast to Abcb1a/1b−/− mice, Abcc2−/− mice generally had lower plasma concentrations of Act D than WT (Fig. 5A), however this difference did not reach statistical significance. AUC0–6 h and Cmax values in Abcc2−/− mice were lower than in WT mice (115 vs. 152 μg/L h and 48.0 vs. 68.6 μg/L in Abcc2−/− and WT mice, respectively). The t1/2 in Abcc2−/− mice was longer than in the parental (2.46 vs. 1.92 h), and consequently a similar AUC0–∞ for parental and Abcc2−/− was observed (168 vs. 145 μg/L h).
3.6. Effect of Abcb1a and Abcc2 on tissue disposition of Act D
Act D liver concentrations were comparable between knockout and WT mice over the 6 h period (Fig. 5B and Table 3), with no significant overall effect of ABC transporter knockout on disposition in the liver. Similarly in the kidneys, comparable AUC0–6 h and Cmax values were observed in knockout and WT mice (Fig. 5C and Table 3). Act D brain uptake was comparable between different groups at 15 min (Fig. 5D and Table 3). This was followed by a time-dependent decrease in Act D brain concentration in WT mice. In contrast, Act D concentrations in brain tissue of Abcb1a/1b−/− and Abcc2−/− mice were maintained over 6 h, resulting in 2.3- and 1.3-fold higher AUC0–6 h respectively compared to WT, (6802 and 3785 vs. 2943 pa/g h). Act D levels in brain tissue of Abcb1a/1b−/− mice were significantly higher than those in WT mice at 6 h (p < 0.05).
Table 3.
Act D tissue disposition concentrations and pharmacokinetic parameters in WT, Abcb1a/1b−/− and Abcc2−/− mice following intravenous administration of 0.5 mg/kg Act D.
| Liver concentration (μg/L) |
Kidney concentration (μg/L) |
Brain peak area (pa) |
|||||||
|---|---|---|---|---|---|---|---|---|---|
| WT | Abcb1a/1b−/− | Abcc2−/− | WT | Abcb1a/1b−/− | Abcc2−/− | WT | Abcb1a/1b−/− | Abcc2−/− | |
| 0.25 h | 1810 ± 155 | 2323 ± 239 | 1317 ± 302 | 13,323 ± 3960 | 13,207 ± 1025 | 13,107 ± 2318 | 1071 ± 217 | 1134 ± 635 | 972 ± 455 |
| 0.5 h | 1593 ± 167 | 1367 ± 133 | 1540 ± 356 | 10,713 ± 2498 | 13,163 ± 2521 | 10,593 ± 944 | 775.3 ± 127 | 1420 ± 521 | 1039 ± 181 |
| 2 h | 747 ± 165 | 737 ± 172 | 787 ± 99 | 4693 ± 415 | 5327 ± 1257 | 4987 ± 161 | 501 ± 28.9 | 912.7 ± 461 | 424.3 ± 120 |
| 6 h | 287 ± 40 | 407 ± 9 | 303 ± 128 | 1970 ± 150 | 2957 ± 872 | 3410 ± 527 | 309 ± 156 | 1383 ± 439 | 733 ± 470 |
| AUC0–6 h (μg/L h) | 4473 | 4616 | 4445 | 29,552 | 35,381 | 33,079 | 2943 | 6802 | 3785 |
| AUC0–∞ (μg/L h) | 5387 | 6594 | 5516 | 35,754 | 46,701 | 48,799 | ND | ND | ND |
| Cmax (μg/L) | 1810 ± 155 | 2323 ± 239 | 1540 ± 356 | 13,323 ± 3960 | 13,207 ± 1025 | 13,107 ± 2318 | 1071 ± 217 | 1420 ± 521 | 1039 ± 181 |
| Tmax (h) | 0.25 | 0.25 | 0.5 | 0.25 | 0.25 | 0.25 | 0.25 | 0.5 | 0.5 |
| t1/2 (h) | 2.21 | 3.37 | 2.44 | 2.18 | 2.65 | 3.2 | ND | ND | ND |
Individual tissue concentration time points are expressed per gram of tissue and are the mean ± SD from 3 mice. All brain data is expressed as peak area. ND, no data.
4. Discussion
Despite Act D being used clinically for over 40 years, little is known about its clinical pharmacology. To learn more about Act D disposition, an initial pharmacokinetic study carried out by our group demonstrated the extent of variation in Act D exposure in a paediatric patient population [10]. A >4-fold range in area under plasma concentration–time curve (AUC0–6 h) between patients was observed and a correlation was seen between higher Act D exposure and toxicity. Patient age at treatment has been highlighted as a risk factor for Act D mediated toxicity, with greater toxicity seen in patients younger than 3 years of age [10,26], whilst a more recent study has indicated an increased risk for patients <1 year old [8].
Initial investigations into Act D pharmacokinetics indicate rapid elimination following intravenous administration and accumulation in nucleated cells, with little of the administered drug excreted or metabolised [27,28]. Characterisation of the transport of Act D by ABC transporters may represent an important step in understanding the inter-patient variability in Act D pharmacokinetics and treatment-related toxicities [6–10]. Cellular resistance to Act D was originally reported by Biedler et al. in a Chinese hamster ovary model [17], which was later confirmed to be caused by a cell surface p-glycoprotein [18]. However, transport by ABCB1 or other ABC transporters has not been fully characterised.
In the current study the transport of Act D by a number of ABC transporters was investigated. Using the well-studied MDCKII cell line model, we initially confirmed that Act D is a substrate for ABCB1 through growth inhibition assays, with a 59-fold difference in sensitivity between the parental and ABCB1 over-expressing cell line. This indicates that Act D is effluxed from MDCKII-ABCB1 cells, therefore decreasing its growth inhibitory effect. Verapamil was subsequently used to successfully reverse this resistance, confirming the role of ABCB1 in decreasing the growth inhibitory effect. While a complete reversal of the difference in sensitivity was not observed in the ABCB1 over-expressing cells, this is likely to be due to the requirement for a relatively low concentration of verapamil of 1 μM to be used in these experiments, to avoid any effects of verapamil itself on cell viability over the 72 h drug incubation period. With regard to the use of verapamil for these experiments, it should also be noted that in addition to its activity as an inhibitor of ABCB1, verapamil has also been shown to exhibit inhibitory effects against ABCC1 [29].
Transport was further investigated by looking directly at intracellular concentrations of Act D in MDCKII-WT and MDCKII-ABCB1 cell lines. A 7.9-fold lower intracellular accumulation was observed in cells over-expressing ABCB1 at a fixed concentration of Act D (0.01 μM) over a 12 h period, confirming that Act D was being actively removed from the MDCKII-ABCB1 cells by ABCB1. Again, verapamil was used to inhibit ABCB1-mediated transport, resulting in a concentration dependent increase in Act D accumulation in MDCKII-ABCB1 cells, with complete reversal of the ABCB1-induced efflux observed at verapamil concentrations of 10 μM and above. Cellular efflux experiments following removal of drug confirmed lower Act D accumulation in ABCB1 expressing cells, followed by a 5.5-fold time-dependent reduction in intracellular levels that was not seen in the parental cell line.
Using an uptake competition assay we demonstrated that doxorubicin fluorescence was reduced in MDCKII-ABCB1 cells, as compared to MDCKII-WT cells, due to efflux of this well established ABCB1 substrate. Incubating cells with increasing concentrations of Act D resulted in competition for ABCB1 efflux, inhibiting doxorubicin removal from cells. This caused an increase in doxorubicin fluorescence in both cell lines, further confirming Act D as an ABCB1 substrate. Due to the over-expression of ABCB1, a greater concentration of Act D was required to saturate the transporter and prevent doxorubicin efflux in MDCKII-ABCB1 cells compared to MDCKII-WT. These four independent assessments illustrate the importance of ABCB1 expression for the pharmacology of Act D.
Growth inhibition assays showed a reduction in sensitivity in both MDCKII-ABCC1 and MDCKII-ABCC2 cells when treated with Act D. Over 12 h, accumulation of Act D was significantly lower in both MDCKII-ABCC1 (2.45-fold) and MDCKII-ABCC2 (3.5-fold) cell lines, compared to MDCKII-WT, indicating active ABCC1- and ABCC2-mediated efflux. Although the pan ABCC family inhibitor MK571 caused a concentration-dependent increase in Act D accumulation in both the ABCC1 and ABCC2 over-expressing cell lines, this was not significant. In cellular efflux experiments a significant time-dependent reduction in intracellular Act D was observed over 1 h in ABCC2 over-expressing cells (1.8-fold), compared to the parental cell line, further supporting the GI and intracellular accumulation assay data suggesting ABCC2-mediated transport. No evidence of Act D transport by ABCG2 was found during growth inhibition, intracellular accumulation or cellular efflux assays.
Transport of anti-cancer agents in animal models is well characterised and a number of appropriate models are available [15,30–32]. To assess the potential clinical impact of this work, pharmacokinetic studies were carried out with Act D (0.5 mg/kg) in Abcb1a/1b and Abcc2 knockout mice. Act D plasma concentrations in Abcb1a/1b−/− were consistently higher than WT over a 6 h period following drug administration, resulting in a 1.6-fold higher AUC0–6 h. Half-life was also longer in Abcb1a/1b−/− mice, and the AUC0–∞ was 1.9-fold higher than that in the WT. Thus, Abcb1a/1b knockout had a significant impact on Act D elimination, resulting in higher plasma concentrations compared to WT.
Interestingly, higher Act D accumulation was not seen in either the liver or kidneys of Abcb1a/1b−/− mice. Although higher liver concentrations were initially observed in Abcb1a/1b−/− mice at 15 min, Act D liver concentrations decreased over the 6 h in all mice variants, and consequently no differences in AUC0–6 h were observed. Contrary to both liver and kidney data, higher concentrations of Act D were seen in brain tissue from Abcb1a/1b−/− compared to WT. Over the 6 h studied, a time-dependent reduction in Act D brain concentration was seen in WT mice, whereas Act D levels in the brain of Abcb1a/1b−/− mice were maintained. Overall exposure to the brain over a 6 h period was 2.3-fold higher in Abcb1a/1b−/− mice versus WT.
Mean plasma concentrations in Abcc2−/− mice were consistently lower than those in WT, however this difference was not significant. Similarly there were no significant differences in tissue distribution between the knockout animals and WT.
The data presented in the current study confirm that Act D is transported by ABCB1 and to some extent ABCC1 and ABCC2 in vitro. Knockout of both Abcb1a and Abcb1b reduces the elimination of Act D from plasma, resulting in higher plasma concentrations. Interestingly these higher plasma concentrations did not affect tissue accumulation in the liver or kidneys, but did appear to alter penetration across the blood–brain barrier brain. Conversely, there was minimal effect of Abcc2 knockout on Act D plasma concentrations. The absence of differences in distribution to liver and kidneys of bcb1a/1b−/− mice may be due to the reciprocal expression of Abcc2. An investigation using a double knockout mouse model (Abcb1a/1b−/−, Abcc2−/−) may therefore be informative.
Irrespective of transporter knockout genotype, Act D accumulation over 6 h in the kidneys was 6.6- to 7.7-fold higher than the liver, potentially identifying the kidney as the primary route for Act D elimination from the body. This would be in agreement with previous studies which have failed to identify Act D metabolites in clinical samples.
As Abcb1a/1b has been shown to be involved in the in vivo disposition of Act D, it would be important to investigate whether common single nucleotide polymorphisms (SNPs) in ABCB1 could be responsible for inter-patient variation in Act D exposure. Correlating clinical parameters to patient genotype could potentially have great clinical benefit in predicting response and toxicity, leading to dose individualisation based on pharmacogenetic variation. The findings from the current study will feed directly into a national clinical trial investigating the pharmacokinetics and pharmacogenetics of Act D in children with cancer in the UK.
Acknowledgment
This work was funded by Cancer Research UK.
References
- 1.Waksman S.A., Woodruff H.B. Bacteriostatic and bactericidal substances produced by a soil Actinomyces. Proc Soc Exp Biol Med. 1940;45:609–614. [Google Scholar]
- 2.Mitchell C., Jones P.M., Kelsey A., Vujanic G.M., Marsden B., Shannon R. The treatment of Wilms’ tumour: results of the United Kingdom Children's cancer study group (UKCCSG) second Wilms’ tumour study. Br J Cancer. 2000;83:602–608. doi: 10.1054/bjoc.2000.1338. [DOI] [PMC free article] [PubMed] [Google Scholar]
- 3.Metzger M.L., Dome J.S. Current therapy for Wilms’ tumor. Oncologist. 2005;10:815–826. doi: 10.1634/theoncologist.10-10-815. [DOI] [PubMed] [Google Scholar]
- 4.Goldberg I.H., Rabinowitz M., Reich E. Basis of actinomycin action. I. DNA binding and inhibition of RNA-polymerase synthetic reactions by actinomycin. Proc Natl Acad Sci U S A. 1962;48:2094–2101. doi: 10.1073/pnas.48.12.2094. [DOI] [PMC free article] [PubMed] [Google Scholar]
- 5.Goldberg I.H., Rabinowitz M., Reich E. Basis of Actinomycin action. II. Effect of actinomycin on the nucleotide triphosphate–inorganic pyrophosphate exchange. Proc Natl Acad Sci U S A. 1962;49:226–229. doi: 10.1073/pnas.49.2.226. [DOI] [PMC free article] [PubMed] [Google Scholar]
- 6.Green D.M., Finklestein J.Z., Norkool P., D’Angio G.J. Severe hepatic toxicity after treatment with single-dose dactinomycin and vincristine. A report of the National Wilms’ Tumor Study. Cancer. 1988;62:270–273. doi: 10.1002/1097-0142(19880715)62:2<270::aid-cncr2820620208>3.0.co;2-b. [DOI] [PubMed] [Google Scholar]
- 7.Raine J., Bowman A., Wallendszus K., Pritchard J. Hepatopathy–thrombocytopenia syndrome – a complication of dactinomycin therapy for Wilms’ tumor: a report from the United Kingdom Childrens Cancer Study Group. J Clin Oncol. 1991;9:268–273. doi: 10.1200/JCO.1991.9.2.268. [DOI] [PubMed] [Google Scholar]
- 8.Bisogno G., de Kraker J., Weirich A., Masiero L., Ludwig R., Tournade M.F. Veno-occlusive disease of the liver in children treated for Wilms tumor. Med Pediatr Oncol. 1997;29:245–251. doi: 10.1002/(sici)1096-911x(199710)29:4<245::aid-mpo2>3.0.co;2-m. [DOI] [PubMed] [Google Scholar]
- 9.Langholz B., Skolnik J.M., Barrett J.S., Renbarger J., Seibel N.L., Zajicek A. Dactinomycin and vincristine toxicity in the treatment of childhood cancer: a retrospective study from the Children's Oncology Group. Pediatr Blood Cancer. 2011;57:252–257. doi: 10.1002/pbc.22882. [DOI] [PMC free article] [PubMed] [Google Scholar]
- 10.Veal G.J., Cole M., Errington J., Parry A., Hale J., Pearson A.D. Pharmacokinetics of dactinomycin in a pediatric patient population: a United Kingdom Children's Cancer Study Group Study. Clin Cancer Res. 2005;11:5893–5899. doi: 10.1158/1078-0432.CCR-04-2546. [DOI] [PubMed] [Google Scholar]
- 11.Ho R.H., Kim R.B. Transporters and drug therapy: implications for drug disposition and disease. Clin Pharmacol Ther. 2005;78:260–277. doi: 10.1016/j.clpt.2005.05.011. [DOI] [PubMed] [Google Scholar]
- 12.Schinkel A.H., Wagenaar E., Mol C.A., van Deemter L. P-glycoprotein in the blood–brain barrier of mice influences the brain penetration and pharmacological activity of many drugs. J Clin Invest. 1996;97:2517–2524. doi: 10.1172/JCI118699. [DOI] [PMC free article] [PubMed] [Google Scholar]
- 13.Melaine N., Lienard M.O., Dorval I., Le Goascogne C., Lejeune H., Jegou B. Multidrug resistance genes and p-glycoprotein in the testis of the rat, mouse, guinea pig, and human. Biol Reprod. 2002;67:1699–1707. doi: 10.1095/biolreprod.102.003558. [DOI] [PubMed] [Google Scholar]
- 14.Borst P., Elferink R.O. Mammalian ABC transporters in health and disease. Annu Rev Biochem. 2002;71:537–592. doi: 10.1146/annurev.biochem.71.102301.093055. [DOI] [PubMed] [Google Scholar]
- 15.Lagas J.S., Fan L., Wagenaar E., Vlaming M.L., van Tellingen O., Beijnen J.H. P-glycoprotein (P-gp/Abcb1), Abcc2, and Abcc3 determine the pharmacokinetics of etoposide. Clin Cancer Res. 2002;16:130–140. doi: 10.1158/1078-0432.CCR-09-1321. [DOI] [PubMed] [Google Scholar]
- 16.Lal S., Wong Z.W., Sandanaraj E., Xiang X., Ang P.C., Lee E.J. Influence of ABCB1 and ABCG2 polymorphisms on doxorubicin disposition in Asian breast cancer patients. Cancer Sci. 2008;99:816–823. doi: 10.1111/j.1349-7006.2008.00744.x. [DOI] [PMC free article] [PubMed] [Google Scholar]
- 17.Biedler J.L., Riehm H. Cellular resistance to actinomycin D in Chinese hamster cells in vitro: cross-resistance, radioautographic, and cytogenetic studies. Cancer Res. 1970;30:1174–1184. [PubMed] [Google Scholar]
- 18.Juliano R.L., Ling V. A surface glycoprotein modulating drug permeability in Chinese hamster ovary cell mutants. Biochim Biophys Acta. 1976;455:152–162. doi: 10.1016/0005-2736(76)90160-7. [DOI] [PubMed] [Google Scholar]
- 19.Polli J.W., Wring S.A., Humphreys J.E., Huang L., Morgan J.B., Webster L.O. Rational use of in vitro p-glycoprotein assays in drug discovery. J Pharmacol Exp Ther. 2001;299:620–628. [PubMed] [Google Scholar]
- 20.Lin X., Skolnik S., Chen X., Wang J. Attenuation of intestinal absorption by major efflux transporters: quantitative tools and strategies using a Caco-2 model. Drug Metab Dispos. 2011;39:265–274. doi: 10.1124/dmd.110.034629. [DOI] [PubMed] [Google Scholar]
- 21.Workman P., Aboagye E.O., Balkwill F., Balmain A., Bruder G., Chaplin D.J. Guidelines for the welfare and use of animals in cancer research. Br J Cancer. 2010;102:1555–1577. doi: 10.1038/sj.bjc.6605642. [DOI] [PMC free article] [PubMed] [Google Scholar]
- 22.Schinkel A.H., Smit J.J., van Tellingen O., Beijnen J.H., Wagenaar E., van Deemter L. Disruption of the mouse mdr1a P-glycoprotein gene leads to a deficiency in the blood–brain barrier and to increased sensitivity to drugs. Cell. 1994;77:491–502. doi: 10.1016/0092-8674(94)90212-7. [DOI] [PubMed] [Google Scholar]
- 23.Schinkel A.H., Mayer U., Wagenaar E., Mol C.A., van Deemter L., Smit J.J. Normal viability and altered pharmacokinetics in mice lacking mdr1-type (drug-transporting) P-glycoproteins. Proc Natl Acad Sci U S A. 1997;94:4028–4033. doi: 10.1073/pnas.94.8.4028. [DOI] [PMC free article] [PubMed] [Google Scholar]
- 24.Vlaming M.L., Mohrmann K., Wagenaar E., de Waart D.R., Elferink R.P., Lagas J.S. Carcinogen and anticancer drug transport by Mrp2 in vivo: studies using Mrp2 (Abcc2) knockout mice. J Pharmacol Exp Ther. 2006;318:319–327. doi: 10.1124/jpet.106.101774. [DOI] [PubMed] [Google Scholar]
- 25.Veal G.J., Errington J., Sludden J., Griffin M.J., Price L., Parry A. Determination of anti-cancer drug actinomycin D in human plasma by liquid chromatography–mass spectrometry. J Chromatogr B Analyt Technol Biomed Life Sci. 2003;795:237–243. doi: 10.1016/s1570-0232(03)00573-7. [DOI] [PubMed] [Google Scholar]
- 26.Arndt C., Hawkins D., Anderson J.R., Breitfeld P., Womer R., Meyer W. Age is a risk factor for chemotherapy-induced hepatopathy with vincristine, dactinomycin, and cyclophosphamide. J Clin Oncol. 2004;22:1894–1901. doi: 10.1200/JCO.2004.08.075. [DOI] [PubMed] [Google Scholar]
- 27.Galbraith W.M., Mellett L.B. Tissue disposition of 3H-actinomycin D (NSC-3053) in the rat, monkey, and dog. Cancer Chemother Rep. 1975;59:1601–1609. [PubMed] [Google Scholar]
- 28.Tattersall M.H., Sodergren J.E., Dengupta S.K., Trites D.H., Modest E.J., Frei E., 3rd. Pharmacokinetics of actinoymcin D in patients with malignant melanoma. Clin Pharmacol Ther. 1975;17:701–708. doi: 10.1002/cpt1975176701. [DOI] [PubMed] [Google Scholar]
- 29.Wong I.L., Chan K.F., Tsang K.H., Lam C.Y., Zhao Y., Chan T.H. Modulation of multidrug resistance protein 1 (MRP1/ABCC1)-mediated multidrug resistance by bivalent apigenin homodimers and their derivatives. J Med Chem. 2009;52:5311–5322. doi: 10.1021/jm900194w. [DOI] [PubMed] [Google Scholar]
- 30.Lagas J.S., van Waterschoot R.A., van Tilburg V.A., Hillebrand M.J., Lankheet N., Rosing H. Brain accumulation of dasatinib is restricted by P-glycoprotein (ABCB1) and breast cancer resistance protein (ABCG2) and can be enhanced by elacridar treatment. Clin Cancer Res. 2009;15:2344–2351. doi: 10.1158/1078-0432.CCR-08-2253. [DOI] [PubMed] [Google Scholar]
- 31.Poller B., Iusuf D., Sparidans R.W., Wagenaar E., Beijnen J.H., Schinkel A.H. Differential impact of P-glycoprotein (ABCB1) and breast cancer resistance protein (ABCG2) on axitinib brain accumulation and oral plasma pharmacokinetics. Drug Metab Dispos. 2011;39:729–735. doi: 10.1124/dmd.110.037317. [DOI] [PubMed] [Google Scholar]
- 32.Tang S.C., Lagas J.S., Lankheet N.A., Poller B., Hillebrand M.J., Rosing H. Brain accumulation of sunitinib is restricted by P-glycoprotein (ABCB1) and breast cancer resistance protein (ABCG2) and can be enhanced by oral elacridar and sunitinib coadministration. Int J Cancer. 2012;130:223–233. doi: 10.1002/ijc.26000. [DOI] [PubMed] [Google Scholar]