

Summary
Neurons in cortical sensory areas respond selectively to sensory stimuli, and the preferred stimulus typically varies among neurons so as to continuously span the sensory space. However, some neurons reflect sensory features that are learned or task-dependent. For example, neurons in the lateral intraparietal area (LIP) reflect learned associations between visual stimuli. One might expect roughly even numbers of LIP neurons would prefer each set of associated stimuli. However, in two associative learning experiments and a perceptual decision experiment, we found striking asymmetries: nearly all neurons recorded from an animal had a similar order of preference among associated stimuli. Behavioral factors could not account for these neuronal biases. A recent computational study proposed that population-firing patterns in parietal cortex have “one-dimensional” dynamics on long time scales, a possible consequence of recurrent connections that could drive persistent activity. One-dimensional dynamics would predict the biases in selectivity that we observed.
Introduction
It has long been appreciated that sensory neurons in the brain respond selectively along particular sensory dimensions. In the case of visual cortex, neurons can be found that respond selectively to orientation, direction, color, and depth (Hubel, 1988). Typically, the preferred stimuli of selective neurons are distributed across a wide range of the stimulus space. For example, neurons in primary visual cortex have preferred orientations that fall throughout the full 180° range of orientations (Hubel and Wiesel, 1962), direction-selective neurons in the middle temporal area have nearly evenly distributed preferred directions and speeds (DeAngelis and Uka, 2003), and neurons in areas of V4 and inferotemporal cortex have a wide distribution of preferred color (Conway and Tsao, 2009) or preferred visual form (Hegde and Van Essen, 2007; Lehky et al., 2011). These broad distributions of preferred features presumably provide maximum sensitivity throughout the stimulus space (Purushothaman and Bradley, 2005).
Neuronal selectivity for basic visual features is an intrinsic property of many visual cortical neurons, but other forms of neuronal selectivity emerge following learning or in response to behavioral demands. For example, in monkeys trained to associate or categorize visual stimuli, some neurons respond selectively among the groups of associated stimuli. If a monkey is trained that two visual stimuli are to be associated as a pair, A, while two other stimuli are to be associated as another pair, B, after training neurons tend to fire more for one stimulus pair than the other. Such neurons are common in inferotemporal (Naya et al., 1996; Sakai and Miyashita, 1991), perirhinal (Naya et al., 2003), and prefrontal cortex (Freedman et al., 2001; Rainer et al., 1999). Neuronal activity reflecting trained associations is common during stimulus presentation and also during memory-delay periods in behavioral tasks that have a working memory requirement (Miller et al., 2002). We recently described neurons in the lateral intraparietal area (LIP) that likewise show selective activity reflecting learned associations among visual stimuli, both during visual stimulation periods and during memory-delay periods (Fitzgerald et al., 2011; Freedman and Assad, 2006). Those experiments were designed to strictly dissociate associative signals in LIP neurons from the well-known spatial/oculomotor signals in LIP (Andersen and Buneo, 2002; Goldberg et al., 2006).
An intriguing question concerns the distribution of neuronal preferences that emerge when animals are trained to associate stimuli together. In analogy to visual cortical areas that have a broad range of preferred stimuli among neurons, one might expect roughly equal numbers of neurons that prefer associated group A or that prefer associated group B. But in associative learning studies, animals only need to discriminate one discrete group/category from another; thus it is not clear what to expect about the distribution of preferred associated stimuli. The question remains open, because most previous studies of associative or categorical learning have emphasized the magnitude of the associative effect rather than its sign, that is, which particular group of associated stimuli is preferred (Freedman et al., 2001, 2002; Naya et al., 1996; Naya et al., 2001; Naya et al., 2003; Rainer et al., 1998; Roy et al., 2010; Sakai and Miyashita, 1991; Yanike et al., 2004).
To address this question, we examined the distribution of preferred groups or categories of visual stimuli in LIP neurons in two associative learning studies (Fitzgerald et al., 2011; Freedman and Assad, 2006) and in a perceptual decision study (Bennur and Gold, 2011). To our surprise, we found that the distributions of preferred groups/categories were dramatically biased within a neuronal population: nearly every LIP neuron from a given animal had the same order of preference among the associated stimuli. This was despite the fact that LIP neurons show very little bias in visual selectivity in naïve animals that have not been trained in associative learning tasks; for example, preferred directions are distributed widely among direction-selective LIP neurons recorded in passively fixating monkeys (Fanini and Assad, 2009). The striking asymmetries in the associative learning and perceptual decision tasks suggest that the dynamics of the parietal network come to dominate the firing of individual LIP neurons in certain regimes, driving the neurons toward a common pattern of firing. In fact, biases in preferred groups or categories are predicted from a recent recurrent network model for parietal cortex that was developed to explain some peculiar commonalities in the dynamics of persistent memory-period activity among individual LIP neurons (Ganguli et al., 2008). These findings suggest that understanding parietal network dynamics is at least as important as understanding firing properties of individual parietal neurons.
Results
We analyzed data from three experiments. In the first experiment, two monkeys were trained to group either six (Fitzgerald et al., 2011) or twelve (Freedman and Assad, 2006) directions of moving stimuli into two 180°-wide “categories.” In the second experiment, two animals were trained to group six arbitrarily chosen shapes into three associated pairs (Fitzgerald et al., 2011). In the third experiment monkeys reported the direction (right or left) of noisy motion stimuli (Bennur and Gold, 2011).
In the direction-categorization task, trials began with the monkey fixating its gaze and manually gripping a touch-sensitive bar (Figure 1A-B). A patch of coherently moving dots appeared in the receptive field of the neuron under study (the sample stimulus), and then following a delay period, a second patch of moving dots (the test stimulus) appeared at the same location. If the two directions belonged to the same category, the monkeys had to release the touch bar; if the two directions belonged to opposite categories, the animal had to maintain contact with the touch-bar. The shape pair-associate task was identical in structure to the direction-categorization task, except that the first and second stimuli were static shapes presented in the receptive field, and the animal determined whether the two shapes presented were from an associated pair (Figure 1C-D).
Figure 1. Direction-categorization and shape pair-association tasks.
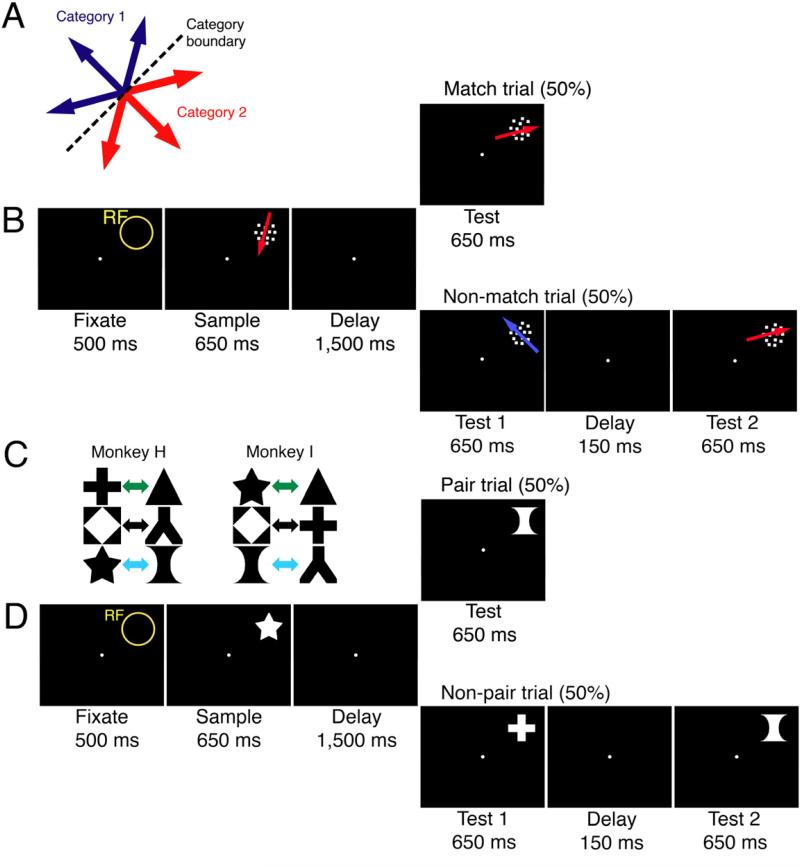
A-B. Direction-categorization task. Monkeys associated six directions into two categories.
C-D. Shape pair-association task. Monkeys associated six static shapes into three pairs. Different pairings were used for the two monkeys.
Both tasks were designed to dissociate associative/categorical signals from spatial or motor-planning effects. For one, the sample and test stimuli were placed in the same position of the receptive field for the neuron under study and subtended the same maximal visual angle. The monkeys could also not predict the upcoming required motor response during the sample-stimulus presentation and delay period, because the test stimulus was chosen at random. The monkeys were also never trained to make eye movements within the task.
After the animals were trained (generally >85% correct trials, averaged among sessions), we recorded from neurons in LIP. In both tasks, neuronal activity reflected the learned associations among stimuli. During the sample, delay, and test period, neurons tended to fire with similar rates for associated stimuli and dissimilar rates for non-associated stimuli (Figure 2A-C, 2E-G; neuronal firing traces sorted by the identity of the sample stimulus). These associative neuronal signals were previously described in detail. However, it is important to reiterate that associative signals were not due to systematic differences in the animals’ behavior for different direction categories or shape pairs, such as differences in the animals’ performance or in fixational or post-trial eye movements (Fitzgerald et al., 2011; Freedman and Assad, 2006).
Figure 2. Single neuron and population activity.
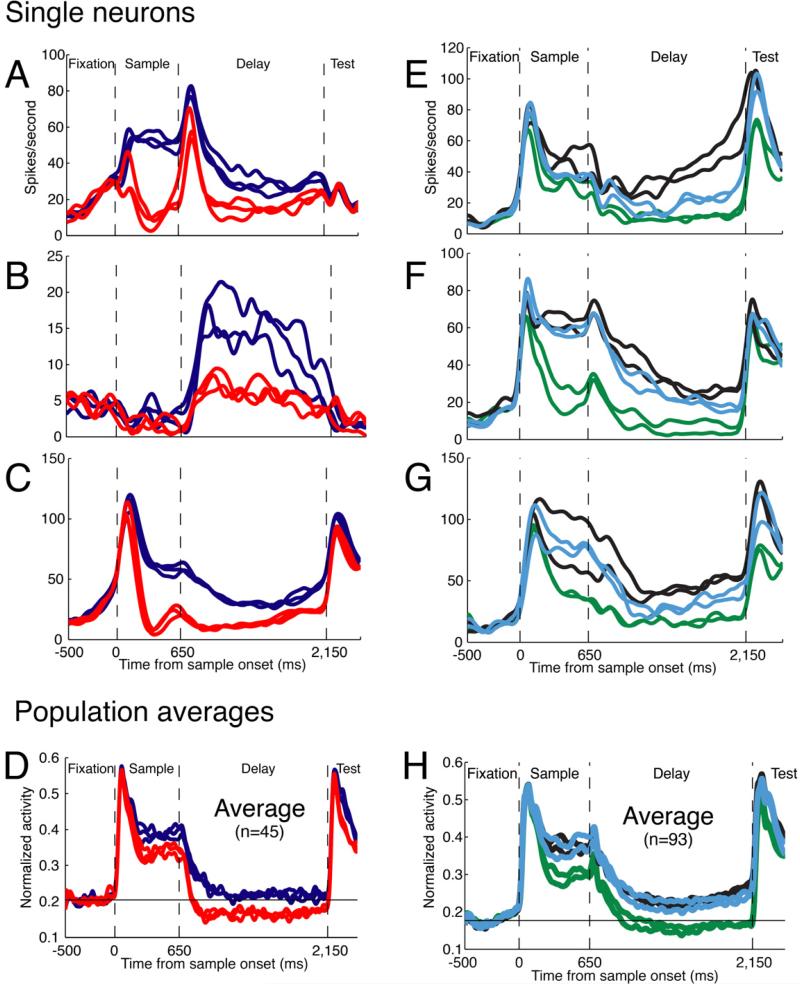
A-C. Three single neurons recorded while Monkey H performed the direction-categorization task. The six traces in each plot correspond to the mean neuronal activity evoked by each of the six directions, and the same colors indicate directions that belong to the same category.
D. The mean normalized activity recorded from the population of 45 neurons. The normalized spontaneous activity is indicated by the black horizontal line.
E-G. Three single neurons recorded while Monkey H performed the shape pair-association task. The six traces in each plot correspond to the mean neuronal activity evoked by each of the six sample shapes, and the same colors indicate associated shapes.
H. The mean normalized activity from the population of 93 recorded neurons. The normalized spontaneous activity is indicated by the black horizontal line.
Biases in preferred direction category or associated shape-pair
Across the neuronal population, we expected to see approximately equal numbers of neurons that had higher firing rates for one direction category or the other, or for one associated shape-pair or another. This would be in line with the typical broad distribution of preferred stimulus features found among visual cortical neurons. However, we were surprised to find that the preferred associations were remarkably stereotyped across a given population of neurons. Figure 2A-C shows three single neurons recorded from Monkey H during the direction-categorization task. The three neurons varied in their amplitude and dynamics of firing, yet all three had higher activity for the direction category up/left than for the direction category down/right (see Figure 1A for color key).
Figure 2E-G shows three single neurons recorded from the same monkey during the shape pair-associate task. All three neurons had highest activity for the diamond/Y pair, intermediate activity for the star/vase pair, and lowest activity for the plus/triangle pair (see Figure 1C, left for color key).
These particular patterns of selectivity were preponderant for this animal. Figures 2D and 2H show the normalized population average of all neurons recorded from Monkey H (direction categorization task: n = 45; shape-pair associate task: n = 93). The bias in selectivity emerges as a divergence of the average activity among the different associated stimuli; if the order of preference were instead randomly distributed among neurons, the population-average responses should be closely overlapping.
To examine the bias in more detail, for each neuron we rank-ordered the visual stimuli by the magnitude of the average evoked neuronal activity. We focused our analysis on those neurons that had a statistically significant selectivity for the direction categories or shape-pair associations (nested ANOVA; P < 0.01; Fitzgerald et al., 2011). This selection criterion does not introduce a bias in the pattern of selectivity, because selective neurons could in principle prefer any of the possible groups.
Figure 3A shows the rank-order of neural activity evoked by each of the six directions of the direction-categorization task, for each neuron from Monkey H. Data from the sustained sample-stimulus response (200-650 ms following motion onset) are presented in the left column, and data from the late delay period (750-1500 ms following motion offset) are presented in the right column. During the sample period, across the neuronal population there was a significant systematic asymmetry between the neuronal activity for the two direction categories (n = 31 neurons; P = 0.0025, Friedman's test, null hypothesis of equal activity for the two categories; see Methods for details). The bias was even more pronounced during the delay period (n = 24 neurons; P < 10-14, Friedman's test).
Figure 3. Rank ordering of firing rate across different directions or shapes.
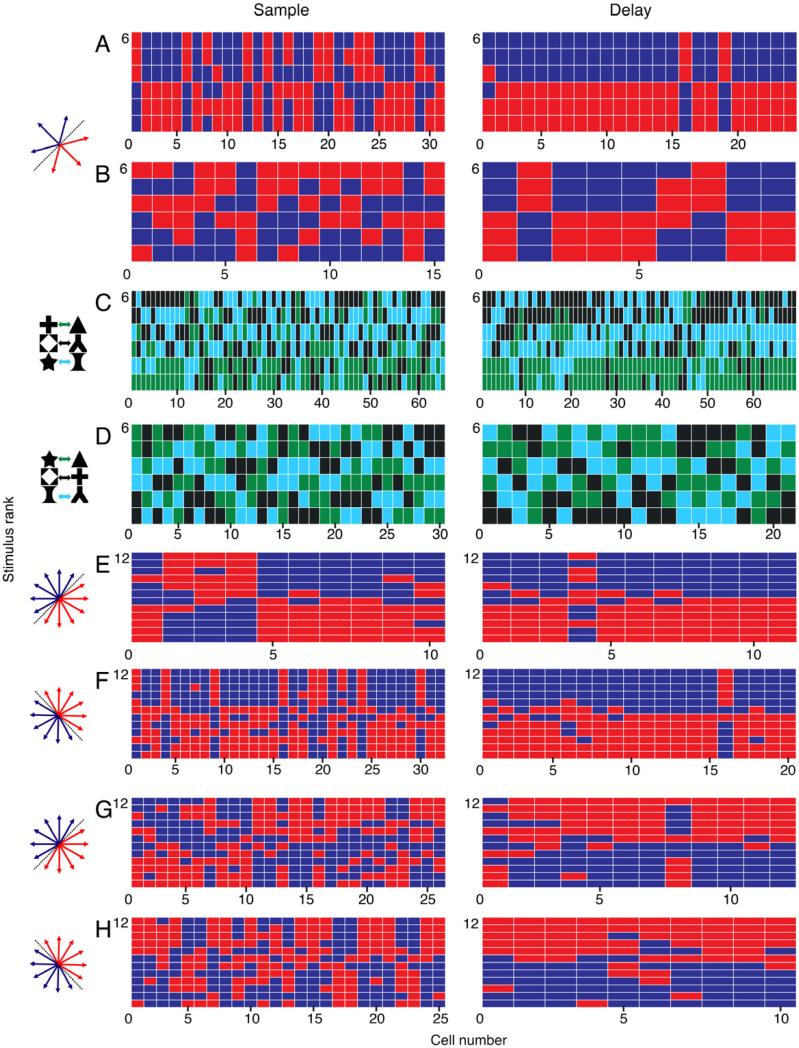
In A-H, each column of small colored rectangles corresponds to a set of firing rates recorded from a single neuron. Each rectangle in a column represents a single stimulus (direction or shape, depending on the experiment), color-coded according to the corresponding direction category or associated shape-pair of that stimulus. The stimulus that evoked the highest activity is represented by the rectangle at the top of the column, and the stimulus that evoked the lowest activity is represented by the rectangle at the bottom on the column. The remaining stimuli are arrayed within the column, rank-ordered by firing rate from top to bottom.
A. The ranked activity for all direction-category selective neurons in the six-direction categorization task recorded from Monkey H during the sustained sample (200-650 ms after motion onset) and late delay (750-1500 ms after motion offset). For each neuron, the three red rectangles correspond to the three directions in one direction category, and the three blue rectangles correspond to the three directions in the other category.
B. The ranked activity for all direction-category selective neurons in the six-direction categorization task recorded from Monkey I during the sustained sample and late delay.
C. The ranked activity for all pair-selective neurons recorded from Monkey H in the shape pair-association task during the sustained sample (200-650 ms post-shape onset) and late delay (750-1500 ms after shape offset).
D. The ranked activity for all pair-selective neurons recorded from Monkey I in the shape pair-association task during the sustained sample and late delay.
E. The ranked activity for all motion direction category-selective neurons in the twelve-direction categorization task with the 45-225° category boundary recorded from Monkey H during the sustained sample (200-650 ms post-motion onset) and late delay (500-1000 ms following motion offset).
F. The ranked activity for all category-selective neurons in the twelve-direction categorization task after training Monkey H with a 135-315° boundary, during the sustained sample and late delay.
G. The ranked activity for all category-selective neurons in the twelve-direction categorization task with the 45-225° category boundary recorded from Monkey S during the sustained sample and late delay.
H. The ranked activity for all category-selective neurons in the twelve-direction categorization task after training Monkey S with a 135-315° category boundary during the sustained sample and late delay.
Monkey I had fewer numbers of neurons that showed statistically significant selectivity for the direction categories (nested ANOVA; P < 0.01), but there was still a trend toward a bias in the category preference during both the sample-stimulus period (n = 15, P = 0.0081) and delay period (n = 9, P = 0.016; Friedman's test; Figure 3B).
Monkeys H and I also performed the shape pair-associate task, which allowed us to ask whether the selectivity is biased when animals associate stimuli into three groups rather than two. The neuronal population recorded during the shape pair-associate task in Monkey H indeed showed a pronounced bias in the ranking of strength of activity evoked by the different associated shape-pairs (Figure 3C). Both time periods showed significantly biased preferences during the sample period (n = 64, P < 10-11) and the delay period (n = 68, P ~ 0, Friedman's test). We did not observe a significant bias in shape-pair preferences for Monkey I, in either time period (Figure 3D), but Monkey I had weaker shape pair-associate effects in general.
After seeing the bias in these data (Fitzgerald et al., 2011), we reanalyzed a previous data set in which two monkeys performed a 12-direction categorization task (Freedman and Assad, 2006). One of those animals was also Monkey H. We confirmed that Monkey H had a consistent bias between direction categories, and the bias was again more pronounced during the delay period than the sample period (Figure 3E; sample: n = 10, P < 10-3; delay: n = 11, P < 10-15; Friedman's test).
However, before those data were collected, Monkey H was trained on a direction-category boundary perpendicular to the other category boundary. After the retraining, many LIP neurons again were selective between the direction categories, but that selectivity now reflected the new category boundary rather than the old boundary (Freedman and Assad, 2006). We examined the pattern of selectivity for the population of neurons recorded from Monkey H for the first category boundary, and again we found a strong bias in the ranking of directions (Figure 3F; sample: n = 32, P < 10-10; delay: n = 20, P ~ 0; Friedman's test). Because the category boundaries were different (orthogonal) between the data in Figure 3E and 3F, the bias could not be an intrinsic bias in direction preference that was coincidently aligned with our category boundary. Rather, the bias must have emerged as the animals learned to associate directions about a specific direction boundary. The retraining results also argue that the bias was unlikely to have resulted from under-sampling LIP during neuronal recordings (also see below).
A second monkey (S) was also trained in the 12-direction categorization task and then retrained with the perpendicular direction-category boundary (Freedman and Assad, 2006). Monkey S showed the similar trends as Monkey H: the bias in preferred direction-category was stronger during the delay period than the sample period (Figure 3G; sample: n = 26, P = 0.64; delay: n = 12, P < 10-5, Friedman's test) and the bias was also present after the animal was trained with the orthogonal category boundary (Figure 3H; sample: n = 25, P < 10-3; delay: n = 10, P < 10-13, Friedman's test). Interestingly, monkey S and monkey H had opposite preferred categories for both boundary conditions.
The analyses corresponding to the data in Figure 3 focused on those neurons that had statistically significant selectivity for the direction categories or shape-pair associations (nested ANOVA; P < 0.01; Fitzgerald et al., 2011). The percentage of neurons that showed such specificity ranged from 45-74% (mean 58%) during the sustained visual period and 20-71% (mean 44%) during the late delay among all experiments. However, the biases were also robust when all neurons were included in the analyses (Table S1 in the Supplementary data). In addition, for all the experiments, across neurons there was no obvious order of preference between associated stimuli within a category or within an associated pair (data not shown).
Possible explanations for the bias
The bias in preferred associated stimuli could provide important clues about the behavior of the parietal network during associative-learning tasks – but there are other potential explanations. One mundane possibility is that we under-sampled LIP during our recordings and thus missed other LIP neurons that had the opposite selectivity. This is unlikely for several reasons. First, in all the associative learning experiments, we mapped the recording chambers beyond the borders of LIP and recorded from all grid positions (typically four to five) that allowed LIP access. Second, we found a consistent bias in two separate neuronal data sets from Monkey H, in two different versions of the direction-categorization task (Figure 3A and 3E). It is unlikely that under-sampling could have produced a consistent bias. Third, the bias was not always constant over time during the course of a trial. As described above, we consistently found a stronger bias during the delay period than during the sample period, even though many neurons were selective for associated groups during the sample period. This is shown as a continuous function of time in Figure 4, for all neurons recorded from Monkey H during the six-direction categorization task. The color saturation in Figure 4 indicates the difference in normalized neuronal activity between the categories for each neuron throughout the trial time. Black indicates no difference in the mean activity throughout categories, blue indicates higher activity on the up/left category directions, and red indicates higher activity on the down/right directions, and the saturation of the color indicates the magnitude of the normalized difference between the categories (see figure legend for more details). During the sample period, neurons preferred either direction category, but the preference became more stereotyped during the delay period. If the bias were due to under-sampling LIP, we would expect to see a consistent bias throughout the trial time.
Figure 4. Time course of category-selective activity.
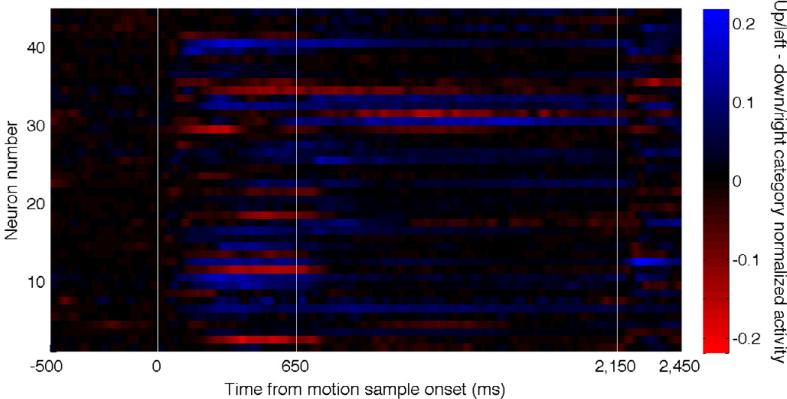
The normalized difference in neuronal activity between the categories for the population of 45 neurons recorded from Monkey H during the direction-categorization task. Blue indicates higher activity when the up/left directions were presented, black indicates no difference in activity between the two categories, and red indicates higher activity when the down/right directions were presented. Each neuron's average activity across the three directions within each category was calculated, then each neuron's activity was normalized by the maximum activity from the category averages, the normalized down/right activity was subtracted from the normalized up/left activity, and the difference was smoothed with a 50 ms Gaussian kernel.
Direction selectivity in LIP is not biased before direction-categorization training
Another possible explanation for the biases is that they reflect intrinsic biases in stimulus selectivity in LIP that happen to coincide with the associated groupings that we taught the animals. This seems extremely unlikely for the shape-association task, because we paired the shapes arbitrarily. However, there could have been an intrinsic bias in preferred directions in LIP that existed before the categorization training. As described above, this is unlikely because we retrained two animals with a new direction-category boundary perpendicular to the original boundary, yet we still found a strong bias after the retraining (Figure 3E-H).
Notwithstanding, we were able to test directly for an intrinsic direction bias in Monkey H. Before Monkey H was trained in the direction-categorization task, he had fortuitously been a subject of another study in which he passively viewed patches of dots moving in one of eight different directions in the receptive field (RF). The animal had no behavioral requirement except to fixate (Figure 5A). The fixation task was used to assess the intrinsic direction selectivity of LIP neurons, and indeed ~60% of LIP neurons were direction selective (Fanini and Assad, 2009). However, those preferred directions were widely distributed. To compare to the direction-categorization study, we rank-ordered the neuronal responses to each of the six directions for the 28 neurons that had statistically significant direction selectivity in the fixation task (one-way ANOVA, P < 0.01; Figure 5B).
Figure 5. Passive viewing of motion stimuli.
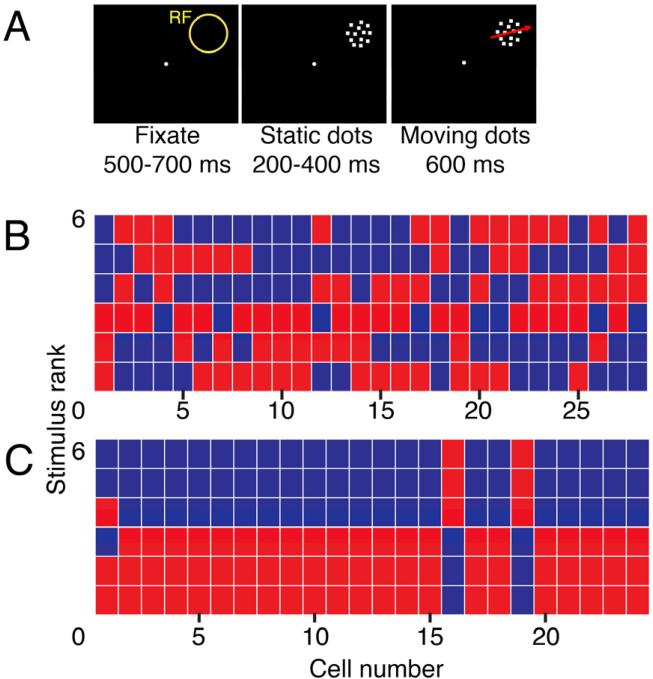
A. Before categorization training, Monkey H passively viewed eight directions of coherently-moving dot stimuli (Fanini and Assad, 2009).
B. For direction-selective neurons, the ranked activity evoked by each direction is plotted during the sustained visual response (200-600 ms post-motion onset) as the monkey passively viewed the stimuli. Directions are color-coded as in the motion categorization task in Fig. 1, where 6 indicates the highest activity, and 1 indicates the lowest activity. Two directions that fell along the category boundary were excluded.
C. The ranked activity for motion direction-category selective neurons recorded from Monkey H following the categorization training, replicated from Figure 3A, right panel.
The blue and red colors in Figure 5B indicate the corresponding direction categories in the direction-categorization task—although the monkey did not learn the direction-categorization task until after the data in Figure 5B were obtained. The data from the six-direction categorization task for Monkey H are shown for comparison (Figure 5C). Before the direction-category training (Figure 5B), there was no significant bias between the two “pseudo-categories,” for either of the two perpendicular category boundaries that we later used for that animal (P > 0.05 in both cases; Friedman's test). These findings argue against an intrinsic direction bias in LIP, and thus suggest that the bias emerged—in the same animal—as a result of the associative training.
The bias is not due to systematic behavioral effects
We also tested whether the biases could have resulted from systematic behavioral biases. For example, the animals may have struggled more with one associated group or another, or had a higher reward expectation for one group or another. In addition, there could have been different patterns of small fixational eye movements or post-trial saccades between different associated groups. These behavioral factors could potentially modulate neuronal firing in a way that mimicked associative effects; moreover, because the animals’ behavior would likely be consistent from neuron-to-neuron, behavioral effects could potentially mimic the biases that we observed in the neuronal activity. We used a regression-analysis framework to quantitatively examine the influence of a number of behavioral variables, including trial-performance accuracy, eye position within the fixation window, microsaccadic eye movements within the fixation window, and reaction time on match trials. In short, the behavioral effects on firing rate were generally small, and when we accounted for these small behavioral effects, we still found clear biases in the pattern of selectivity among neurons (see Tables S2-S5 and Figs. S1-S2 in the Supplementary information). The bias was also unlikely to have arisen from disparities in the amount of training or the training strategy between different direction categories or shape-pairs. For the two direction categories, the animals were equally exposed to directions from each category from the first day of training. In the shape-pair task, some pairs were introduced sequentially; however, no two pairs were introduced more than 15 days apart, and the animals were trained an additional four to five months after all three pairs were introduced (also see Experimental Procedures).
Neuronal selectivity in a perceptual decision task is also biased
We found selectivity biases in associative learning experiments, but could selectivity biases be a more widespread phenomenon? Numerous studies have examined the activity of LIP neurons during perceptual decision tasks in which monkeys report the direction of noisy motion stimuli (Gold and Shadlen, 2007). The stimuli are usually patches of randomly arrayed dots, with a variable percentage of the dots moving coherently in one of two opposite directions. The monkey must report the perceived direction on each trial (two-alternative forced-choice). Because the decision in these experiments is of a discrete, categorical nature, it is possible that perceptual decision tasks might reveal similar neuronal biases.
We analyzed data from one particular perceptual decision experiment (Bennur and Gold, 2011). In the task monkeys made a saccade to a red target if they perceived rightward motion and to a green target if they perceived leftward motion (Figure 6A). The two targets were placed above and below the patch of dots, with one of the targets placed in the RF of the neuron under study. In one variant of the task, the saccade targets did not turn red or green until after the motion stimulus was turned off. Because the positions of the red and green target were randomly interchanged from trial-to-trial, the animal could not predict the direction of the upcoming saccade during the moving-dot period or the delay period. This allowed the authors to assess the neuronal selectivity to the direction of the moving dots independently of the direction of the upcoming saccade. Moreover, because both red and green saccade targets could appear in the RF, the authors could also assess neuronal selectivity to target color independently of the direction of the upcoming saccade.
Figure 6. Bias in preferred direction and color in a perceptual decision task.
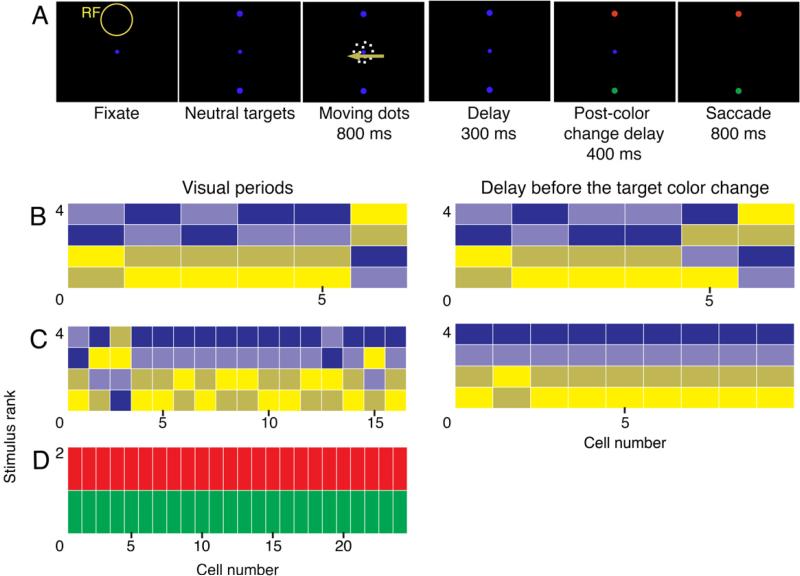
A. Behavioral task.
B-C. The ranking of preferred directions and coherences for the direction-selective neurons recorded from Monkey Av (B) and Monkey At (C) during the dots presentation (left panels, 200-800 ms post-dots onset) and delay before the target color change (right panels, 1-300 ms after dots offset). Responses to rightward 99.9%-coherence moving dots are in dark blue, 26.5%-coherence dots are in light blue, leftward 99.9%-coherence dots are in tan, and leftward 25.6%-coherence dots are in light yellow.
D. The ranking of preferred color following the target-color change (100-300 ms post target color change) for color-selective neurons recorded in Monkey At.
Indeed, many of the LIP neurons were selective for the direction of the moving-dot stimulus or the color of the saccade target, independently of the saccade direction (ANOVA, P < 0.01; Bennur and Gold, 2011). Moreover, similar to the associative learning experiments, the preferred directions and colors were highly stereotyped among neurons. Figure 6B-C shows the rank-order for the subsets of direction-selective neurons (ANOVA, P < 0.01) during the moving-dot period and during the delay period. For both monkeys and in both time periods, the neurons tended to have higher activity for rightward motion (blue hues) than leftward motion (yellow hues). Monkey Av (Figure 6B) had only 6 neurons that were direction-selective during both time periods, yet there was still a trend toward a bias in selectivity among those neurons (moving-dot period: P = 0.011; delay period: P = 0.027; Friedman's test). Monkey At (Figure 6C) had more direction-selective neurons and showed significant biases in both time periods (moving-dot period: P < 10-6; delay period: P < 10-5; Friedman's test). Similar results were obtained if all the neurons were included in the analyses, not only the direction-selective neurons (see Table S1 in Supplementary data).
There was also a bias in the selectivity for the color of the saccade target in the RF. Monkey Av (data not shown) only had five color-selective neurons (and thus lacked statistical power), but if all 25 neurons were included, there was a significant bias toward larger responses for the red target (P = 0.0093; Friedman's test). Monkey At (Figure 6D) had 24 color-selective neurons, and all 24 had higher activity for the red target (P < 10-6; Friedman's test). One caveat is that both monkeys had been previously trained on a different perceptual decision task in which only red saccade targets were placed left and right of the fixation point (Connolly et al., 2009). This previous training history could have made the red targets more salient to the animals, perhaps causing consistently larger neuronal responses than the green targets. In the new experiment, however, the animals did not show a systematic bias in their choices of the red or green saccade targets (Bennur and Gold, 2011), so there is no direct evidence that the animals placed special significance on the red target. In the case of the direction selectivity, the animals were exposed equally to left and right directions from the start of training, so the direction selectivity could not have resulted from overtraining in one direction.
Biased preferences are a prediction of one-dimensional dynamics in LIP
We found biased neuronal representations in two associative learning experiments and a perceptual decision experiment—but what is the significance of the bias? A recent modeling study could provide insight. Ganguli and colleagues developed a computational model to examine the dynamics of the parietal neural network (Ganguli et al., 2008). The model was motivated by a surprising stereotyped relationship observed between the amplitude of memory-delay activity and the dynamics of visual transients in individual LIP neurons (Bisley and Goldberg, 2003, 2006). Ganguli et al. argued that this stereotyped neuronal behavior was unlikely to result from finely tuned intrinsic properties of LIP neurons, but rather reflects the dynamics of the interconnected neural network that includes those neurons.
To explain the neuronal data, Ganguli et al. proposed a dynamical neural network model in which slowly varying patterns of neural activity, such as spontaneous activity or memory-delay activity, are “one-dimensional” on long time scales. That is, if one considers the instantaneous firing of all neurons in the network as a vector, that vector is confined to a one-dimensional trajectory through n-dimensional firing-rate space (n = number of neurons in the network) as neural activity slowly decays back to spontaneous rates. The authors further demonstrated that one-dimensional dynamics are a robust consequence of networks with sparse, random, net-excitatory connectivity between neurons.
A strong assumption of the model is that the one-dimensional trajectory is linear, and thus that the vectors of population firing rates during periods of spontaneous firing or sustained delay-period firing are scaled versions of one another. Indeed, for multiple LIP studies, Ganguli et al. were able to show that, across the neuronal population, there was a linear relationship between the amplitudes of spontaneous activity and memory-delay activity (or other slowly changing activity) (Ganguli et al., 2008).
We realized that the Ganguli model also makes a prediction about neuronal selectivity in our experiments. If the population firing rates (vectors) are scaled versions of one another, the order of preference among the associated stimuli should be the same for every neuron. Consider our direction-categorization task: if for one neuron the activity is twice the spontaneous rate in response to the up/left category and three times the spontaneous rate in response to the down/right category, the activity ratios should be likewise twice for up/left and three times for down/right for all neurons. That is, the order of preference between the categories should be the same for all neurons. If not, the vector of population firing rates would not scale linearly under different conditions. Thus the Ganguli model provides a potential explanation for the biases in selectivity that we observed.
To test the applicability of the model to our data, we examined whether, across the neuronal population, there was a linear relationship between the firing rates under different conditions and between the spontaneous condition. For every neuron from Monkey H in the six-direction categorization task, we averaged the delay-period activity across the three directions in each category and plotted the average activity from the two direction categories against each other (Figure 7A, r = 0.70, P < 10-12) and against the spontaneous activity (50-450 ms following fixation) (Figure 7B-C). In all cases the data were well fit by a linear relationship (up/left category: r = 0.73, P < 10-12; down/right category: r = 0.62, P < 10-9). We observed similar linear relationships in the other associative experiments (Supplementary material, tables S6-16).
Figure 7. Relationship between the spontaneous activity and the activity during the direction categorization task.
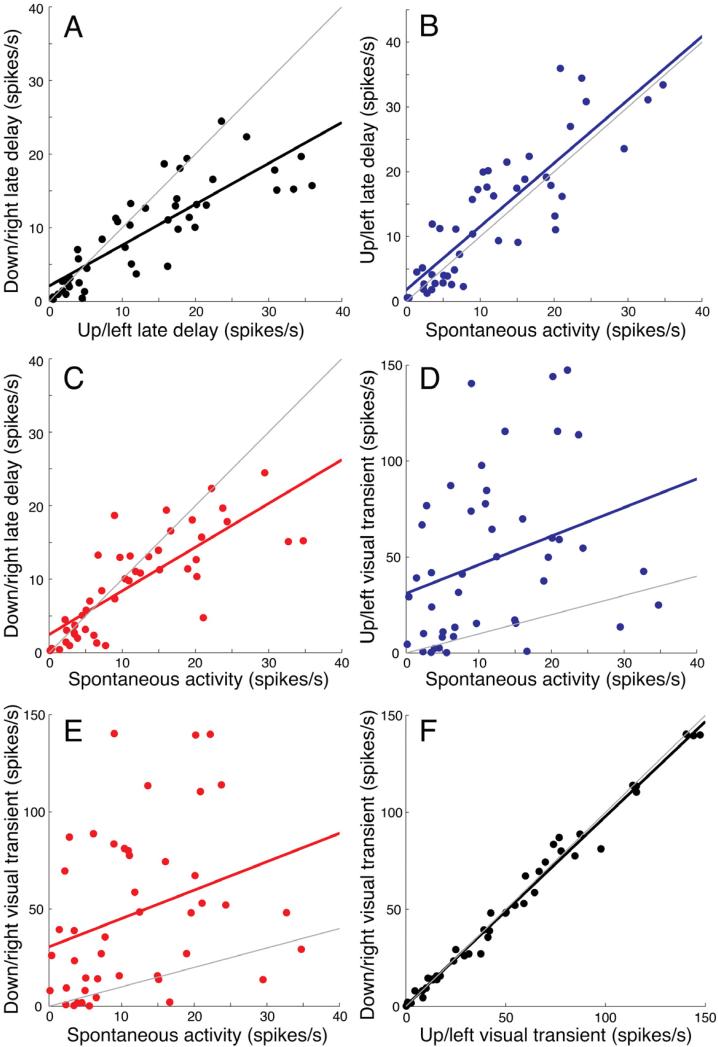
A. The averaged late delay activity (750-1500 ms following motion offset) of the two categories recorded from Monkey H during the six-direction categorization task are plotted against each other. Linear regression: r = 0.70, P < 10-12. The gray line has a slope of 1.
B-C. The activity during the late delay versus the spontaneous activity recorded during the fixation period (50-450 ms following fixation). Each point represents the mean activity of an individual neuron during the presentation of one direction category. Linear regressions are fitted separately for each category: up/left category (B, blue points): r = 0.73, P < 10-12; down/right category (C, red points): r = 0.62, P < 10-9.
D-E. The activity during the early visual transient (40-140 ms following motion onset) versus spontaneous activity, plotted in the same convention as above. Linear regressions are fitted separately for each category: up/left category (D, blue points): r = 0.099, P = 0.036; down/right category (E, red points): r = 0.098, P = 0.036.
F. The averaged early visual transient (40-140 ms following motion onset) of the two categories plotted against each other. Linear regression: r = 0.99, P ~ 0. The gray line has a slope of 1.
Ganguli et al. also argued that rapidly changing visual transients are not confined to a single dimension in population firing-rate space, but instead enter higher order modes that then rapidly decay back to the single firing-rate mode as the firing rate stabilizes. We thus plotted the amplitude of the visual transient evoked by the onset of motion in the RF (40-140 ms following motion onset) against the spontaneous activity (Figure 7D-E). Indeed, those plots were less well fit by a linear relationship (up/left category: r = 0.099, P = 0.036; down/right category: r = 0.098, P = 0.036). These data also argue that the mutual scaling of delay and spontaneous activity (Figure 7C-D) was not due to simple differences in excitability among LIP neurons: if the scaling were due to excitability differences, we would have also expected a linear relationship with the transient visual response (Ganguli et al., 2008). It is possible that the lack of a linear relationship in Figure 7D-E was due to our inability to accurately measure the amplitude of the visual transients, either because of the small time window needed to measure the visual transient or inherent variability in the transient amplitude. However, when we plotted the amplitude of the visual transient for the two direction categories against each other (Figure 7F), we found that the transients were nearly identical in the two cases (linear regression: r = 0.99, P ~ 0.), arguing that we accurately estimated the amplitudes of the transients -- and underscoring the lack of category selectivity during this early time interval.
The delay activity is often greater than the spontaneous activity, or it may fall below the spontaneous activity (Figure 7C), but a caveat of this analysis is that the delay activity is frequently not much larger than the level of the spontaneous activity. If the spontaneous activity comprises a large “component” of the delay activity then a linear relationship would be expected between the two measures. The relatively modest delay activity limits the statistical power to determine exactly how the spontaneous and delay activities are related, e.g., by multiplicative or additive scaling. However, a linear relationship between delay activity and spontaneous activity is not a strong prediction of the model. Rather, as long as the population relationship between the spontaneous and delay activity is stereotyped among conditions and monotonic, there should be a biased selectivity among neurons, as we found (S. Ganguli, personal communication).
Discussion
We found biases in neuronal selectivity in LIP in three different experiments, in five monkeys from two laboratories. The biases were very strong in some cases, and we found no evidence that the biases were due to experimental under-sampling, intrinsic selectivity in LIP, or behavioral artifacts.
The biased distributions that we observed in LIP are markedly different from the broad or uniform distributions of preferred visual features typical among visual cortical neurons. There have been some reports of over-representations in particular visual features in visual cortex, such as horizontal and vertical orientations in V1 (Pettigrew et al., 1968), centrifugal motion directions (Albright, 1989) and near disparities in MT (DeAngelis and Uka, 2003), and expanding optic flow stimuli in the medial superior temporal area (Duffy and Wurtz, 1995). However, those biases are subtle compared to the biases we found in LIP. The over-representations in visual cortex were present in untrained animals, whereas the biases we observed in LIP were clearly the result of the animals’ training in the particular behavioral task.
But what is the significance of the biased representations in LIP? We can consider a number of clues. First, the bias was present in associative learning tasks and in a perceptual decision task. These paradigms are inherently similar, because the animals classify stimuli into two or three mutually exclusive categories – “left” versus “right,” “shape-pair one” versus “shape-pair three,” “direction-category one” versus “direction-category two” (Freedman and Assad, 2011). Thus the bias in LIP may arise whenever animals decide between discrete alternatives.
Discrete alternatives bring to mind nonlinear dynamical networks with discrete attractor states. Multiple-attractor networks have been used to model the activity of inferotemporal cortex during pair-association tasks (Mongillo et al., 2003). Wang and colleagues (Wong and Wang, 2006) also used recurrent neural network models that generate stable, self-sustaining population-activity states to simulate neuronal responses to a two-direction perceptual decision task in LIP (Roitman and Shadlen, 2002). Different stable attractors corresponded to the different decision states and the spontaneous state, a two- or three-dimensional description. Ganguli and colleagues examined the same perceptual decision study and argued that the decision pools were dominated by a single dimension (Ganguli et al., 2008). On the other hand, attractor and one-dimensional descriptors of LIP are not mutually exclusive; multiple attractors may exist while a single dimension's activity dominates (Wang, 2008), and the one-dimensional state during the delay period resembles a leaky attractor (Ganguli et al., 2008).
The biased selectivity and the linear relationship between sustained activities (e.g., between delay activity and spontaneous activity) that we found in LIP are consistent with a single, dominant dimension in LIP, but there are several caveats to this interpretation. First, if the biased selectivity and linear relationship between sustained activities are manifestations of the same underlying process, the strength of the two effects should co-vary across animals or data sets. We could not meaningfully address this issue with the few data sets in this paper (no more than three per experiment), but it bears future study. Second, the strength of the bias varied among animals, as did the sign (e.g., the direction bias was reversed between monkeys H and S; Fig. 3E-H). This might suggest that the bias arises stochastically among animals or reflects the specific strategy that an animal uses to solve the task. Finally, the bias was usually not absolute in any experiment, and the sustained activities were not perfectly correlated across neurons for a given data set. While some variation would be expected from physiological noise, at this point a more conservative descriptor of the dynamics might be “low-dimensional” rather than one-dimensional.
However, saying that the biased selectivity in LIP could arise due to low-dimensional neural network dynamics hardly provides a satisfying answer to the question of why the selectivity is biased (at least to most neuroscientists). One possibility is that the bias is simply an epiphenomenon of a different function of the parietal network. For example, many LIP neurons have activity that can be sustained for several seconds in the absence of visual stimulation. This sustained activity has been argued to play a role in oculomotor planning (Andersen and Buneo, 2002), spatial attention (Goldberg et al., 2006) and other forms of non-spatial working memory (Fitzgerald et al., 2011; Freedman and Assad, 2006; Sereno and Amador, 2006). Sustained activity on a timescale of seconds needs to be self-generated at the level of the neural network, and recurrent, excitatory connections are usually invoked to this end. Thus one possibility is that the biased selectivity in LIP is an epiphenomenon of a recurrent network architecture that is optimized to support stable, sustained activity in the absence of visual input. If so, the bias should minimally be considered as an additional constraint in modeling recurrent networks of this sort.
On the other hand, biased representations may play a useful functional role. At first glance, the bias in LIP seems disadvantageous, in that the (overwhelming) redundancy would limit the coding power or bandwidth of the neural network. In contrast, neurons in lower visual cortical areas are typically varied in their selectivity, which reduces redundancy and thus increases decoding power. But a functional role of visual cortical areas is presumably to encode along continuous stimulus dimensions, such as orientation, direction, depth, and color. Discriminating fine differences in these features requires a high bandwidth system, which could be accomplished by having neurons with different selectivity.
This is not the case for the associative learning and perceptual decision tasks that we examined. These tasks have only a small number of discrete outcomes and thus do not need to be encoded by a high-bandwidth system. For example, the direction-categorization task had only two categorical outcomes, which in principle could be encoded by one bit – high or low. This is essentially what we find in LIP during these tasks. In this view, it is possible that downstream brain areas read out the overall level of activity among LIP neurons in determining the particular discrete outcome; high input would indicate one category and low input would indicate the other category. This could have the potential advantage of reducing noise by increased averaging. It could also reduce or obviate the need for precise patterns of connections or labeled lines from LIP: if LIP only provides a scalar output, the identity of the particular inputs from LIP would be unimportant. In contrast, if there were equal numbers of LIP neurons that preferred either of the two categories, downstream areas must have a way to segregate or otherwise identify those inputs.
The idea of a potential scalar read-out from LIP raises a number of interesting issues. First, a scalar read-out only works well for a few discrete behavioral outcomes; for more than a few outcomes, a scalar read-out could quickly run out of bandwidth. That is, firing rate can only be split into so many levels before noise starts to obscure differences between levels. We only examined tasks with two or three discrete outcomes, but it would be interesting to see whether the selectivity biases remain if more outcomes or categories are included. A related issue is that, because our behavioral tasks involved only a few outcomes, the animals could have adopted a simplified mnemonic or decisional strategy, such as “A” or “not A”. One could imagine that such a simplified strategy could produce a biased selectivity among neurons. However, there is no a priori reason why the delay activity and the spontaneous activity should fall along a linear or low-dimensional trajectory in multi-dimensional firing-rate space. That is, low dimensionality implies biased selectivity, but biased selectivity does not guarantee low dimensionality. In the case of the three shape-pairs, it is even less likely that three delay conditions and spontaneous activity would share a low-dimensional trajectory.
A second interesting issue is the extent of the neural network that contributes to the biased representations. For example, we only recorded from one hemisphere in all the studies reported here, but an open question is whether both hemispheres share the same bias. In addition, we focused on parietal cortex in this study, but other brain areas may also play a role. LIP is connected with the dorsolateral prefrontal cortex, frontal eye fields, and superior colliculus (Blatt et al., 1990; Lewis and Van Essen, 2000), all of which contain neurons with persistent activity during memory-delay periods, when we found the strongest bias. In fact, there have been a number of associative learning or categorization studies in frontal cortex, although these have generally not focused on the distribution of selectivity among neurons. However, a few studies commented that the selectivity distributions were not biased. For example, roughly equal numbers of neurons in the frontal eye fields prefer slower speeds or faster speeds when animals are trained to categorize speed (Ferrera et al., 2009). In addition, when animals are trained to switch between two categorization schemes, the preferred categories of individual neurons in dorsolateral prefrontal cortex (DLPFC) were evenly distributed for both categorization schemes (Cromer et al., 2010). However, these studies combined the data from the two monkeys, so we cannot rule out that the individual monkey data were biased in opposite directions. Intriguingly, in a recent study in prefrontal cortex examining categorical representations in a stimulus-detection task, “stimulus present” neurons outnumbered “stimulus absent” neurons by nearly 4:1 (Merten and Nieder, 2012), a strong categorical asymmetry that is reminiscent of the biases we found in parietal cortex. This leaves open the possibility that biased categorical representations also extend to prefrontal cortex.
Finally, the biased representations were a consequence of training (or retraining) the animals, and therefore exhibit some kind of flexibility. For example, in one animal we found that the biased representation of direction emerged from an unbiased representation when the animal was trained in the direction-categorization task. In all the studies, we trained the animals over a period of at least a few weeks, so we cannot address how quickly a biased representation can emerge from an unbiased representation. It is even possible that biases are established online, depending on behavioral demands.
Flexible representations have been described previously in LIP, at least in regard to responses of single neurons. For example, LIP neurons have color-selective responses when color is made behaviorally relevant (Toth and Assad, 2002). If the biased selectivity in LIP represents a simplified coding strategy that emerges in response to certain behavioral conditions (as opposed to an epiphenomenon of some other network constraint), this implies flexibility at the level of the general population-coding strategy in parietal cortex, not just at the level of single neurons.
Experimental Procedures
Behavioral tasks
The five behavioral tasks are described in detail in the published papers (Fitzgerald et al., 2011; Freedman and Assad, 2006; Fanini and Assad, 2009; Bennur and Gold, 2011), but are summarized below for convenience. All experimental procedures were in accordance with the NIH Guide for the Care and Use of Laboratory Animals and Harvard Medical School or University of Pennsylvania Institutional Animal Care and Use Committee.
Direction-categorization task
Animals started the task by fixating their gaze at a center point and holding a touch circuit. A patch of 100% coherently-moving dots appeared in the receptive field of the neuron under study for 650 ms, and following a 1,000 ms (twelve-direction task) or 1,500 ms delay (six-direction task), a second dot-patch was presented in the receptive field for 650 ms. On half of the trials, the directions of the two dot patches belonged to the same category, and the animal released the touch circuit for a juice reward. On the other half of the trials, the direction of the second dot patch belonged to a different category, and the animal had to maintain his hold of the touch circuit during a 150 ms delay until a motion patch moving in the same category was presented for 650, when the animal could release the touch circuit to receive juice.
Animals were trained with equal exposure to the two direction-categories. The direction-categorization training started with only the two directions orthogonal to the category boundary—one direction in each category. Additional directions off the orthogonal were added to each category simultaneously as training progressed.
Shape-pair association task
The trial structure was the same as the direction-categorization task, and the delay period was 1500 ms. The animals were initially trained on two shape pairs, and additional pairs were introduced sequentially or in groups of two. No more than 15 days of training separated the introduction of the first and last shape-shape pairs, and the animals were trained on the shape task for a further four to five months after all shape-pairs were introduced. Additionally, the animals saw the shapes with equal frequency during the four to six months of recording and further training.
Motion-viewing task
After the monkeys fixated, a patch of static dots (adjusted to fill the neuron's receptive field) was presented in the receptive field for 200-400 ms. The dots then moved coherently for 600 ms in one of eight equally spaced directions, followed by an interstimulus interval of 400 ms. After three such motion pulses, the monkey was rewarded for maintaining fixation. Each trial was separated by 1000 ms.
Perceptual decision task
Animals started the task by fixating their gaze on a central point, and after a short delay, two blue neutral targets appeared above and below the fixation point. Neurons were selected so that one of the targets fell within the receptive field. A patch of moving dots (5°) appeared at the center of the display. The dots moved left or right for 800 ms with three possible coherences: 99.9%, 25.6%, or 6.4%. Following the offset of the moving dots (300 ms), the blue targets changed color to red and green, indicating where the monkeys should look to signal their decision about the direction of motion. After another 400 ms, the fixation point turned off, cuing the animal to make a saccade to one of the two targets. Animals were trained with equal exposure time to left and right motion.
In this paper, we focused on the 99.9% and 25.6% coherences. We did not consider the 6.4% coherence case, because the animals judged the motion directions near chance for 6.4%.
Data analysis
All analyses were performed on correct trials in which the animals maintained fixation throughout the trial. Single neuron plots were smoothed with a 120 ms Gaussian kernel. Population plots show averaged, normalized activity. For each neuron, the mean activity for each condition was smoothed with a 50 ms Gaussian kernel, and the response of each cell was divided by its maximum activity across all of the conditions.
We tested for significant encoding of motion-direction categories and shape-pair associations using a nested analysis of variance (ANOVA; criterion of P < 0.01) in which the shape-pairs or direction-categories were the main variables, and the two shapes within each pair or three or six directions within each category were the nominal variables. This nested design tests whether neuron's responses to all shapes or directions within a pair or category are distinct from the other shapes or directions. That is, the nested approach generally excludes neurons that responded selectivity to only one shape within a pair or one direction within a motion category.
For the perceptual decision data (Bennur and Gold, 2011), we tested for significant direction or color selectivity using one-way ANOVA with a criterion of P < 0.01.
We tested for a significant population-level bias in the activity for each motion direction category, shape-pair association, direction decision, or color using a Friedman's test, a non-parametric test for a difference in the neuronal activity by group, with a null hypothesis that the population-level activity is the same for all groupings. The random variable is each neuron's mean activity by condition. For example, in the twelve-direction categorization task, the input is all neuron's mean activity for each of the twelve directions, which is labeled as six observations for category A and six observations for category B per neuron. The Friedman's test adjusts for individual neuron firing rate differences by rank-ordering each neuron's responses to the association/decision stimuli and then testing for a significant difference in association/decision group rankings across the population. All analyses were performed using custom software and the statistics package in Matlab releases 2007a and 2012a (The Mathworks, Natick, MA).
Supplementary Material
Highlights.
Preferred stimuli are typically broadly distributed in visual cortical areas.
LIP neurons surprisingly had stereotyped preferences in discrete outcome tasks.
Stereotypy is predicted by theory that stable LIP activity is one-dimensional.
Acknowledgements
We thank Surya Ganguli and Kenneth Miller for their discussions and insights. This work was supported by NEI grant RO1 EY-12106 (J.A.A.), Vision Core grant EY-12196, NIMH Predoctoral NRSA F31 MH085439 (J.K.F.), The Edward R. and Anne G. Lefler Center Predoctoral Fellowship (J.K.F.), a Charles H. Hood Postdoctoral Fellowship (D.J.F.), NEI Kirschstein postdoctoral NRSA F32 EY015340 (D.J.F), and NIMH grant R03 MH087798 (J.I.G.).
Footnotes
Publisher's Disclaimer: This is a PDF file of an unedited manuscript that has been accepted for publication. As a service to our customers we are providing this early version of the manuscript. The manuscript will undergo copyediting, typesetting, and review of the resulting proof before it is published in its final citable form. Please note that during the production process errors may be discovered which could affect the content, and all legal disclaimers that apply to the journal pertain.
Author contributions
J.K.F. analyzed all data sets and wrote the manuscript.
J.A.A. discussed the analysis and manuscript outline and edited the manuscript.
D.F.J., A.F., S.B., and J.I.G. shared their data sets, and D.F.J. and J.I.G. edited the manuscript.
References
- Albright TD. Centrifugal directional bias in the middle temporal visual area (MT) of the macaque. Vis Neurosci. 1989;2:177–188. doi: 10.1017/s0952523800012037. [DOI] [PubMed] [Google Scholar]
- Andersen RA, Buneo CA. Intentional maps in posterior parietal cortex. Annu Rev Neurosci. 2002;25:189–220. doi: 10.1146/annurev.neuro.25.112701.142922. [DOI] [PubMed] [Google Scholar]
- Bennur S, Gold JI. Distinct representations of a perceptual decision and the associated oculomotor plan in the monkey lateral intraparietal area. J Neurosci. 2011;31:913–921. doi: 10.1523/JNEUROSCI.4417-10.2011. [DOI] [PMC free article] [PubMed] [Google Scholar]
- Bisley JW, Goldberg ME. Neuronal activity in the lateral intraparietal area and spatial attention. Science. 2003;299:81–86. doi: 10.1126/science.1077395. [DOI] [PubMed] [Google Scholar]
- Bisley JW, Goldberg ME. Neural correlates of attention and distractibility in the lateral intraparietal area. J Neurophysiol. 2006;95:1696–1717. doi: 10.1152/jn.00848.2005. [DOI] [PMC free article] [PubMed] [Google Scholar]
- Blatt GJ, Andersen RA, Stoner GR. Visual receptive field organization and cortico-cortical connections of the lateral intraparietal area (area LIP) in the macaque. J Comp Neurol. 1990;299:421–445. doi: 10.1002/cne.902990404. [DOI] [PubMed] [Google Scholar]
- Connolly PM, Bennur S, Gold JI. Correlates of perceptual learning in an oculomotor decision variable. J Neurosci. 2009;29:2136–2150. doi: 10.1523/JNEUROSCI.3962-08.2009. [DOI] [PMC free article] [PubMed] [Google Scholar]
- Conway BR, Tsao DY. Color-tuned neurons are spatially clustered according to color preference within alert macaque posterior inferior temporal cortex. Proc Natl Acad Sci U S A. 2009;106:18034–18039. doi: 10.1073/pnas.0810943106. [DOI] [PMC free article] [PubMed] [Google Scholar]
- Cromer JA, Roy JE, Miller EK. Representation of multiple, independent categories in the primate prefrontal cortex. Neuron. 2010;66:796–807. doi: 10.1016/j.neuron.2010.05.005. [DOI] [PMC free article] [PubMed] [Google Scholar]
- DeAngelis GC, Uka T. Coding of horizontal disparity and velocity by MT neurons in the alert macaque. J Neurophysiol. 2003;89:1094–1111. doi: 10.1152/jn.00717.2002. [DOI] [PubMed] [Google Scholar]
- Duffy CJ, Wurtz RH. Response of monkey MST neurons to optic flow stimuli with shifted centers of motion. J Neurosci. 1995;15:5192–5208. doi: 10.1523/JNEUROSCI.15-07-05192.1995. [DOI] [PMC free article] [PubMed] [Google Scholar]
- Fanini A, Assad JA. Direction selectivity of neurons in the macaque lateral intraparietal area. J Neurophysiol. 2009;101:289–305. doi: 10.1152/jn.00400.2007. [DOI] [PMC free article] [PubMed] [Google Scholar]
- Ferrera VP, Yanike M, Cassanello C. Frontal eye field neurons signal changes in decision criteria. Nat Neurosci. 2009;12:1458–1462. doi: 10.1038/nn.2434. [DOI] [PMC free article] [PubMed] [Google Scholar]
- Fitzgerald JK, Freedman DJ, Assad JA. Generalized associative representations in parietal cortex. Nat Neurosci. 2011;14:1075–1079. doi: 10.1038/nn.2878. [DOI] [PMC free article] [PubMed] [Google Scholar]
- Freedman DJ, Assad JA. Experience-dependent representation of visual categories in parietal cortex. Nature. 2006;443:85–88. doi: 10.1038/nature05078. [DOI] [PubMed] [Google Scholar]
- Freedman DJ, Assad JA. A proposed common neural mechanism for categorization and perceptual decisions. Nat Neurosci. 2011;14:143–146. doi: 10.1038/nn.2740. [DOI] [PubMed] [Google Scholar]
- Freedman DJ, Riesenhuber M, Poggio T, Miller EK. Categorical representation of visual stimuli in the primate prefrontal cortex. Science. 2001;291:312–316. doi: 10.1126/science.291.5502.312. [DOI] [PubMed] [Google Scholar]
- Freedman DJ, Riesenhuber M, Poggio T, Miller EK. Visual categorization and the primate prefrontal cortex: neurophysiology and behavior. J Neurophysiol. 2002;88:929–941. doi: 10.1152/jn.2002.88.2.929. [DOI] [PubMed] [Google Scholar]
- Ganguli S, Bisley JW, Roitman JD, Shadlen MN, Goldberg ME, Miller KD. One-dimensional dynamics of attention and decision making in LIP. Neuron. 2008;58:15–25. doi: 10.1016/j.neuron.2008.01.038. [DOI] [PMC free article] [PubMed] [Google Scholar]
- Gold JI, Shadlen MN. The neural basis of decision making. Annu Rev Neurosci. 2007;30:535–574. doi: 10.1146/annurev.neuro.29.051605.113038. [DOI] [PubMed] [Google Scholar]
- Goldberg ME, Bisley JW, Powell KD, Gottlieb J. Saccades, salience and attention: the role of the lateral intraparietal area in visual behavior. Prog Brain Res. 2006;155:157–175. doi: 10.1016/S0079-6123(06)55010-1. [DOI] [PMC free article] [PubMed] [Google Scholar]
- Hegde J, Van Essen DC. A comparative study of shape representation in macaque visual areas v2 and v4. Cereb Cortex. 2007;17:1100–1116. doi: 10.1093/cercor/bhl020. [DOI] [PubMed] [Google Scholar]
- Hubel DH. Eye, brain, and vision. Scientific American Library : Distributed by W.H. Freeman; New York: 1988. [Google Scholar]
- Hubel DH, Wiesel TN. Receptive fields, binocular interaction and functional architecture in the cat's visual cortex. J Physiol. 1962;160:106–154. doi: 10.1113/jphysiol.1962.sp006837. [DOI] [PMC free article] [PubMed] [Google Scholar]
- Lehky SR, Kiani R, Esteky H, Tanaka K. Statistics of visual responses in primate inferotemporal cortex to object stimuli. J Neurophysiol. 2011;106:1097–1117. doi: 10.1152/jn.00990.2010. [DOI] [PubMed] [Google Scholar]
- Lewis JW, Van Essen DC. Corticocortical connections of visual, sensorimotor, and multimodal processing areas in the parietal lobe of the macaque monkey. J Comp Neurol. 2000;428:112–137. doi: 10.1002/1096-9861(20001204)428:1<112::aid-cne8>3.0.co;2-9. [DOI] [PubMed] [Google Scholar]
- Merten K, Nieder A. Active encoding of decisions about stimulus absence in primate prefrontal cortex neurons. Proc Natl Acad Sci U S A. 2012;109:6289–6294. doi: 10.1073/pnas.1121084109. [DOI] [PMC free article] [PubMed] [Google Scholar]
- Miller EK, Freedman DJ, Wallis JD. The prefrontal cortex: categories, concepts and cognition. Philos Trans R Soc Lond B Biol Sci. 2002;357:1123–1136. doi: 10.1098/rstb.2002.1099. [DOI] [PMC free article] [PubMed] [Google Scholar]
- Mongillo G, Amit DJ, Brunel N. Retrospective and prospective persistent activity induced by Hebbian learning in a recurrent cortical network. Eur J Neurosci. 2003;18:2011–2024. doi: 10.1046/j.1460-9568.2003.02908.x. [DOI] [PubMed] [Google Scholar]
- Naya Y, Sakai K, Miyashita Y. Activity of primate inferotemporal neurons related to a sought target in pair-association task. Proc Natl Acad Sci U S A. 1996;93:2664–2669. doi: 10.1073/pnas.93.7.2664. [DOI] [PMC free article] [PubMed] [Google Scholar]
- Naya Y, Yoshida M, Miyashita Y. Backward spreading of memory-retrieval signal in the primate temporal cortex. Science. 2001;291:661–664. doi: 10.1126/science.291.5504.661. [DOI] [PubMed] [Google Scholar]
- Naya Y, Yoshida M, Takeda M, Fujimichi R, Miyashita Y. Delay-period activities in two subdivisions of monkey inferotemporal cortex during pair association memory task. Eur J Neurosci. 2003;18:2915–2918. doi: 10.1111/j.1460-9568.2003.03020.x. [DOI] [PubMed] [Google Scholar]
- Pettigrew JD, Nikara T, Bishop PO. Responses to moving slits by single units in cat striate cortex. Exp Brain Res. 1968;6:373–390. doi: 10.1007/BF00233185. [DOI] [PubMed] [Google Scholar]
- Rainer G, Asaad WF, Miller EK. Selective representation of relevant information by neurons in the primate prefrontal cortex. Nature. 1998;393:577–579. doi: 10.1038/31235. [DOI] [PubMed] [Google Scholar]
- Rainer G, Rao SC, Miller EK. Prospective coding for objects in primate prefrontal cortex. J Neurosci. 1999;19:5493–5505. doi: 10.1523/JNEUROSCI.19-13-05493.1999. [DOI] [PMC free article] [PubMed] [Google Scholar]
- Roitman JD, Shadlen MN. Response of neurons in the lateral intraparietal area during a combined visual discrimination reaction time task. J Neurosci. 2002;22:9475–9489. doi: 10.1523/JNEUROSCI.22-21-09475.2002. [DOI] [PMC free article] [PubMed] [Google Scholar]
- Roy JE, Riesenhuber M, Poggio T, Miller EK. Prefrontal cortex activity during flexible categorization. J Neurosci. 2010;30:8519–8528. doi: 10.1523/JNEUROSCI.4837-09.2010. [DOI] [PMC free article] [PubMed] [Google Scholar]
- Sakai K, Miyashita Y. Neural organization for the long-term memory of paired associates. Nature. 1991;354:152–155. doi: 10.1038/354152a0. [DOI] [PubMed] [Google Scholar]
- Sereno AB, Amador SC. Attention and memory-related responses of neurons in the lateral intraparietal area during spatial and shape-delayed match-to-sample tasks. J Neurophysiol. 2006;95:1078–1098. doi: 10.1152/jn.00431.2005. [DOI] [PubMed] [Google Scholar]
- Toth LJ, Assad JA. Dynamic coding of behaviourally relevant stimuli in parietal cortex. Nature. 2002;415:165–168. doi: 10.1038/415165a. [DOI] [PubMed] [Google Scholar]
- Wang XJ. Decision making in recurrent neuronal circuits. Neuron. 2008;60:215–234. doi: 10.1016/j.neuron.2008.09.034. [DOI] [PMC free article] [PubMed] [Google Scholar]
- Wong KF, Wang XJ. A recurrent network mechanism of time integration in perceptual decisions. J Neurosci. 2006;26:1314–1328. doi: 10.1523/JNEUROSCI.3733-05.2006. [DOI] [PMC free article] [PubMed] [Google Scholar]
- Yanike M, Wirth S, Suzuki WA. Representation of well-learned information in the monkey hippocampus. Neuron. 2004;42:477–487. doi: 10.1016/s0896-6273(04)00193-x. [DOI] [PubMed] [Google Scholar]
Associated Data
This section collects any data citations, data availability statements, or supplementary materials included in this article.