

Abstract
NANOG, OCT4 and SOX2 form the core network of transcription factors supporting embryonic stem (ES) cell self-renewal. While OCT4 and SOX2 expression is relatively uniform, ES cells fluctuate between states of high NANOG expression possessing high self-renewal efficiency, and low NANOG expression exhibiting increased differentiation propensity. NANOG, OCT4 and SOX2 are currently considered to activate transcription of each of the three genes, an architecture that cannot readily account for NANOG heterogeneity. Here, we examine the architecture of the Nanog-centred network using inducible NANOG gain- and loss-of-function approaches. Rather than activating itself, Nanog activity is autorepressive and OCT4/SOX2-independent. Moreover, the influence of Nanog on Oct4 and Sox2 expression is minimal. Using Nanog:GFP reporters, we show that Nanog autorepression is a major regulator of Nanog transcription switching. We conclude that the architecture of the pluripotency gene regulatory network encodes the capacity to generate reversible states of Nanog transcription via a Nanog-centred autorepressive loop. Therefore, cellular variability in self-renewal efficiency is an emergent property of the pluripotency gene regulatory network.
Keywords: heterogeneity, nanog, network, pluripotency, self-renewal
Introduction
For stem cell populations to remain effective, they must balance manifestation of their two defining properties: self-renewal and differentiation (Silva and Smith, 2008). This is achieved by non-genetic heterogeneity, a prominent topic at the forefront of stem cell research (Huang, 2009). Indeed, heterogeneous gene expression is a recurrent property of stem cells that underpins their developmental potency and plasticity (Graf and Stadtfeld, 2008; Martinez-Arias and Brickman, 2009). This has made stem cells a useful model system to study how heterogeneity in gene expression is generated and used by individual cells to undertake decision-making processes (Balazsi et al, 2011).
A paradigmatic example is provided by embryonic stem (ES) cell populations, where a subset of the cells do not express NANOG, the master regulator of the efficiency of self-renewal (Chambers et al, 2003, 2007; Mitsui et al, 2003; Singh et al, 2007; Kalmar et al, 2009). Consequently, NANOG-negative ES cells possess an increased differentiation propensity compared with the highly self-renewing NANOG-positive subpopulation, in which high NANOG levels shield cells from commitment signals (Chambers et al, 2003, 2007). Moreover, NANOG expression is mosaic in the inner cell mass of the blastocyst from which ES cells are derived (Chazaud et al, 2006; Dietrich and Hiiragi, 2007; Plusa et al, 2008; Nichols and Smith, 2011). While NANOG-positive cells are the founders of the epiblast from which the embryo proper originates, NANOG-negative cells give rise to the primitive endoderm, which contributes to extra-embryonic tissues. Therefore, heterogeneous NANOG expression enables important fate decisions and its relevance is illustrated by the observation that elimination of NANOG heterogeneity is associated with a failure to undergo normal embryogenesis and with a considerable resistance of ES cells to differentiate (Chambers et al, 2003, 2007; Nichols et al, 2009).
The mechanisms associated with heterogeneous NANOG expression are largely unknown and ill-defined. However, it is known that NANOG heterogeneity is governed by transcriptional switching of Nanog (Chambers et al, 2007; Kalmar et al, 2009). Thus, instead of acting as a static regulatory platform continuously preserving the undifferentiated state, the gene regulatory network supporting self-renewal is dynamic, intermittently silencing Nanog to provide temporal opportunities for differentiation. When this study was initiated, the view of the network proposed that Nanog and other regulators form a stable, self-sustaining circuitry consisting of positive autoregulatory and feed-forward loops (Jaenisch and Young, 2008). In particular, NANOG was believed to activate transcription of Oct4 and Sox2, two additional pluripotency factors, which in turn activate themselves, each other and Nanog (Figure 1A). Although this architecture appears intuitively advantageous for the efficient maintenance and exit from pluripotency, it predicts the emergence of coherent expression patterns of OCT4, SOX2 and NANOG. However, fluctuating Nanog transcription occur within cells expressing relatively uniform levels of OCT4/SOX2 (Chambers et al, 2007).
Figure 1.
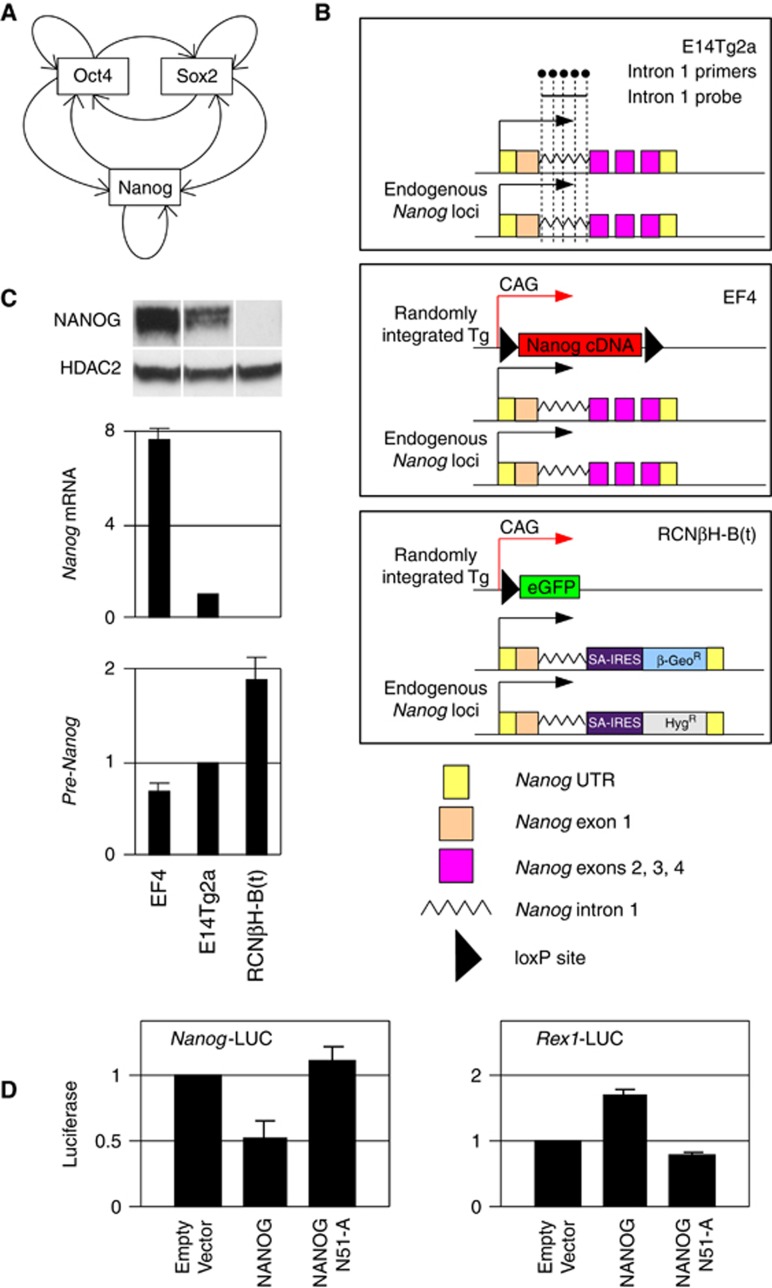
Negative correlation between NANOG protein levels and transcription activity of the Nanog locus. (A) Architecture of the core pluripotency network inferred from genome-wide analyses (Jaenisch and Young, 2008). (B) Schematic diagram of WT E14Tg2a, NANOG overexpressing EF4 and Nanog−/− RCNβH-B(t) cells. Note the presence of Nanog intron 1 sequences at the endogenous Nanog locus of all lines: this is the region were the RT–(Q)PCR primers (black dots within the E14Tg2a diagram) and the RNA-FISH probe (black line within the E14Tg2a diagram) were designed and used to detect the activity of the Nanog locus. A full description of these cell lines can be found in previous publications (Chambers et al, 2003, 2007). Tg, transgene. (C) Analysis of the level of NANOG protein, Nanog mRNA and Nanog-derived pre-mRNA (E14Tg2a RNA levels set to 1) in EF4, E14Tg2a and RCNβH-B(t) ES cells (n=2; error bars represent s.e.m.). (D) Co-transfection of either a luciferase reporter driven by a 6-kb-long Nanog promoter (left), or by a Rex1 promoter (right panel) in supertransfectable E14/T ES cells (Chambers et al, 2003) with either an empty vector (EV, set to 1), a NANOG-expressing vector (NANOG) or a vector expressing a mutant form of NANOG unable to bind DNA (NANOG:N51-A). n=2; error bars represent s.e.m.
As autoregulation is widely associated with the dynamic behaviour of regulatory networks (Balazsi et al, 2011), we aimed to examine the details of Nanog autoregulation. To do so, we used a genetic approach consisting of inducible systems of gain- and loss-of-function combined with Nanog:GFP reporters. In agreement with a recent report (Fidalgo et al, 2012), we establish that the current architecture of the core pluripotency network must be overturned: Nanog activity is autorepressive. Moreover, we report that the NANOG-mediated control of Oct4/Sox2 expression is minimal. We further show that the autorepressive mechanism does not involve OCT4/SOX2 and, importantly, that Nanog autorepression controls switching of Nanog transcription to modulate Nanog gene expression heterogeneity.
Results
NANOG negatively influences Nanog transcription
In several regulatory networks associated with fluctuating gene expression, one or more of the components are negatively autoregulated, either directly or indirectly (Balazsi et al, 2011). However, in the case of the pluripotency gene regulatory network, NANOG is considered to act as a transcriptional activator of Nanog gene expression (Figure 1A; Jaenisch and Young, 2008). To experimentally test the validity of this idea, we used quantitative RT–PCR (RT–(Q)PCR) to determine the level of pre-messenger RNA produced by the Nanog locus in cell lines expressing differing levels of NANOG (Figure 1B and C). We used five primer pairs located within a region of Nanog intron 1 that remains intact in Nanog-null ES cells to assess the transcriptional activity of the Nanog locus in wild-type (WT) ES cells (E14Tg2a), Nanog-null ES cells (RCNβH-B(t)) and in cells overexpressing NANOG from a randomly integrated cDNA transgene (EF4). In contrast to the accepted model, we found a negative correlation between the level of Nanog mRNA and protein (derived from the endogenous alleles in E14Tg2a and from both the endogenous alleles and the transgene in EF4) and the level of transcription of the endogenous Nanog locus (Figure 1C). This may suggest that NANOG negatively affects transcription of the Nanog gene. In agreement, we found that a luciferase gene driven by a 6-kb-long Nanog promoter region is repressed by co-transfecting a vector expressing WT NANOG but not a variant in which the DNA-binding homeodomain carries a point mutation known to abolish binding of homeodomain proteins to DNA (Pomerantz and Sharp, 1994; NANOG:N51-A, Figure 1D). Conversely, a Rex1 promoter-driven luciferase gene was shown to be trans-activated by NANOG (Figure 1D), confirming that NANOG can both activate or repress transcription from distinct pluripotency-associated promoters.
The inducible loss of NANOG leads to increased Nanog transcription
To address whether the upregulation of Nanog transcription is a primary response to the loss of NANOG, we first analysed the dynamics of pre-messenger transcription from the endogenous Nanog locus in inducible Nanog-null cells by using RCNβH cells, the parental line from which RCNβH-B(t) cells were derived (Chambers et al, 2007). RCNβH cells are Nanog-null cells that express Nanog mRNA from a constitutive transgene from which the Nanog ORF can be deleted by Tamoxifen treatment. Upon deletion of the Nanog transgene, GFP is brought under the control of the constitutive CAG promoter (Figure 2A).
Figure 2.
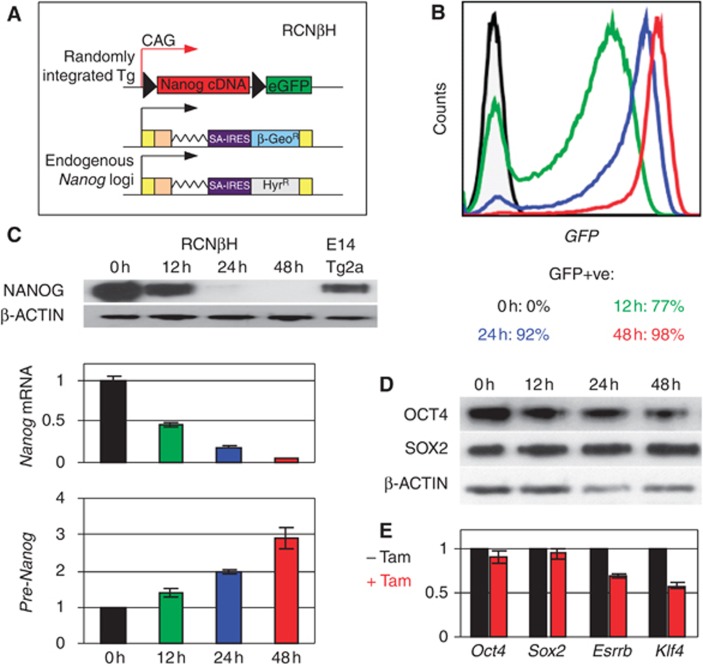
Endogenous Nanog transcription is rapidly upregulated upon loss of exogenous NANOG expression. (A) Schematic diagram of Tamoxifen-inducible Nanog-null ES cells. In addition to the different features shown, RCNβH ES cells carry a Cre-ERT2 transgene knocked-in to Rosa26. (B) FACS profiles monitoring the deletion of the Nanog cDNA transgene after 12, 24 and 48 h of Tamoxifen treatment. (C) Analysis of NANOG protein (top), Nanog mRNA (middle), and Nanog pre-mRNA expression (bottom) in RCNβH cells treated with Tamoxifen for 0 (set to 1 for the RT–(Q)PCR), 12, 24 and 48 h (n=2; error bars represent s.e.m.). (D) Western blot analysis of OCT4 and SOX2 at the same time points of Tamoxifen treatment. (E) Relative expression of Oct4, Sox2, Esrrb and Klf4 transcripts after 48 h of Tamoxifen treatment (untreated cells set to 1; n=7; error bars represent s.e.m.).
After 12 h of Tamoxifen treatment, around 75% of the cells have undergone the deletion of the Nanog transgene as evaluated by FACS analysis (Figure 2B). However, exogenous Nanog mRNA and protein is only reduced by half and this is accompanied by a modest upregulation of endogenous Nanog locus transcription (Figure 2C). After 48 h of treatment, when 98% of the cells are GFP-positive (Figure 2B) and exogenous NANOG protein and mRNA become essentially undetectable (Figure 2C), the production of pre-mRNA from the endogenous Nanog locus has increased three-fold (Figure 2C). Importantly, OCT4 and SOX2 protein (Figure 2D) and mRNA (Figure 2E) remained expressed following loss of exogenous NANOG expression, suggesting efficient maintenance of the undifferentiated state. However, other pluripotency genes such as Klf4 and Esrrb were downregulated after 48 h of Tamoxifen treatment (Figure 2E).
The inducible restoration of NANOG leads to reduced Nanog transcription
In a complementary approach, we introduced a transgene encoding a NANOG-ERT2 fusion protein to an independent Nanog-null ES cell line (TβC44Cre6; Chambers et al, 2007) in order to restore nuclear NANOG expression upon Tamoxifen treatment (44NERT; Figure 3A). Three independent clones were generated, two expressing Nanog transcripts at similar levels to WT ES cells (44NERTc1&2) and one in which Nanog transcripts are increased (44NERTc3; Figure 3B). However, immunoblot analyses indicated that in the three clones, and in particular in 44NERTc3, NANOG-ERT2 is overexpressed as compared with the level of WT NANOG detected in E14Tg2a cells (Figure 3C). The nuclear translocation of NANOG-ERT2 triggered by Tamoxifen (Figure 3D) leads to an accompanying reduction of endogeneous Nanog pre-mRNA expression to ∼50% of starting levels by 6 h (Figure 3E), in cells that display unchanged levels of OCT4 and SOX2 (Figure 3F). After 24 h of Tamoxifen treatment, endogenous Nanog downregulation is maintained while OCT4 and SOX2 mRNA and protein levels remain unaffected (Figure 3G and H). In contrast, increased levels of Esrrb and Klf4 mRNA (Figure 3G) and pre-mRNA (Figure 3I) were detected upon Tamoxifen treatment, mirroring the results observed in RCNβH cells.
Figure 3.
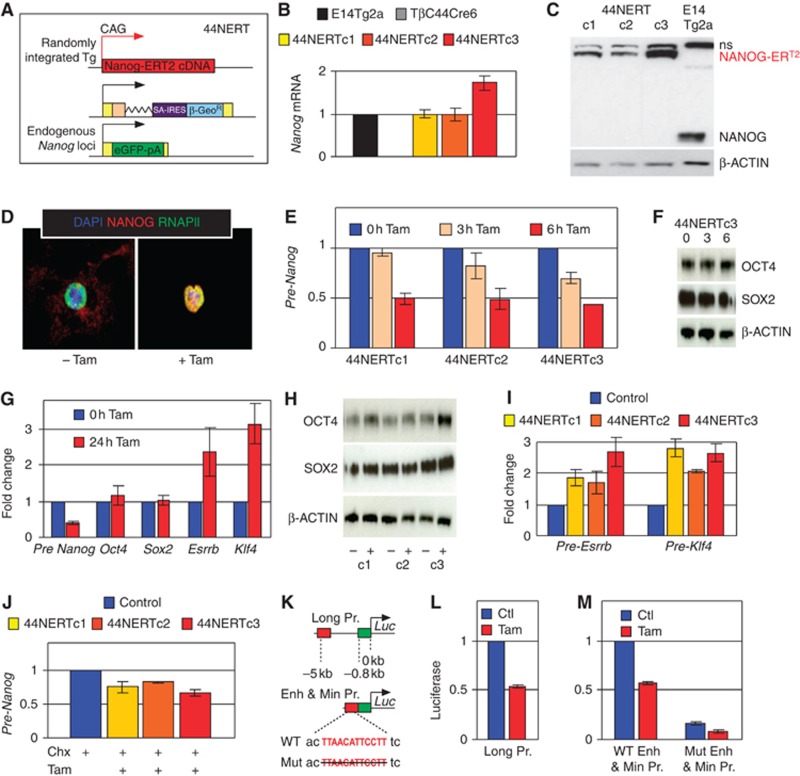
Endogenous Nanog transcription is rapidly downregulated upon restoration of nuclear NANOG expression. (A) Schematic diagram of Tamoxifen-inducible 44NERT cells. (B) Relative expression of Nanog mRNA in WT E14Tg2a cells, Nanog-null TβC44Cre6 (a schematic picture of this line is shown in Figure 7C), and three independent 44NERT clones (n=3; error bars represent s.e.m.). (C) Immunoblot analysis of NANOG expression in 44NERT and WT E14Tg2a ES cells (n.s. designates a non-specific band). (D) Immunofluorescence detection of NANOG (red) and the RNAPII (green) in 44NERTc3 cells before (left) and after 30 min of Tamoxifen treatment (right), on DAPI-stained nuclei (blue). (E) Relative quantification of endogenous Nanog-driven pre-mRNA after 0 (set to 1 for each clone), 3 and 6 h of Tamoxifen treatment in three independent 44NERT clones (n=2; error bars represent s.e.m.). (F) Immunoblot analysis of OCT4 and SOX2 after 3 and 6 h of Tamoxifen treatment of 44NERTc3 cells. (G) Relative expression of Nanog pre-mRNA, and of four pluripotency transcripts (Oct4, Sox2, Esrrb and Klf4) after 24 h of Tamoxifen treatment (n=6; error bars represent s.e.m.). (H) Immunoblot analysis of OCT4 and SOX2 in untreated and 24 h-treated 44NERT clones. (I) Relative quantification of Esrrb and Klf4 pre-mRNA production after 3 h of Tamoxifen treatment in the three 44NERT clones. (J) Relative quantification of Nanog locus pre-mRNA in the three 44NERT clones treated for 2.5 h with either Cycloheximide (Chx, set to 1 for each clone and shown as a single bar; Control), or Cycloheximide plus Tamoxifen (n=2; error bars represent s.e.m.). (K) Schematic representation of the three luciferase reporter constructs used in this study. (L) Relative luciferase activity of 44NERTc3 cells transfected with the Long Pr. construct and treated for 24 h with Tamoxifen (untreated cells set to 1; n=2; error bars represent s.e.m.). (M) Relative luciferase activity of 44NERTc3 cells transfected with either the WT-Enh & Min Pr. or the Mut-Enh & Min Pr. constructs and treated for 24 h with Tamoxifen (untreated cells transfected with the WT construct were set to 1; n=2; error bars represent s.e.m.).
Our results show that the Nanog gene responds rapidly to the inducible depletion and restoration of NANOG. Whether this effect is a direct consequence of NANOG activity was investigated by treating 44NERT cells with Tamoxifen and Cycloheximide, a potent inhibitor of protein synthesis. Compared with cells treated with Cycloheximide alone, cells treated with Tamoxifen and Cycloheximide for 2.5 h displayed a 25% (clone#1), 18% (clone#2) and 35% (clone#3) downregulation of endogenous Nanog pre-mRNA (Figure 3J). Thus, the effect of NANOG is independent of any additional putative repressor of Nanog, whose expression may be activated by NANOG.
NANOG represses Nanog through unknown binding sites
Our results contrast markedly with the generally accepted model of Nanog autoregulation, and in particular with a previous report showing that a putative NANOG-binding site located 5-kb upstream of the Nanog transcription start site conferred high transcriptional activity to a luciferase gene driven by the minimal Oct4 promoter (Wu et al, 2006). To investigate this discrepancy, we established a luciferase strategy in 44NERTc3 cells, in which transfection of the 6-kb-long Nanog promoter/luciferase construct (Long Pr. construct, Figure 3K) recapitulates the NANOG-mediated repression of Nanog-driven transcription upon Tamoxifen treatment (Figure 3L). We then generated a chimaeric reporter in which the −5 kb region was positioned adjacent to the minimal Nanog promoter instead of the Oct4 promoter used by Wu et al (WT-Enh & Min Pr. Figure 3K). We found that Tamoxifen treatment of 44NERTc3 cells transfected with this DNA recapitulated the ∼50% reduction in luciferase activity observed with the Long Pr. construct (Figure 3M). Next, we introduced the same deletion of the putative NANOG-binding site previously assessed (Mut-Enh & Min Pr., Figure 3K; Wu et al, 2006). When this reporter was transfected into 44NERTc3 cells, reduced luciferase activity was observed compared with the WT-Enh & Min. Pr reporter (Figure 3M), as previously shown (Wu et al, 2006). However, this decrease was observed in cells that were not treated with Tamoxifen (i.e., in the absence of nuclear NANOG), indicating that the reduced activity conferred by this mutation is not due to a lack of NANOG binding as speculated previously. Moreover, addition of Tamoxifen reduced the activity of the mutant construct by around 50%, similar to the reduction observed with the WT-Enh & Min Pr. (Figure 3M). We conclude from this that the previously identified putative NANOG-binding site is not responsible for NANOG-mediated regulation of Nanog. While it is also clear that an as yet unknown transcriptional activator binds to the deleted region, our results indicate strongly that Nanog is subject to direct autorepression through NANOG binding to unknown sites within the −5 kb region.
Dose response of NANOG-mediated repression of Nanog
After 3 and 6 h of Tamoxifen treatment, Nanog pre-mRNA is slightly more downregulated in 44NERTc3 cells than in the other two clones (Figure 3E). Similarly, FACS analyses of GFP expression, which in 44NERT cells is expressed from one of the endogenous Nanog alleles (Figure 3A), confirmed both that endogenous Nanog gene activity is reduced upon Tamoxifen treatment and that this reduction is more prominent in 44NERTc3 than in 44NERTc1 and c2 cells (Figure 4A). This was particularly obvious when the relative Nanog:GFP population median was calculated (Figure 4B). Given that 44NERTc3 expresses the highest levels of NANOG-ERT2 among the three 44NERT clones (Figure 3C), this suggests that the NANOG-mediated repression of Nanog might be dose responsive.
Figure 4.
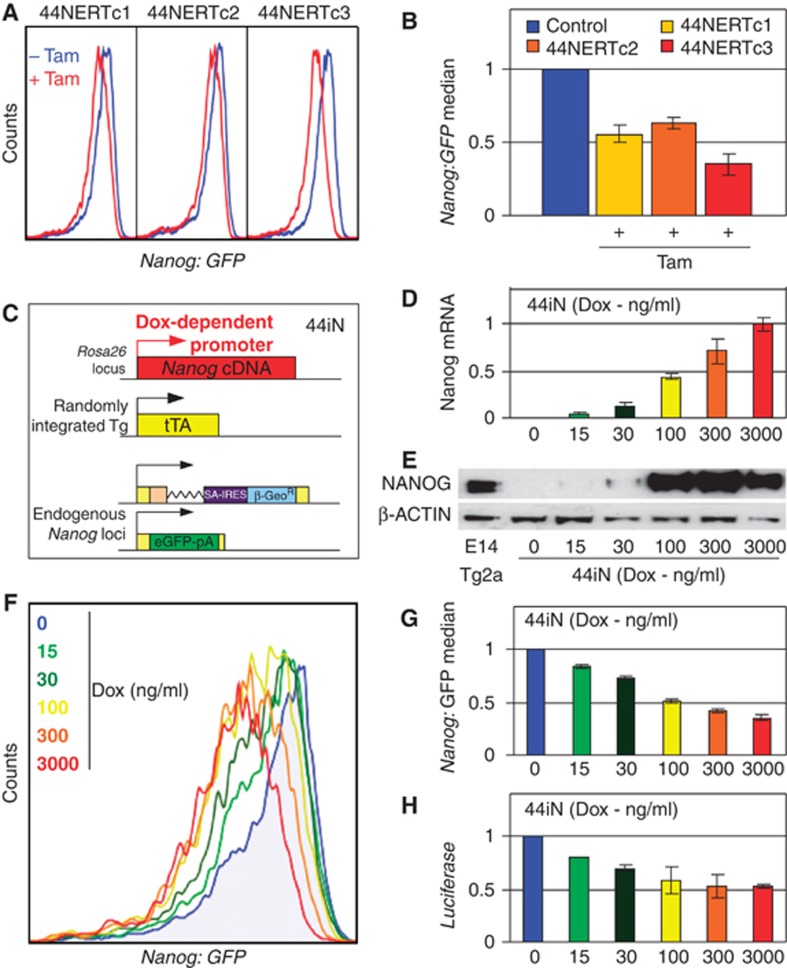
Dose responsiveness of NANOG-mediated repression of Nanog. (A) FACS profiles of the three 44NERT clones before (blue) and after 48 h of Tamoxifen treatment (red). (B) Relative Nanog:GFP population median in untreated (blue, set to 1 for each clone and shown as a single bar; Control) and Tamoxifen-treated 44NERT clones (n=2; error bars represent s.e.m.). (C) Schematic diagram of Doxycycline-inducible 44iN cells. (D) Relative Nanog mRNA expression measured in 44iN cells treated for 48 h with the indicated concentrations of Doxycycline (3000, ng/ml set to 1; n=3; error bars represent s.e.m.). (E) Immunoblot analysis of NANOG expression in WT E14Tg2a and in 44iN cells treated for 48 h with the indicated concentrations of Doxycycline. (F) FACS profiles of untreated and Doxycycline-treated 44iN cells (48 h at the indicated doses). (G) Relative Nanog:GFP population median in untreated (blue, set to 1) and Doxycline-treated 44iN cells (48 h at the indicated doses; untreated cells set to 1; n=3; error bars represent s.e.m.). (H) Luciferase activity driven by a 6-kb-long Nanog promoter transfected in 44iN cells and treated with different doses of Doxycycline for 24 h (untreated cells set to 1; n=2; error bars represent s.e.m.).
To more rigorously assess the dose-responsiveness of the NANOG-mediated repression of Nanog, in particular at low cellular doses, we used an independent genetic system of NANOG restoration (44iN cells; Festuccia et al, 2012). Like 44NERT cells, 44iN were derived from TβC44Cre6 cells and therefore express the GFP from one Nanog allele. Moreover, a WT version of NANOG can be expressed upon addition of Doxycycline to 44iN cultures (Figure 4C). Treatment of 44iN cells with increasing concentrations of Doxycycline leads to a progressive increase of exogenous Nanog mRNA expression (Figure 4D). Immunoblot analyses (Figure 4E) showed that among the tested conditions, two were associated with levels of NANOG clearly below WT levels (15 and 30 ng/ml of Doxycycline), whereas three other conditions produced elevated levels of NANOG expression (100, 300 and 3000, ng/ml of Doxycycline).
Analysis of the FACS profiles showed that at all concentrations of Doxycycline, Nanog:GFP is downregulated as compared with untreated 44iN cells (Figure 4F). Interestingly, when the Nanog:GFP population median was plotted, a gradual and progressive downregulation of Nanog:GFP expression was observed (Figure 4G), starting from the lowest concentration of Doxycycline which is associated with very low levels of exogeneous NANOG (Figure 4D and E). Moreover, when untreated 44iN cells were transfected with the 6-kb-long Nanog promoter/luciferase construct and cultivated for 24 h in the same range of Doxycycline concentrations, a gradual reduction in luciferase activity was observed with increasing doses of Doxycycline (Figure 4H). We conclude that even at low concentrations, NANOG represses endogeneous Nanog transcription in a clear dose-response manner.
Transcriptional foundation of Nanog autorepression
The results presented above, in which pre-mRNA production by the Nanog locus responds rapidly to the loss and restoration of NANOG function (Figures 2, 3, 4), suggest that transcriptional mechanisms underlie NANOG-mediated repression of Nanog. In line with the idea of direct and transcriptional Nanog autorepression, chromatin immunoprecipitation (ChIP) analyses have shown that NANOG binds at the Nanog locus. Indeed, it is clear from genome-wide studies that two hotspots of transcription factor binding control Nanog transcription in ES cells: the promoter and a 5-kb upstream region where NANOG binding occurs (Loh et al, 2006; Chen et al, 2008; Marson et al, 2008; Kim et al, 2008). Using ChIP with 22 primer pairs covering 9 kb of the Nanog locus from −6 kb to +3 kb relative to the transcription start site (Figure 5A), we observed maximal binding of NANOG at the −5 kb region (Figure 5B). Importantly, NANOG binding is appropriately abolished (Figure 5C) and restored (Figure 5D) upon Tamoxifen treatment of RCNβH and 44NERT ES cells, respectively.
Figure 5.
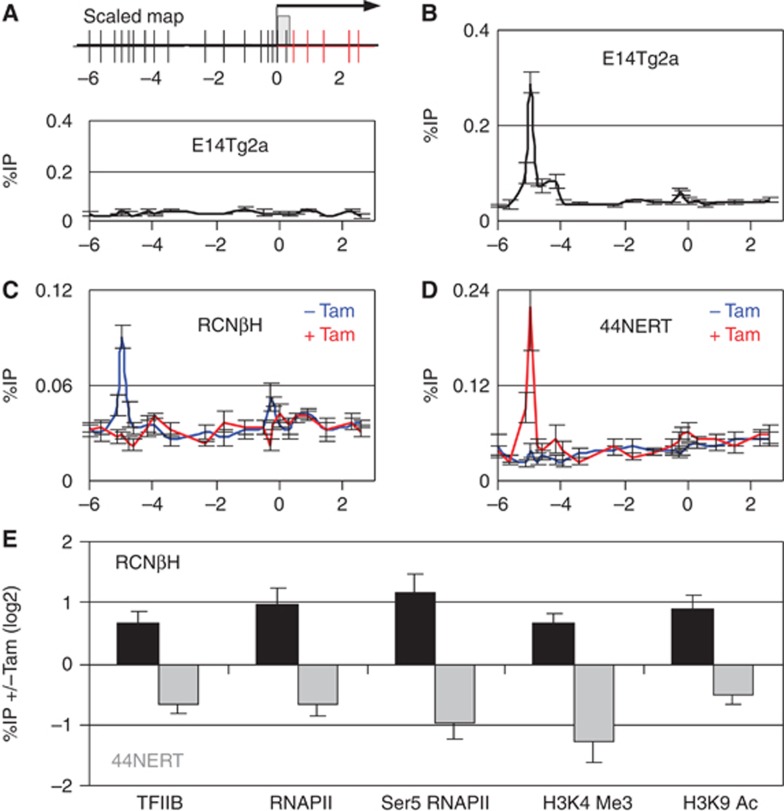
Transcriptional foundation of Nanog autorepression. (A) (Top) Schematic representation of the 5′ end of the Nanog locus analysed by ChIP. Each vertical bar represents a primer pair. The five primer pairs coloured in red are located within Nanog intron 1 and were used to detect pre-mRNA transcription from the endogenous locus (also represented in Figure 1B). The arrow represents the transcription start site (TSS) of Nanog, and the grey box Nanog exon 1. (Bottom) ChIP profile obtained in E14Tg2a using an irrelevant IgG as a negative control (n=2). (B–D) ChIP analysis of NANOG across the Nanog 5′ region in the indicated lines and conditions (B, E14Tg2a, n=4; C, RCNβH, n=6; D, 44NERT, n=6). (E) Tamoxifen-induced changes in binding of the indicated factors at the Nanog promoter as determined by ChIP in RCNβH (48 h of Tamoxifen treatment) and 44NERT (24 h of Tamoxifen treatment). Error bars represent s.e.m.
To firmly establish the transcriptional foundation of Nanog autorepression, we monitored the modifications occurring at the Nanog promoter upon loss and restoration of NANOG function. The loss of NANOG binding at Nanog in RCNβH cells was associated with increased recruitment of the transcriptional machinery to the Nanog promoter, including the general transcription factor TFIIB, the RNA Polymerase II and its Ser5-phosphorylated form (Figure 5E). This was accompanied by increased enrichment of histone marks widely associated with euchromatin and gene activation such as tri-methylation of H3K4 and acetylation of H3K9 (Figure 5E). Conversely, restoring nuclear NANOG to 44NERT cells leads to the exact opposite consequences (Figure 5E). Altogether, our results suggest that NANOG acts as a direct transcriptional repressor of Nanog gene transcription.
OCT4 triggers SOX2 binding at Nanog and activates Nanog transcription
As our results established that NANOG represses itself, a result which is contrary to the generally accepted model of Nanog regulation by pluripotency transcription factors, we probed OCT4-mediated control of Nanog. Using ChIP, we found that OCT4 (Figure 6A) and its interacting partner SOX2 (Figure 6B), bind at the −5 kb and promoter regions of Nanog. In contrast to NANOG, maximal binding of OCT4 and SOX2 was detected at the Nanog promoter in the vicinity of the characterised Oct/Sox motif (Kuroda et al, 2005; Rodda et al, 2005).
Figure 6.

Mutual independence of Nanog autorepression and OCT4/SOX2-mediated activation. (A) ChIP analysis of OCT4 binding at Nanog in E14Tg2a (n=5). (B) ChIP analysis of SOX2 binding at Nanog in E14Tg2a (n=5). (C, D) ChIP analysis of binding at Nanog after 12 h of Doxycycline treatment of ZHBTc4 cells for OCT4 (C, n=7) and SOX2 (D, n=8). (E) Changes in Nanog mRNA and pre-mRNA levels (n=7) and binding levels of RNAPII (n=3) and TFIIB (n=3) at the Nanog promoter, after 12 h of Doxycycline treatment of ZHBTc4 ES cells (untreated cells set to 1; error bars represent s.e.m.). (F) ChIP analysis of NANOG binding at Nanog after 12 h of Doxycycline treatment of ZHBTc4 cells (n=6). (G–J) ChIP analysis of OCT4 and SOX2 in RCNβH (n=4) and 44NERT (n=3) inducible systems. (K) Relative expression of total Nanog transcripts in ZHBTc4 ES cells (set to one) and in two derivative lines in which the NANOG-ERT2 transgene was randomly integrated (ZNERTc1&2, n=2). (L) Expression of Nanog pre-mRNA in untreated ZNERT clones (Ctl, set to 1) and after 12 h of treatment with the indicated molecules (n=2 for each condition, error bars represent s.e.m.).
We next used ZHBTc4 ES cells in which both Oct4 alleles are deleted and OCT4 expression is supported by a Doxycycline suppressible transgene (Niwa et al, 2000). After 12 h of treatment, OCT4 binding is no longer detectable (Figure 6C). The loss of OCT4 is associated with a lack of SOX2 binding at the Nanog promoter (Figure 6D) and to a downregulation of Nanog transcription as illustrated by reduced levels of Nanog pre-mRNA production and decreased recruitment of the RNAPII and TFIIB at the Nanog promoter (Figure 6E). These results confirm previous studies, indicating that OCT4 is required for SOX2 to bind at Nanog such that they can together activate transcription from the Nanog promoter (Kuroda et al, 2005; Rodda et al, 2005; Rahl et al, 2010).
Nanog autorepression and OCT4/SOX2-mediated activation are independent
Upon loss of OCT4, there is small decrease in NANOG binding at Nanog (Figure 6F) consistent with the slight reduction in Nanog expression (Figure 6E). If OCT4 was required for NANOG to bind at the −5 kb region, then we should have observed a more drastic reduction of NANOG binding in Doxycycline-treated ZHBTc4 cells, such as is observed for SOX2 at the Nanog promoter (Figure 6D). This therefore indicates that NANOG binding at Nanog is independent from OCT4/SOX2. Furthermore, we found that the level of binding of OCT4 and SOX2 to Nanog remains essentially unaltered upon loss or restoration of NANOG binding in RCNβH or 44NERT ES cells, respectively (Figure 6G–J). This suggests that the autorepressive activity associated with NANOG does not influence binding of OCT4/SOX2.
Finally, to determine whether NANOG binding to Nanog affected OCT4/SOX2 function, we introduced the NANOG-ERT2 transgene into ZHBTc4 cells (generating ZNERT cells, Figure 6K). Upon treatment with Doxycycline or Tamoxifen, transcription of the endogenous Nanog locus was reduced in independent ZNERT clones (Figure 6L). Notably, repressive activity is increased when ZNERT cells are simultaneously treated with Tamoxifen and Doxycycline (Figure 6L). The ability of NANOG to further repress endogeneous Nanog transcription, even when binding of OCT4 to Nanog is abolished and when binding of SOX2 to Nanog is dramatically reduced, strongly supports the notion that Nanog autorepression is not mediated by interference with the OCT4/SOX2-dependent activation of Nanog transcription.
NANOG decreases the probability of Nanog transcription
To assess whether the difference in Nanog transcription levels observed upon modulation of NANOG binding at Nanog (Figures 1, 2, 3, 4, 5) results from partial modulations affecting all the cells in the population or, alternatively, is associated with a variation in the number of cells transcribing Nanog, we established an RNA-FISH approach to analyse nascent RNA transcription from the endogenous Nanog locus in single cells (Figure 7A). As for the RT–PCR analysis, we took advantage of the region of Nanog intron 1 remaining intact in Nanog-null cells to design an intronic, 2-kb-long probe that could be used in all our cell lines (Figure 1B). We observed that the proportion of cells transcribing Nanog is inversely correlated to NANOG levels (Figure 7B) in cells overexpressing NANOG from a transgene (EF4), WT cells (E14Tg2a) and Nanog-null cells (RCNβH-B(t)). Likewise, the loss of exogenous NANOG in RCNβH cells leads to an increase in the proportion of cells transcribing endogenous Nanog, whereas this proportion is reduced upon restoration of NANOG in 44NERT (Figure 7B). Thus, the differences in Nanog transcription levels that we observed within a population upon alteration of NANOG activity are due to changes in the number of cells actively transcribing Nanog and not to a variation in the expression level of cells already transcribing Nanog. Interestingly, in populations of cells permanently expressing exogenous NANOG (EF4, Tamoxifen-untreated RCNβH and Tamoxifen-treated 44NERT), Nanog is not homogenously silent. Conversely, in cells lacking NANOG activity (RCNβH-B(t), Tamoxifen-treated RCNβH and Tamoxifen-untreated 44NERT), Nanog is not homogenously active. This suggests that additional activities contribute to the frequency of Nanog transcription in ES cell populations.
Figure 7.
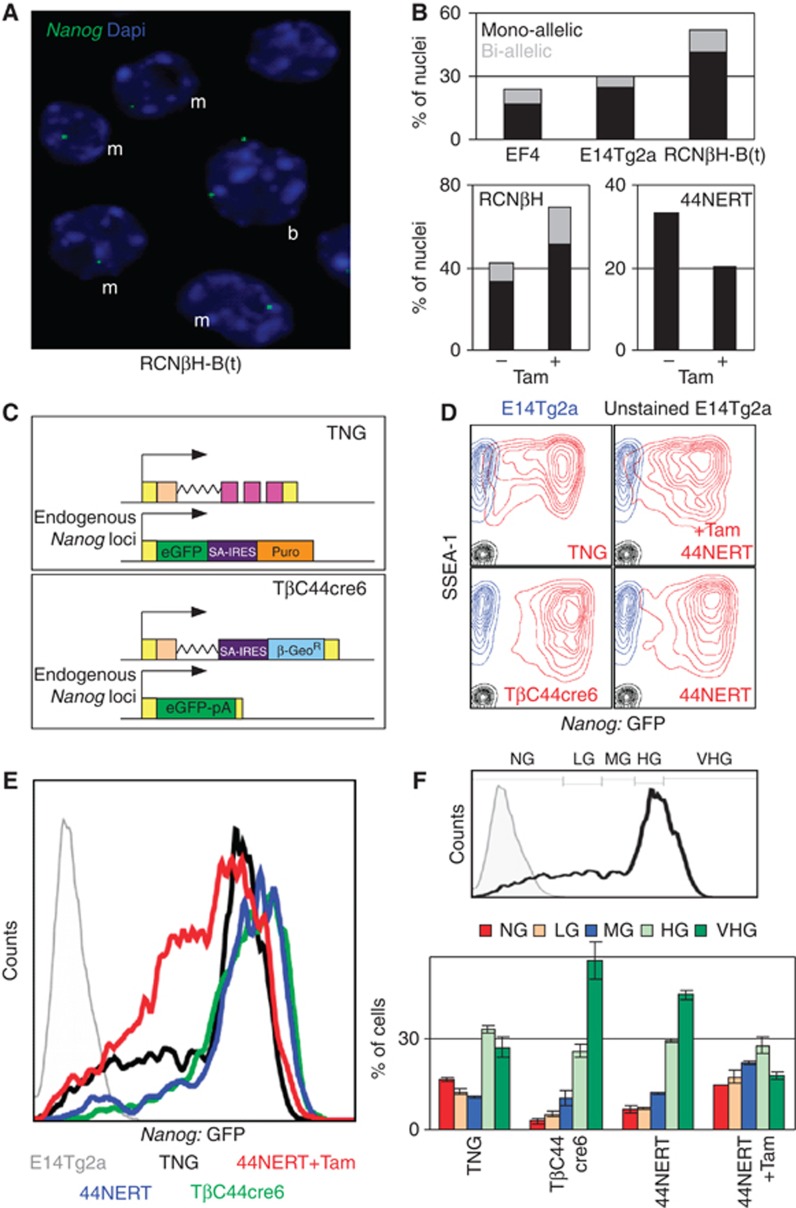
NANOG maximises Nanog:GFP heterogeneity. (A) Representative RNA-FISH conducted in RCNβH-B(t) with a probe recognising 2 kb of Nanog intron I (blue, DAPI; green, Nanog RNA-FISH probe). ‘m’ indicates cells displaying monoallelic transcription and ‘b’ cells transcribing Nanog biallelically. (B) Quantification of RNA-FISH experiments in the indicated lines and conditions. Note that in 44NERT ES cells only the non-GFP allele can be visualised with the intronic probe (Figure 3A). The total number of counted nuclei is as follows: E14Tg2a, 422; EF4, 234; RCNβH-B(t), 385; RCNβH –Tam, 225; RCNβH +Tam, 308, 44NERT –Tam, 115; 44NERT+Tam, 114. (C) Schematic diagram of Nanog:GFP reporters retaining a functional Nanog locus (TNG) or not (TβC44Cre6) (D) FACS analysis of GFP (x axis) and SSEA-1 (y axis) expression in TNG, TβC44Cre6 and 44NERTc3 cells (treated as indicated with Tamoxifen) cultured in parallel for 5 days in the absence of selection for Nanog transcription (red lines). Non-GFP E14Tg2a are shown as controls either unstained (black) or SSEA-1 stained (blue). (E) Histogram representing the level and distribution of GFP expression for the indicated cell lines after gating for high SSEA-1 expression as shown in (D). (F) (Top) Relative position of the gates used to quantify the proportion of cells residing in distinct Nanog:GFP compartments, established on the basis of TNG (black histogram) and non-fluorescent ES cells (E14Tg2a, grey histogram). NG, negative; LG, low GFP; MG, medium GFP; HG, high GFP; VHG, very high GFP. (Bottom) Averaged proportion of cells expressing different levels of GFP in each of the indicated cell lines (n=3, error bars represent s.e.m.).
We found Nanog transcription to be preferentially monoallelic in ES cells, as recently reported (Miyanari and Torres-Padilla, 2012). However, the relative proportion of mono- and biallelically transcribing cells is unchanged under all our experimental conditions, with around 20% of cells in which transcription can be detected originating from both alleles (Figure 7B). Although using RNA-FISH we cannot exclude that NANOG does not control the dynamic properties of mono/biallelic switching, the maintenance of a similar ratio of mono/biallelically transcribing cells in all our experimental conditions indicates that the variation in Nanog pre-mRNA production that we observe upon loss/restoration of NANOG does not result from a major mono/biallelic switch.
NANOG maximises Nanog transcription heterogeneity
The RNA-FISH experiments indicate that NANOG reduces the probability of Nanog transcription, suggesting that Nanog autorepression may contribute to the generation of a heterogeneous expression profile. To further examine the relationship between heterogeneous NANOG expression and Nanog transcription, we used the previously described TNG and TβC44Cre6 cell lines, which express GFP from the Nanog locus (Chambers et al, 2007). Whereas in TNG the remaining Nanog allele is WT, in TβC44Cre6 the other Nanog allele has been deleted (Figure 7C). We also monitored Nanog:GFP expression in 44NERT cells in which nuclear NANOG activity can be experimentally controlled with Tamoxifen (Figure 3A). These three cell lines were plated in parallel, and cultured for 5 days after which expression of GFP and of SSEA-1, a marker of the undifferentiated state, were assessed by FACS (Figure 7D). Overall, no drastic differences in SSEA-1 expression were observed, with the large majority of cells being SSEA-1 positive. However, compared with TNG cells only a small fraction of the TβC44Cre6 and 44NERT cell population was Nanog:GFP-negative, as delimited by the analysis of non-GFP ES cells (Figure 7D). Upon Tamoxifen treatment, 44NERT cells gave rise to a significant population of Nanog:GFP-negative cells. This indicates that Nanog autorepression contributes to the generation of cells in which Nanog transcription is silent.
Further analysis of the GFP profile corresponding to the SSEA-1 high subpopulation (Figure 7D) showed clear differences between cells expressing active NANOG (TNG and Tamoxifen-treated 44NERT cells) and those which lack nuclear NANOG (TβC44Cre6 and 44NERT cells). In the absence of functional NANOG expression, the peak of GFP expression is located at a significantly higher level of GFP fluorescence (Figure 7E). Indeed, using the gating strategy outlined in Figure 7F, we found that the highest percentage of cells expressing very high levels of Nanog:GFP (VHG; Figure 7F) is observed in cells lacking nuclear NANOG. In response to Tamoxifen treatment, the peak of GFP expression in 44NERT cells is relocated to essentially the same fluorescence value as TNG cells (Figure 7E) and, importantly, there is a clear increase in the proportion of cells expressing no (NG), low (LG) and medium (MG) levels of Nanog:GFP (Figure 7F). In particular, the proportion of NG and LG cells increased by more than two-fold upon Tamoxifen treatment (Figure 7F).
NANOG is a major regulator of Nanog-state transitions
To determine the role of NANOG in the transitions between high and low Nanog:GFP expression, we used a FACS-sorting strategy in which we isolated 44NERT cells that were cultured in the absence of Tamoxifen and which expressed either very high levels of Nanog:GFP (VHG) or none at all (NG; Figure 7F). Following FACS-sorting, the cells were replated in either the presence or absence of Tamoxifen and cultured in parallel for 20 days. We used FACS analyses to determine the profiles of Nanog:GFP expression at 3, 5, 10 and 20 days post-sorting (Figure 8A). We found that in the presence of Tamoxifen, sorted VHG 44NERT cells transit faster and more efficiently to the Nanog:GFP-negative compartment than in the absence of Tamoxifen. Conversely, sorted NG 44NERT cells re-express Nanog:GFP efficiently only in the absence of Tamoxifen. We conclude that NANOG promotes the transition to and blocks the exit from the Nanog-inactive state.
Figure 8.
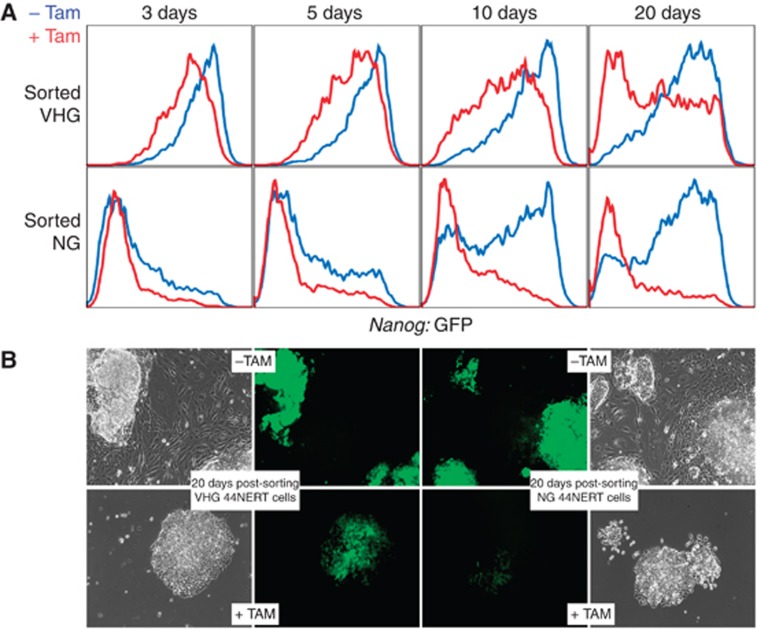
NANOG is a major regulator of transcriptional switching of Nanog. (A) Histograms representing the level and distribution of GFP after sorting 44NERTc3 cells expressing VHG levels (top) and NG levels (bottom) of Nanog:GFP and replating them in parallel for 3, 5, 10 and 20 days either in the absence (blue) or the presence of Tamoxifen (red). (B) Representative pictures of 44NERTc3 cells cultured for 20 days in the presence or absence of Tamoxifen (+/−TAM), after sorting VHG and NG subpopulations.
Following sorting of VHG/NG 44NERT cells, differentiation was observed exclusively in the absence of Tamoxifen (Figure 8B). Therefore, a fraction of the cells expressing reduced levels of Nanog:GFP in the absence of Tamoxifen are likely to correspond to the differentiation events typical of prolonged culture of Nanog-null cells in the absence of drug selection for expression of the endogenous loci (Chambers et al, 2007). This reinforces the major differences that we observe in the efficiency with which cells leave one of the extreme Nanog:GFP states and enter the other upon modulation of nuclear NANOG activity (Figure 8A). We conclude that Nanog autorepression promotes the transition to and the maintenance of the transcriptionally silent state of Nanog, thereby controlling the efficiency of transcriptional switching and the dynamics associated with heterogeneous NANOG expression.
Nanog autorepresion is operational in serum-free ‘2i+LIF’ conditions
Conventional culture of ES cells uses serum and LIF-containing medium. Recently however, supplementation of serum-free medium with LIF and inhibitors of MEK and GSK3 has been shown to enable maintenance of ES cell self-renewal (Ying et al, 2008). Under this so-called ‘2i+LIF’ conditions, spontaneous differentiation of ES cells is abrogated and this correlates with homogeneous NANOG expression throughout the ES cell culture (Wray et al, 2010; Marks et al, 2012). In agreement, we found that TNG cells cultured in ‘2i+LIF’ are morphologically undifferentiated and exhibit homogenous Nanog:GFP expression (Figure 9A and B).
Figure 9.
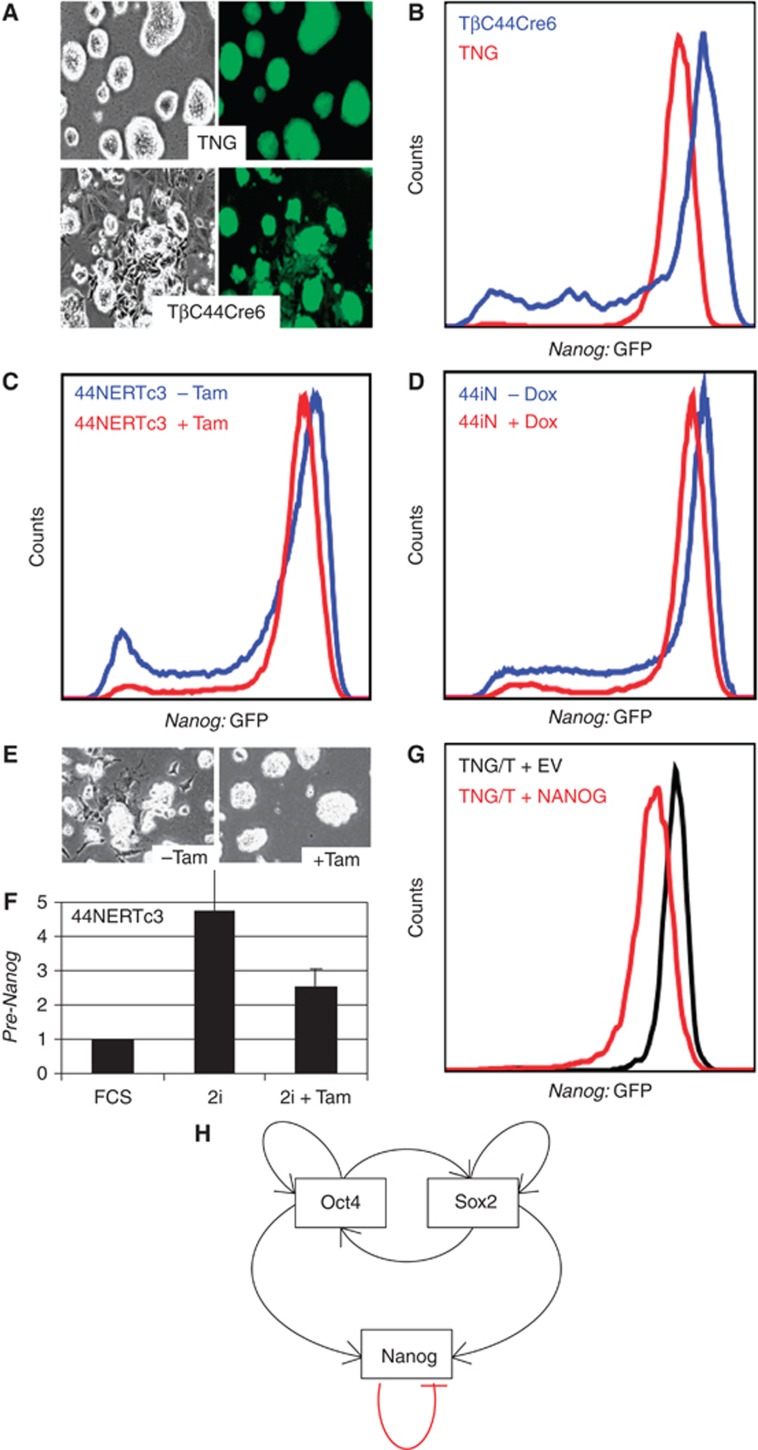
NANOG-mediated repression of Nanog is operational in ‘2i+LIF’. (A) Representative pictures of TNG and TβC44Cre6 cells cultured in serum-free ‘2i+LIF’ medium. Note the extensive differentiation observed in Nanog-null TβC44Cre6. (B) FACS analysis of TNG and TβC44Cre6 cells cultured in serum-free ‘2i+LIF’ medium. (C) FACS analysis of 44NERTc3 cells cultured in serum-free ‘2i+LIF’ medium in the presence or absence of Tamoxifen. (D) Identical analysis of 44iN cells cultured in the presence or absence of Doxycycline. (E) Representative pictures of 44NERTc3 cells cultured in ‘2i+LIF’ in the presence/absence of Tamoxifen. (F) Expression of Nanog locus derived pre-mRNA from 44NERTc3 cells grown in parallel in serum (FCS, set to 1), in ‘2i+LIF’ or in ‘2i+LIF’ supplemented with Tamoxifen for 24 h (n=2 for each condition, error bars represent s.e.m.). (G) FACS analysis of TNG/T cells cultured in ‘2i+LIF’ and supertransfected with either an empty vector (EV) or a NANOG-expressing vector (NANOG). (H) Model architecture of the core regulatory network of ES cells.
Contrary to our expectations, we found that Nanog-null/GFP cells (TβC44Cre6) exhibit considerable levels of differentiation when grown in ‘2i+LIF’, as observed by morphology and by the accumulation of cells expressing low Nanog:GFP (Figure 9A and B). This suggests that NANOG is required to allow MEK/GSK3 inhibition to fully exert its pro-self-renewal effect. Despite their higher propensity to differentiate, we found that undifferentiated TβC44Cre6 colonies produced significantly brighter Nanog:GFP fluorescence (Figure 9A), with FACS analysis showing that the peak of cells expressing maximal Nanog:GFP is located at higher fluorescence values for TβC44Cre6 compared with TNG cells (Figure 9B). Therefore, even in ‘2i+LIF’, undifferentiated Nanog-null cells transcribe the Nanog locus more efficiently than NANOG-expressing cells.
Next, we used 44NERTc3 and 44iN cells to assess the effects of restoring NANOG activity in ‘2i+LIF’ conditions. In both lines, FACS analyses showed that restoration of NANOG with either Tamoxifen (44NERTc3; Figure 9C) or Doxycycline (44iN; Figure 9D) induced a shift of the GFP peak to lower values of fluorescence. However, this did not lead to an increase in the percentage of cells lacking Nanog:GFP expression as observed in serum-containing medium (Figure 7). Rather, the proportion of 44NERTc3 and 44iN cells expressing intermediate and low levels of Nanog:GFP was decreased upon restoration of NANOG (Figure 9C and D), correlating with the loss of differentiating cells (Figure 9E).
Overall, these results suggest that Nanog autorepression persists in ‘2i+LIF’ and is therefore independent of the MEK/GSK3 signalling pathways. Yet, either MEK and/or GSK3 activities are required to allow NANOG to proceed to generate Nanog-silent cells. In agreement with this, analysis of pre-mRNA expression from the endogenous Nanog locus in 44NERTc3 cells cultured in ‘2i+LIF’ showed that Nanog transcription is downregulated by Tamoxifen treatment but only to a level that is higher than that seen in cells cultured in serum without Tamoxifen (Figure 9F).
The fact that Nanog-null cells exhibit an increased differentiation propensity in ‘2i+LIF’ was unexpected. This may indicate that Nanog-null cells do not respond appropriately to MEK/GSK3 inhibition, opening the possibility that in cells fully responding to signalling inhibition, Nanog repression by NANOG could be abolished. However, upon transfection of a NANOG expression vector, supertransfectable TNG cells (TNG/T) show a clear shift of Nanog:GFP expression to lower fluorescence values, without generating Nanog:GFP-negative cells (Figure 9G). Therefore, the ability of exogenous NANOG to downregulate Nanog in Nanog-null cells cultured ‘2i+LIF’ is not due to an inappropriate response of Nanog-null cells to signalling inhibition. We conclude that Nanog autorepression is independent of MEK/GSK3 signalling.
Discussion
The previous view of the core pluripotency network proposed that Nanog, Oct4 and Sox2 form a self-reinforcing circuit (Jaenisch and Young, 2008) and was inferred from genome-wide analyses (Loh et al, 2006; Ivanova et al, 2006; Chen et al, 2008; Marson et al, 2008; Kim et al, 2008). Although based on the reasonable assumption that binding of a transcription factor to a regulatory region of an active gene suggests that the transcription factor acts as an activator, experimental evidence supporting the inferred architecture had not been generated. In particular, how endogenous genes respond to the presence/absence of their regulators has yet to be analysed comprehensively. Although attempts have been made (Loh et al, 2006; Ivanova et al, 2006; Hall et al, 2009), the differentiation events arising upon the loss of several pluripotency genes precludes the drawing of clear conclusions regarding whether the observed genetic responses result from direct regulation or from pleiotropic effects. Here, we took advantage of the fact that undifferentiated and pluripotent Nanog-null ES cells can be expanded (Chambers et al, 2007), to use genetic approaches to unravel the architecture of the Nanog-centred network.
While this manuscript was under revision, an independent study used partial knockdown of Nanog mRNA and overexpression of NANOG in WT ES cells to propose that Nanog is subject to autorepression (Fidalgo et al, 2012). In contrast, we have used inducible systems of complete loss- and gain-of-function. In combination, both studies establish that the architecture of the core pluripotency network needs to be re-assessed by replacing Nanog autoactivation by autorepression (Figure 9H). Moreover, our study also argues against the generally accepted idea that NANOG activates Oct4 and Sox2: NANOG is not a critical regulator of Oct4/Sox2 expression (Figure 9H), an observation that is consistent with the fact that Nanog-null ES cells are viable whereas Oct4 and Sox2 expression need to be maintained within strict limits to prevent differentiation (Niwa et al, 2000; Masui et al, 2007). Conversely, our results confirm that NANOG transactivates Klf4 and Esrrb (Festuccia et al, 2012).
We further show that Nanog autorepression does not rely on the modulation of OCT4/SOX2 activity at the Nanog locus. Fidalgo et al (2012) proposed that Nanog autorepression occurs through interaction between NANOG and the transcriptional repressors ZFP281 and NURD. Interestingly, NANOG does not bind at the Nanog locus in the absence of ZFP281 (Fidalgo et al, 2011), suggesting that NANOG binding to Nanog may be indirect. However, we show here that a mutant NANOG protein unable to bind DNA cannot repress Nanog-driven transcription. We also show that the previously in vitro identified NANOG-binding site at Nanog (Wu et al, 2006) is not required to achieve NANOG-mediated repression of Nanog-driven transcription. Therefore, further studies will be required to understand in detail the molecular basis of Nanog autorepression.
At least two consequences of Nanog autorepression could be of biological significance. First, it is known that ectopically enforced NANOG expression captures ES cells in a self-renewal state (Chambers et al, 2003). Therefore, Nanog autorepression may be an important component that restrains NANOG from reaching a level which completely blocks exit from the undifferentiated state. Second, Nanog autorepression may influence the dynamic properties of Nanog regulation in undifferentiated ES cells. Accordingly, we show here that Nanog autorepression is an important regulatory arm of Nanog gene expression heterogeneity. The introduction of OCT4/SOX2-independent Nanog autorepression and the liberation of Oct4/Sox2 expression from NANOG-mediated control (Figure 9H) afford an unexpected vantage point to study NANOG heterogeneity within OCT4/SOX2-expressing cells.
In accord with other model systems (Balazsi et al, 2011), we report here that Nanog autorepression influences the dynamic transitions between Nanog transcription states. Indeed, the generation of Nanog-inactive cells is significantly impaired in Nanog-null cells. Conversely, restoring nuclear NANOG expression to Nanog-null cells is sufficient to rescue the ability of the network to explore the Nanog-inactive state efficiently, in a process reminiscent to the exit of competence of Bacillus subtilis (Suel et al, 2007). Remarkably, in the presence of exogenous NANOG, Nanog-inactive cells fail to re-enter the Nanog-active state. Thus, when the production of NANOG is freed from the autorepressed locus, transcriptional switching of Nanog is altered, suggesting that Nanog autorepression acts as an information processing system.
Interestingly, not all the cells constitutively expressing exogenous NANOG display silent Nanog genes and, conversely, not all cells lacking NANOG permanently transcribe Nanog, as shown by our RNA-FISH experiments. This suggests that other activities are likely to buffer the efficiency of Nanog autorepression in NANOG-overexpressing cells or to restrain full activation of Nanog in Nanog-null cells. Since genetic networks supporting excitable non-linear dynamics are generally structured in intertwined positive and negative feedback loops (Balazsi et al, 2011), it is possible that secondary effects of gain- or loss-of-function of NANOG counteract those derived from the direct repression of Nanog by NANOG. Oct4 and Sox2 expression are not under the tight control of NANOG. Therefore, it will be important to determine which pluripotency transcription factors establish such positive feedback modules in the Nanog-centred network. Indeed, secondary, NANOG-dependent feedback loops have recently been suggested to contribute to ES cell heterogeneity (Macarthur et al, 2012). The NANOG targets Esrrb and Klf4 (Festuccia et al, 2012) have been suggested to act as transcriptional activators of Nanog (van den Berg et al, 2008; Niwa et al, 2009). Esrrband Klf4 are therefore likely to establish positive feedback loops that may explain the fact that Nanog is neither homogenously silent in cells overexpressing NANOG from a transgene, nor homogeneously active in cells lacking NANOG.
As recently reported (Miyanari and Torres-Padilla, 2012), we also found Nanog to be largely monoallelically transcribed in ES cells. Although Nanog autorepression does not seem to have a critical influence on the proportion of mono- versus biallelically transcribing cells, this does not rule out the possibility that allelic switching contributes to NANOG heterogeneity (Miyanari and Torres-Padilla, 2012). Indeed, the variability in NANOG levels generated through allelic switching, together with the subsequent modulation of the probability for Nanog transcription, might be a source of perturbations with potentially important dynamic consequences.
Until now, NANOG heterogeneity had been shown to be exclusively modulated by extrinsic signalling pathways. Indeed, NANOG heterogeneity is abolished in serum-free conditions in which the MEK and GSK3 signalling pathways are inhibited (the so-called ‘2i+LIF’ conditions; Ying et al, 2008; Wray et al, 2011; Marks et al, 2012). Therefore, the fact that the experimental manipulation of NANOG activity leads to drastic alterations of Nanog transcription heterogeneity without any artificial manipulation of MEK/GSK3 signalling, places Nanog autorepression as a major regulatory arm of NANOG heterogeneity. Thus, at least one intrinsic activity, Nanog autorepression, contributes to the existence of reversible phenotypic states associated with distinct propensities for self-renewal or differentiation.
Interestingly in this context, the repression of Nanog by exogenous NANOG persists in ‘2i+LIF’, yet without giving rise to Nanog-negative cells. This suggests that, although the MEK/GSK3 signalling pathways are not required for Nanog autorepression to occur, they do promote the ability of Nanog autorepression to generate cells in which Nanog is not transcribed. A multitude of transcription factors, including KLF4 and ESRRB, are upregulated in ‘2i+LIF’ (Marks et al, 2012), suggesting that the global level of Nanog activators might be too high to allow Nanog autorepression to generate cells expressing no NANOG. Conversely, the transcriptional repressor TCF3 is not functional in ‘2i+LIF’ (Wray et al, 2011), releasing the repression it normally exerts on Nanog and on several other components of the pluripotency network. In this regard, the MEK/GSK3 signalling pathways should not be viewed as specific drivers of Nanog heterogeneity, but rather as the inducers of a regulatory landscape in which the consequences of Nanog autorepression can be fully unfolded to give rise to heterogeneous and fluctuating Nanog transcription.
Overall, this study suggests that non-genetic heterogeneity of Nanog transcription is an emergent property of the subnetwork architecture proposed here (Figure 9H), which nevertheless depends on the signalling-dependent modulation of the activity of the global pluripotency network. Identifying the transcription factors and upstream signalling molecules that enable Nanog autorepression to promote NANOG heterogeneity should provide novel insights into how intrinsic and extrinsic regulations cooperate to control pluripotency.
Materials and methods
Cell culture
Cells were cultured as previously described (Festuccia et al, 2012). Tamoxifen (Sigma) and Cycloheximide (Sigma) were used at 1 μM and 30 μg/ml, respectively. Doxycycline (Sigma) was used at 1 μg/ml except when indicated. For the analysis of Nanog:GFP heterogeneity, cells were cultured in the presence of the appropriate selection for Nanog transcription (Puromycin for TNG ES cells, G418 for TβC44Cre6 and 44NERT ES cells) and then plated at similar density (0.1 × 10⁵ cells per well of a six-well plate) and cultured for 5 days in the absence of selection. After FACS-sorting, 0.1 × 10⁵ cells were plated per well of a six-well plate and cultured in the absence of selection.
Random reverse transcription
RNA was extracted with TRIZOL (Invitrogen), DNase treated (Qiagen) and reverse transcribed with SuperScriptIII (Invitrogen).
Chromatin immunoprecipitation
Chromatin was extracted, sonicated and immunoprecipitated as previously described (Navarro et al, 2011).
Quantitative PCR
(Q)PCR reactions were performed in 384-well plates with a 480 LightCycler (Roche) using LightCycler 480 SYBR Green I Master (Roche). All primers were designed after repeat masking; sequences are available as Supplementary Information.
RNA-FISH
The Nanog intron 1 probe was generated by PCR (TAKARA Ex Taq) using available vectors carrying the Nanog locus genomic DNA (Chambers et al, 2007). Probe labelling was performed with the Vysis Nick Translation kit, using Spectrum Red or Green dUTP and following the manufacturer instructions. Cells were cytospun, permeabilised, fixed and hybridised as described (Navarro et al, 2008). Visualisation was performed with a Nikon TE-2000 microscope and a CoolSnapHQ High Speed Monochrome CCD or an Evolve 512 EMCCD camera (Photometrics). Image stacks (0.3 μm steps) were acquired with Metamorph software and deconvolved with AutoQuant.
FACS analysis
Cells were stained with anti-SSEA-1 monoclonal antibody (Clone MC-480, Developmental Studies Hybridoma Bank, The University of Iowa) using Alexa fluor-647 conjugated goat anti-mouse IgM antibodies (Invitrogen, Molecular Probes). Nanog:GFP and SSEA-1 expression was quantified using a FACSCalibur or an LSR II flow-cytometer system (Becton, Dickinson). The data was analysed using the FlowJo software suite (Tree Star).
Supplementary Material
Acknowledgments
We are grateful to Olivia Rodriguez for technical assistance with FACS sorting, to Carsten Marr and Peter Swain for discussions; to Val Wilson, Claus Nerlov, Philippe Clerc and Phil Avner for critical reading of the manuscript. PN was supported by a Newton International Fellowship and by a Marie Curie Intra-European Fellowship. Research in I.C.'s laboratory was supported by the Medical Research Council of the UK, The Wellcome Trust and by the EU Framework 7 project ‘EuroSyStem’ and by a Conacyt studentship (RO).
Author contributions: PN and IC conceived the study and wrote the manuscript. PN also performed and analysed the experiments with inputs from NF. NF generated the NANOG-ERT2 expression vector and characterised and analysed Nanog:GFP expression. AG performed the immunoblots. VKN, RO and DC provided technical assistance. NM generated the NANOG:N51A expression vector and WZ the luciferase reporter constructs. DK provided microscopy support. MR generated preliminary evidence for Nanog autorepression.
Footnotes
The authors declare that they have no conflict of interest.
References
- Balazsi G, van Oudenaarden A, Collins JJ (2011) Cellular decision making and biological noise: from microbes to mammals. Cell 144: 910–925 [DOI] [PMC free article] [PubMed] [Google Scholar]
- Chambers I, Colby D, Robertson M, Nichols J, Lee S, Tweedie S, Smith A (2003) Functional expression cloning of Nanog, a pluripotency sustaining factor in embryonic stem cells. Cell 113: 643–655 [DOI] [PubMed] [Google Scholar]
- Chambers I, Silva J, Colby D, Nichols J, Nijmeijer B, Robertson M, Vrana J, Jones K, Grotewold L, Smith A (2007) Nanog safeguards pluripotency and mediates germline development. Nature 450: 1230–1234 [DOI] [PubMed] [Google Scholar]
- Chazaud C, Yamanaka Y, Pawson T, Rossant J (2006) Early lineage segregation between epiblast and primitive endoderm in mouse blastocysts through the Grb2-MAPK pathway. Dev Cell 10: 615–624 [DOI] [PubMed] [Google Scholar]
- Chen X, Xu H, Yuan P, Fang F, Huss M, Vega VB, Wong E, Orlov YL, Zhang W, Jiang J, Loh YH, Yeo HC, Yeo ZX, Narang V, Govindarajan KR, Leong B, Shahab A, Ruan Y, Bourque G, Sung WK et al. (2008) Integration of external signaling pathways with the core transcriptional network in embryonic stem cells. Cell 133: 1106–1117 [DOI] [PubMed] [Google Scholar]
- Dietrich JE, Hiiragi T (2007) Stochastic patterning in the mouse pre-implantation embryo. Development 134: 4219–4231 [DOI] [PubMed] [Google Scholar]
- Festuccia N, Osorno R, Halbritter F, Karwacki-Neisius V, Navarro P, Colby D, Wong F, Yates A, Tomlinson SR, Chambers I (2012) Esrrb is a direct Nanog target gene that can substitute for Nanog function in pluripotent cells. Cell Stem Cell 11: 477–490 [DOI] [PMC free article] [PubMed] [Google Scholar]
- Fidalgo M, Faiola F, Pereira CF, Ding J, Saunders A, Gingold J, Schaniel C, Lemischka IR, Silva JC, Wang J (2012) Zfp281 mediates Nanog autorepression through recruitment of the NuRD complex and inhibits somatic cell reprogramming. Proc Natl Acad Sci USA 109: 16202–16207 [DOI] [PMC free article] [PubMed] [Google Scholar]
- Fidalgo M, Shekar PC, Ang YS, Fujiwara Y, Orkin SH, Wang J (2011) Zfp281 functions as a transcriptional repressor for pluripotency of mouse embryonic stem cells. Stem Cells 29: 1705–1716 [DOI] [PMC free article] [PubMed] [Google Scholar]
- Graf T, Stadtfeld M (2008) Heterogeneity of embryonic and adult stem cells. Cell Stem Cell 3: 480–483 [DOI] [PubMed] [Google Scholar]
- Hall J, Guo G, Wray J, Eyres I, Nichols J, Grotewold L, Morfopoulou S, Humphreys P, Mansfield W, Walker R, Tomlinson S, Smith A (2009) Oct4 and LIF/Stat3 additively induce Kruppel factors to sustain embryonic stem cell self-renewal. Cell Stem Cell 5: 597–609 [DOI] [PubMed] [Google Scholar]
- Huang S (2009) Non-genetic heterogeneity of cells in development: more than just noise. Development 136: 3853–3862 [DOI] [PMC free article] [PubMed] [Google Scholar]
- Ivanova N, Dobrin R, Lu R, Kotenko I, Levorse J, DeCoste C, Schafer X, Lun Y, Lemischka IR (2006) Dissecting self-renewal in stem cells with RNA interference. Nature 442: 533–538 [DOI] [PubMed] [Google Scholar]
- Jaenisch R, Young R (2008) Stem cells, the molecular circuitry of pluripotency and nuclear reprogramming. Cell 132: 567–582 [DOI] [PMC free article] [PubMed] [Google Scholar]
- Kalmar T, Lim C, Hayward P, Munoz-Descalzo S, Nichols J, Garcia-Ojalvo J, Martinez Arias A (2009) Regulated fluctuations in nanog expression mediate cell fate decisions in embryonic stem cells. PLoS Biol 7: e1000149. [DOI] [PMC free article] [PubMed] [Google Scholar]
- Kim J, Chu J, Shen X, Wang J, Orkin SH (2008) An extended transcriptional network for pluripotency of embryonic stem cells. Cell 132: 1049–1061 [DOI] [PMC free article] [PubMed] [Google Scholar]
- Kuroda T, Tada M, Kubota H, Kimura H, Hatano SY, Suemori H, Nakatsuji N, Tada T (2005) Octamer and Sox elements are required for transcriptional cis regulation of Nanog gene expression. Mol Cell Biol 25: 2475–2485 [DOI] [PMC free article] [PubMed] [Google Scholar]
- Loh YH, Wu Q, Chew JL, Vega VB, Zhang W, Chen X, Bourque G, George J, Leong B, Liu J, Wong KY, Sung KW, Lee CW, Zhao XD, Chiu KP, Lipovich L, Kuznetsov VA, Robson P, Stanton LW, Wei CL et al. (2006) The Oct4 and Nanog transcription network regulates pluripotency in mouse embryonic stem cells. Nat Genet 38: 431–440 [DOI] [PubMed] [Google Scholar]
- Macarthur BD, Sevilla A, Lenz M, Müller FJ, Schuldt BM, Schuppert AA, Ridden SJ, Stumpf PS, Fidalgo M, Ma’ayan A, Wang J, Lemischka IR (2012) Nanog-dependent feedback loops regulate murine embryonic stem cell heterogeneity. Nat Cell Biol 14: 1139–1147 [DOI] [PMC free article] [PubMed] [Google Scholar]
- Marson A, Levine SS, Cole MF, Frampton GM, Brambrink T, Johnstone S, Guenther MG, Johnston WK, Wernig M, Newman J, Calabrese JM, Dennis LM, Volkert TL, Gupta S, Love J, Hannett N, Sharp PA, Bartel DP, Jaenisch R, Young RA (2008) Connecting microRNA genes to the core transcriptional regulatory circuitry of embryonic stem cells. Cell 134: 521–533 [DOI] [PMC free article] [PubMed] [Google Scholar]
- Marks H, Kalkan T, Menafra R, Denissov S, Jones K, Hofemeister H, Nichols J, Kranz A, Stewart AF, Smith A, Stunnenberg HG (2012) The transcriptional and epigenomic foundations of ground state pluripotency. Cell 149: 590–604 [DOI] [PMC free article] [PubMed] [Google Scholar]
- Martinez Arias A, Brickman JM (2009) Gene expression heterogeneities in embryonic stem cell populations: origin and function. Curr Opin Cell Biol 23: 650–656 [DOI] [PubMed] [Google Scholar]
- Masui S, Nakatake Y, Toyooka Y, Shimosato D, Yagi R, Takahashi K, Okochi H, Okuda A, Matoba R, Sharov AA, Ko MS, Niwa H (2007) Pluripotency governed by Sox2 via regulation of Oct3/4 expression in mouse embryonic stem cells. Nat Cell Biol 9: 625–635 [DOI] [PubMed] [Google Scholar]
- Mitsui K, Tokuzawa Y, Itoh H, Segawa K, Murakami M, Takahashi K, Maruyama M, Maeda M, Yamanaka S (2003) The homeoprotein Nanog is required for maintenance of pluripotency in mouse epiblast and ES cells. Cell 113: 631–642 [DOI] [PubMed] [Google Scholar]
- Miyanari Y, Torres-Padilla ME (2012) Control of ground-state pluripotency by allelic regulation of Nanog. Nature 483: 470–473 [DOI] [PubMed] [Google Scholar]
- Navarro P, Chambers I, Karwacki-Neisius V, Chureau C, Morey C, Rougelle C, Avner P (2008) Molecular coupling of Xist regulation and pluripotency. Science 321: 1693–1695 [DOI] [PubMed] [Google Scholar]
- Navarro P, Moffat M, Mullin N, Chambers I (2011) The X-inactivation trans-activator Rnf12 is negatively regulated by pluripotency factors in embryonic stem cells. Human Genetics 130: 255–264 [DOI] [PMC free article] [PubMed] [Google Scholar]
- Nichols J, Silva J, Roode M, Smith A (2009) Suppression of Erk signalling promotes ground state pluripotency in the mouse embryo. Development 136: 3215–3222 [DOI] [PMC free article] [PubMed] [Google Scholar]
- Nichols J, Smith A (2011) The origin and identity of embryonic stem cells. Development 138: 3–8 [DOI] [PubMed] [Google Scholar]
- Niwa H, Miyazaki J, Smith AG (2000) Quantitative expression of Oct-3/4 defines differentiation, dedifferentiation or self-renewal of ES cells. Nat Genet 24: 372–376 [DOI] [PubMed] [Google Scholar]
- Niwa H, Ogawa K, Shimosato D, Adachi K (2009) A parallel circuit of LIF signalling pathways maintains pluripotency of mouse ES cells. Nature 460: 118–122 [DOI] [PubMed] [Google Scholar]
- Plusa B, Piliszek A, Frankenberg S, Artus J, Hadjantonakis AK (2008) Distinct sequential cell behaviours direct primitive endoderm formation in the mouse blastocyst. Development 135: 3081–3091 [DOI] [PMC free article] [PubMed] [Google Scholar]
- Pomerantz JL, Sharp PA (1994) Homeodomain determinants of major groove recognition. Biochemistry 33: 10851–10858 [DOI] [PubMed] [Google Scholar]
- Rahl PB, Lin CY, Seila AC, Flynn RA, McCuine S, Burge CB, Sharp PA, Young RA (2010) c-Myc regulates transcriptional pause release. Cell 141: 432–445 [DOI] [PMC free article] [PubMed] [Google Scholar]
- Rodda DJ, Chew JL, Lim LH, Loh YH, Wang B, Ng HH, Robson P (2005) Transcriptional regulation of nanog by OCT4 and SOX2. J Biol Chem 280: 24731–24737 [DOI] [PubMed] [Google Scholar]
- Silva J, Smith A (2008) Capturing pluripotency. Cell 132: 532–536 [DOI] [PMC free article] [PubMed] [Google Scholar]
- Singh AM, Hamazaki T, Hankowski KE, Terada N (2007) A heterogeneous expression pattern for Nanog in embryonic stem cells. Stem Cells 25: 2534–2542 [DOI] [PubMed] [Google Scholar]
- Suel GM, Kulkarni RP, Dworkin J, Garcia-Ojalvo J, Elowitz MB (2007) Tunability and noise dependence in differentiation dynamics. Science 315: 1716–1719 [DOI] [PubMed] [Google Scholar]
- van den Berg DL, Zhang W, Yate,s A, Engelen E, Takacs K, Bezstarosti K, Demmers J, Chambers I, Poot RA (2008) Estrogen-related receptor beta interacts with Oct4 to positively regulate Nanog gene expression. Mol Cell Biol 28: 5986–5995 [DOI] [PMC free article] [PubMed] [Google Scholar]
- Ying QL, Wray J, Nichols J, Batlle-Morera L, Doble B, Woodgett J, Cohen P, Smith A (2008) The ground state of embryonic stem cell self-renewal. Nature 453: 519–523 [DOI] [PMC free article] [PubMed] [Google Scholar]
- Wray J, Kalkan T, Smith A (2010) The ground state of pluripotency. Biochem Soc Trans 38: 1027–1032 [DOI] [PubMed] [Google Scholar]
- Wray J, Kalkan T, Gomez-Lopez S, Eckardt D, Cook A, Kemler R, Smith A (2011) Inhibition of glycogen synthase kinase-3 alleviates Tcf3 repression of the pluripotency network and increases embryonic stem cell resistance to differentiation. Nat Cell Biol 13: 838–845 [DOI] [PMC free article] [PubMed] [Google Scholar]
- Wu Q, Chen X, Zhang J, Loh YH, Low TY, Zhang W, Zhang W, Sze SK, Lim B, Ng HH (2006) Sall4 interacts with Nanog and co-occupies Nanog genomic sites in embryonic stem cells. J Biol Chem 281: 24090–24094 [DOI] [PubMed] [Google Scholar]
Associated Data
This section collects any data citations, data availability statements, or supplementary materials included in this article.