

Abstract
To explore the feasibility of pyrosequencing for quantitative differential gene expression analysis we have performed a comparative study of the results of the sequencing experiments to those obtained by a conventional DNA microarray platform. A conclusion from our analysis is that, over a threshold of 35 normalized reads per gene, the measurements of gene expression display a good correlation with the references. The observed concordance between pyrosequencing and DNA microarray platforms beyond the threshold was of 0.8, measured as a Pearson's correlation coefficient. In differential gene expression the initial aim is the quantification the differences among transcripts when comparing experimental conditions. Thus, even in a scenario of low coverage the concordance in the measurements is quite acceptable. On the other hand, the comparatively longer read size obtained by pyrosequencing allows detecting unconventional splicing forms.
Introduction
RNA sequencing (RNA-seq) is becoming one of the most popular applications of next generation sequencing technologies (Cloonan et al., 2008; Marioni et al., 2008; Mortazavi et al., 2008; Wang et al., 2009). Despite the fact that RNA-seq is a relatively new methodology, it has already been applied to the study of the transcriptional complexities of different organisms, including yeast (Nagalakshmi et al., 2008), mice (Mortazavi et al., 2008), Arabidopsis (Eveland et al., 2008), and humans (Sultan et al., 2008). In addition, to provide a quantitative estimation of the mRNA levels, RNA-seq also offers extra information on novel splice junctions, novel transcripts, alternate transcription start sites, rare transcripts, etc., constituting a first-order tool for analysis and discovery in transcriptomics.
Recent articles have compared short-read technologies to microarray references, finding a good correspondence when a high number of reads is available (Bloom et al., 2009; t'Hoen et al., 2008). Here we extend, for the first time, this comparison to long reads to check to what extent the results of differential gene expression comparisons obtained by pyrosequencing are consistent with those ones obtained with gene expression microarrays. To this end, we have chosen a well-established perturbation model, the exposure of yeast cells to an abrupt increase in external pH. Previous DNA microarray-based analyses of the effect of this perturbation on gene expression remodeling have shown that it results in several hundred of genes being induced or repressed (Lamb and Mitchell, 2003; Lamb et al., 2001; Platara et al., 2006; Ruiz et al., 2008; Serrano et al., 2002, 2006; Viladevall et al., 2004), as a result of the modulation of diverse signaling pathways (for a recent review, see Arino, 2010). In this work we present a comparison of the transcriptional changes detected after short-term (10 min) exposure to high pH stress (pH=8.0) for both wild-type and snf1 mutant strains. snf1 encodes a Ser/Thr protein kinase, homolog to the mammalian AMP-activated protein kinase, which is required for regulating transcription of glucose-repressed genes in yeast and becomes activated in response to diverse stress situations (Hedbacker and Carlson, 2008). The biological implications of Snf1 in high pH response will be described elsewhere (Casamayor, Ruiz, Serrano, Platara, Ferrer-Dalmau, Barreto and Ariño, manuscript in preparation). Our results show that there is a more than reasonable agreement between both technologies if a threshold for the number of reads for gene is used. In addition, despite the low coverage, still uncommon splicing events can be found.
Material and Methods
RNA preparation
Cultures (50 mL) of wild-type (BY4741) and the snf1::kanMX derivative were grown on YPD until OD660nm≈0.6–0.8 and split into two aliquots. One set of aliquots received 16 mM KCl (nonstressed cells) or 16 mM KOH (stressed cells, pH=8.0 approx.). After 10 min cells were collected by rapid filtration through 0.45 μm Metricel membrane filters (Pall Corporation, Port Washington, NY) and dried cells kept at –80°C. Total RNA was extracted by using the RiboPure™-Yeast kit (Ambion, ref. AM1926), with two steps of elution from the column (50 μL each). Samples were treated with DNAse to eliminate genomic DNA traces. RNA quality was assessed by denaturing 0.8% agarose gel electrophoresis, and RNA quantification was performed by measuring A260 in a BioPhotometer (Eppendorf, Westbury, NY).
DNA microarray hybridizations
Eight micrograms of total RNA were employed for cDNA synthesis and labeling, using the indirect labeling kit (CyScribe Post-Labeling kit, GE-Amersham Biosciences, Piscataway, NJ), in conjunction with Cy3-dUTP and Cy5-dUTP fluorescent nucleotides. The cDNA obtained was dried and resuspended in the hybridization buffer. DNA amount and labeling was evaluated with a Nanodrop spectrophotometer (Nanodrop Technologies, Inc., Wilmington, DE). Fluorescently labeled cDNAs were combined and hybridized to yeast genomic microchips constructed in our laboratory by arraying 6014 different PCR-amplified open reading frames from Saccharomyces cerevisiae (Alberola et al., 2004; Viladevall et al., 2004).
Prehybridization, hybridization, and washing conditions were essentially as described previously (Hegde et al., 2000).
Microarray data analysis
Slides were scanned with a ScanArray 4000 apparatus (Packard BioChips Technologies, New York, NY) and the output analyzed using GenePix Pro 6.0 software. For each experiment two independent biological replicates were performed, each by duplicate (dyes were swapped to avoid dye-specific bias) and data were combined (four microarrays/experiment). All the microarray data in a MIAME-compliant format have been deposited in GEO database and will be available under series record GSE25697.
Raw data were normalized using the Limma method (Smyth, 2005) with dye swap, as implemented in the Babelomics package (Medina et al., 2010). Fold changes were calculated using Babelomics as well.
Preparation of cDNA for sequencing
For first-strand cDNA synthesis the RevertAid™ H Minus First Strand cDNA Synthesis Kit (Fermentas, Hanover, MD) was used. Two independent reactions were carried out (20 μg of total RNA each) for each experimental condition. Priming was achieved by using the degenerate oligonucleotide 5′-GAGCTAGTTCTGGAG(T)16VN-3′ (V stands for any nucleotide but T and N for any nucleotide), which contains a GsuI recognition site. Extension was achieved by incubation with RevertAid™ H Minus M-MuLV Reverse Transcriptase in the presence of dATP, dTTP, dGTP, and 5-methyl-dCTP (0.25 mM each, final concentration) at 42°C for 60 min. Finally, the RNA/DNA hybrid was precipitated with ammonium acetate and ethanol by incubation at −80°C for 5 min and centrifugation for 20 min at 4°C at maximum speed in a microfuge. Pellets were rinsed with cold 70% ethanol, dried briefly and resuspended in 40 μL of nuclease-free water.
Second-strand cDNA synthesis was accomplished using the Second Strand cDNA Synthesis (Fermentas) following the manufacturer's directions, except that the starting first strand material was 40 μL and all amounts were doubled accordingly. The synthesis reaction was terminated by addition of 10 μL of 0.5 M EDTA, pH 8.0. The volume was adjusted to 200 μL with deionized water and the nucleic acid precipitated by addition of 20 μL of 3M sodium acetate, pH 5.2 solution, 1.5 μL glycogen (20 g/L, Roche, Indianapolis, IN) and 600 μL absolute ethanol. The mixture was keep for 30 min at −80°C, then centrifuged for 30 min at maximum speed at 4°C in a microfuge. Double-strand cDNA pellets were washed with 70% ethanol and resuspended in 45 μL water. At this step both independent reactions were combined and stored at −20°C until processed. Removal of the polyA tail was carried out by incubating 75 μL of each cDNA sample with 8.6 μL of 10× Tango buffer (Fermentas) and 2.5 μL of GsuI (5 U/μL) for 5 h at 30°C. At the end of the digestion GsuI was inactivated by incubation for 20 min at 65°C. Samples were stored at −80°C until use. This procedure yielded cDNA samples with a concentration ranging from 0.87 to 1.31 mg/mL.
Pyrosequencing
Gene expression was analyzed using 454 pyrosequencing data generated by sequencing of cDNA synthesized from four total RNA samples from two different S. cerevisiae strains at the Universitat Autònoma de Barcelona. Raw data (.sff files) from the GS FLX sequencer were provided by Lifesequencing S.L. (Valencia, Spain). This represent half sequencing run of cDNA from each sample, summing up a total of 502,959 reads. Approximately 5 μg of the cDNA-preparation in the size range 250–600 bp were used to generate a sstDNA shotgun library according to the protocol supplied by the manufacturer. Briefly, purified cDNA fragments were nebulized and concentrated with AMPure PCR purification beads to remove fragments below 200 bp. These fragments were hybridized to DNA capture beads and each cDNA fragment was individually amplified by emulsion-based clonal amplification polymerase chain reaction (PCR) (emPCR). The DNA capture beads containing amplified DNA were then deposited in individual wells of a PicoTiter plate. After titration, the optimums DNA copies per bead were used for the main sequencing run. After emulsion PCR and subsequent bead recovery, DNA beads were loaded onto one PicoTiterPlate and were subjected to sequencing.
Sequence data analysis
Four experiments were incorporated in the same run by means of multiplexing using different tag sequences. A custom Perl script was made to deconvolute the multiplexing and to sort the sequences into the four different experiments that were carried out. The script looks for the tag sequence on the 5′ end of the sequences, prune it, and assign the sequence to the corresponding experiment.
All the remaining reads were mapped to the yeast genome using the BWA-SW program (Li and Durbin, 2010). Reads mapping in more than one genomic location were discarded. The genomic coordinates for the genes were taken from the Ensembl (Flicek et al., 2008). Gene coordinates were further corrected with more recent estimations based on experimental results (Nagalakshmi et al., 2008)
Table 1 shows the original number of reads and the reads at each step of filtering and mapping. Both technical replicates were joined for the subsequent step of quantification.
Table 1.
Number of Reads, Filtering, and Mapping of the Two Replicates
| |
Replicate 1 |
Replicate 2 |
||||||
|---|---|---|---|---|---|---|---|---|
| WT | WT_pH | snf1 | Snf1_pH | WT | WT_pH | snf1 | snfi_pH | |
| Total reads | 25,609 | 43,559 | 37,296 | 43,308 | 28,322 | 47,040 | 40,230 | 47,327 |
| Filtered duplicated reads | 4,350 | 7,106 | 6,065 | 6,774 | 3,003 | 5,146 | 4,035 | 4,442 |
| Non-redundant reads | 21,259 | 36,453 | 31,231 | 36,534 | 25,319 | 41,894 | 36,195 | 42,885 |
| Reads with good quality | 20,964 | 35,740 | 30,709 | 35,971 | 24,326 | 40,235 | 34,683 | 41,412 |
| Number of reads with unique mapping on Ensembl transcripts | 7,768 | 12,450 | 11,911 | 13,980 | 9,119 | 13,961 | 14,152 | 16,188 |
| Number of reads with unique mapping on transcripts as in (Nagalakshmi et al., 2008) | 17,525 | 29,152 | 25,693 | 29,004 | 20,391 | 32,505 | 29,111 | 33,592 |
| Number of reads with no transcript mapping | 1,503 | 2,397 | 2,398 | 3,034 | 1,683 | 2,987 | 2,478 | 3,489 |
| Number of reads with multiple mapping on transcripts | 860 | 1,476 | 1,146 | 1,524 | 942 | 1,597 | 1,354 | 1,580 |
| Number of transcripts with reads | 3,564 | 4,172 | 4,384 | 4,770 | 3,862 | 4,344 | 4,552 | 4,955 |
| Number of undetected transcritps | 3,560 | 2,952 | 2,740 | 2,354 | 3,262 | 2,780 | 2,572 | 2,169 |
The quantification of the relative expression of the mRNAs corresponding to the genes is measured as the number of reads mapping onto it. This value must also be corrected by the gene length. Thus, absolute number of reads mapped are normalized as reads per kilobase per million of bases (RPKM) (Mortazavi et al., 2008).
For each of the four matrices of counts we have applied the RPKM normalization (Mortazavi et al., 2008) and later we have calculated the fold changes (log2-ratios) of WT_pH vs WT and snf1_pH vs snf1. In this way sequencing results are comparable to log2-ratios obtained from the microarray platform.
Microarray to sequence comparison
The fold change values obtained from the microarrays were compared to the corresponding fold changes obtained from the corresponding sequencing experiments using a simple Pearson's coefficient of correlation.
Results and Discussion
Data generation and preprocessing
Four S. cerevisiae cultures were analyzed: (1) a control, wild-type strain (WT), (2) the control strain under alkaline stress (a shift to pH 8.0 for 10 min; WT_pH), (3) a mutant snf1 strain (snf1), and (4) the snf1 strain under alkaline stress (snf1_pH). The RNA was extracted and the corresponding cDNA prepared as described in methods. The cDNA corresponding to the four conditions studied was subjected to competitive hybridization in two-color microarrays representing the comparisons WT versus WT_pH and snf1 versus snf1_pH (see Methods section). On the other hand, two replicates of the four experimental conditions were sequenced as described in the Methods section. A number of total reads (merging both replicates) between 40,000 and 80,000 were obtained for each experimental condition analyzed. Table 1 shows details on the number of reads obtained and the remaining number of reads after the filtering and mapping steps.
Both, microarray and RNA-seq data were normalized as described in methods. Two comparisons (WT vs. WT_pH and snf1 vs. snf1_pH) were carried out and analyzed with the two technologies. Log ratios of the fold change values were obtained in the two comparisons. Figure 1 shows the boxplots of the comparisons. It is apparent that the distribution of values is different when microarrays are compared to RNA-seq results. Although microarrays produced almost symmetrical boxplots, RNA-seq results seem to be slightly biased toward low values of log-ratios. Table 1 shows the process of filtering and mapping the reads onto the transcripts. The number of mapped reads when the transcript definitions provided by Ensembl (Flicek et al., 2008) are used is significantly lower than that obtained when more accurate definitions, based on experimental values (Nagalakshmi et al., 2008), are used. Such more accurate definitions include the 5′ and 3′ UTR, missing in many genes, which increases the regions for mapping in the transcripts. This explains the corresponding increase in the number of reads mapping in the transcripts.
FIG. 1.
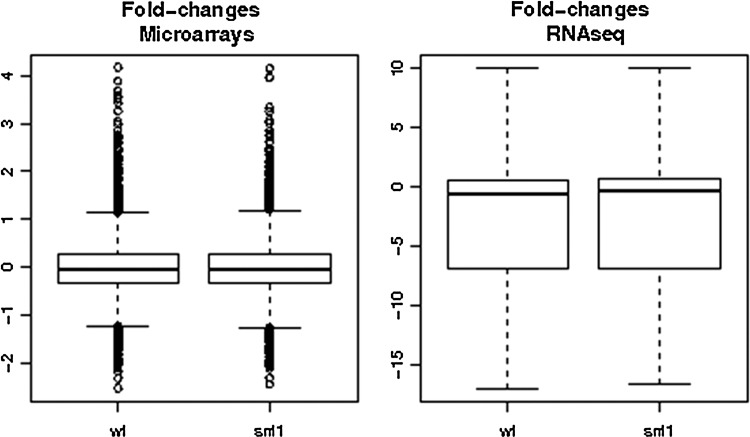
Boxplots of the comparisons. Comparisons of transcriptional changes detected by DNA microarray and pyrosequencing experiments. The changes in expression detected after exposure of wild-type (WT) and snf1 cells (snf1) to alkaline pH are shown for each type of experiment as boxplots.
With small variations among the experiments, over an 80% of the total genes of the S. cerevisiae genome is detected as apparently actively transcribing by, at least, one read. This value is very similar to the number of genes detected as transcriptionally active by DNA microarray analysis (80.2 and 73.9% for wild-type and snf1 cells, respectively. Figure 2 shows the distribution of reads per gene in the gene spectrum of S. cerevisiae obtained in the sequencing experiments. Due to the low coverage a substantial number of the genes are represented by only a few reads.
FIG. 2.
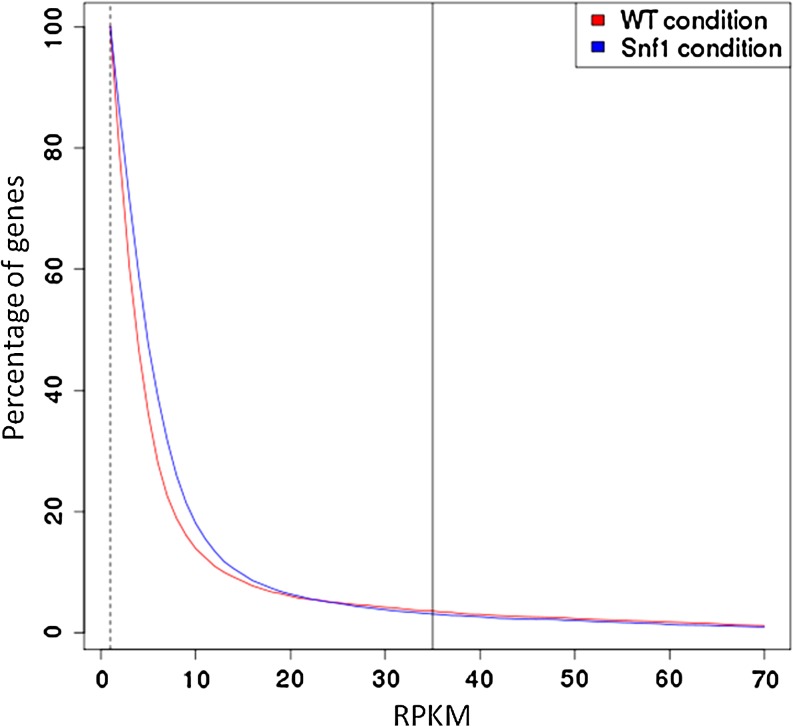
Percentage of genes that show a normalized number of reads per transcript (RPKM value) represented in the x-axis. The vertical line corresponds to the threshold of RPKM value where the correlation between the microarray experiment and the sequencing experiment is high (see text). In this particular case, the number of genes corresponding to the percentage at the RPKM value is of around 200 (actually 208 genes for the WT cells and 189 genes for the snf1 cells).
DNA microarray and pyrosequencing data correlations
Beyond the simple detection, when the aim is the quantification of the relative expression of the mRNAs corresponding to the genes, a minimum number of reads is required for each gene, which must also be corrected by the gene length (Mortazavi et al., 2008).
The correlations between microarrays and RNA-seq data were studied. The most extreme thresholds of coverage were used given that this factor is known to have a strong effect on the reliability of the measurements. Figure 3 shows how correlation, computed as the Pearson correlation coefficient, changes as a function of the threshold of normalized counts (in RPKM) for including a gene in the comparison. The higher the coverage of the genes considered, the better the correlation until a plateau is reached. Figure 3 documents how the trends obtained in the two genetic backgrounds studied (WT and snf1) are quite similar and that the coefficient of correlation stabilizes approximately at a value of 0.8 over 35 RPKM per transcript. Higher coverage did not resulted in more correlated measurements, suggesting that the limit of concordance between both technologies is around this value.
FIG. 3.
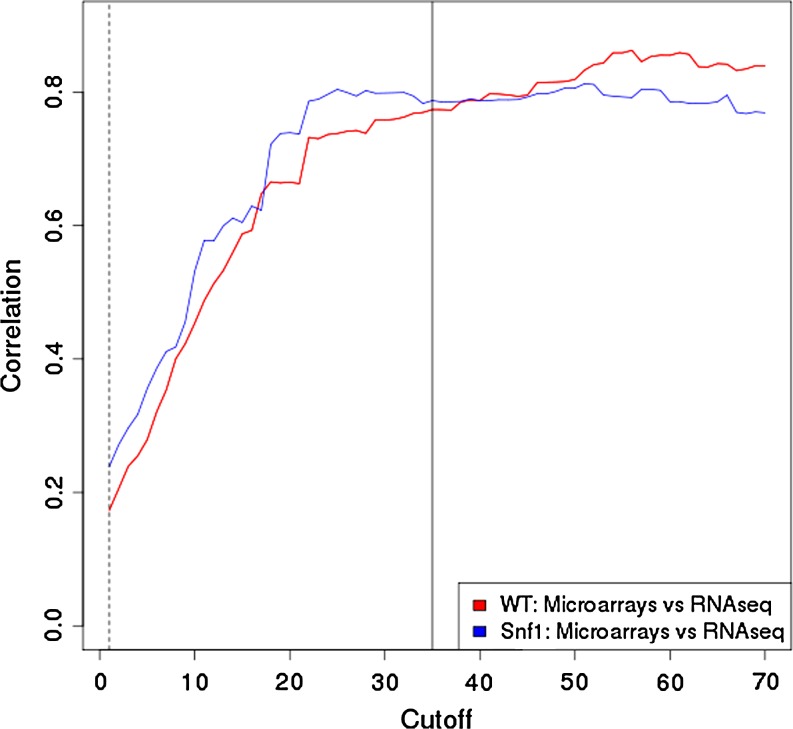
Pearson's correlation coefficient computed between the microarray and the pyrosequencing comparisons as a function of the threshold in normalized number of reads per transcript (RPKM). Red line corresponds to the WT comparison and blue line to the Snf1 comparison.
Obviously, the more stringent is the threshold the fewer genes can be used in the comparisons. Figure 2 shows the number of genes remaining after the threshold. Some recent reports suggest that, in mammalian genomes, several million reads would be required to obtain accurate quantification of >95% of expressed transcripts (Blencowe et al., 2009), but as yet there has not been a detailed analysis on how sequencing coverage affects differential expression calls yet (Oshlack et al., 2010). Knowledge on the relationship between sequencing depth, feature detection, and differential expression is needed for experimental design purposes and for understanding the characteristics of the analysis results.
Comparisons of differentially expressed genes
In the optimal threshold of 35 RPKM the trends observed for the microarrays and the RNA-seq were quite similar. The concordance in the number of genes differentially expressed when both platforms are compared is reasonably high, reaching 60% among the 20 most differentially expressed genes (see Table 2). This is a high concordance value, even for comparisons between platforms based on the same technology (Ioannidis et al., 2009; Shi et al., 2006).
Table 2.
Intersections Between the 20, 50, and 100 Genes More Differentially Expressed by RNA-seq and Microarray
| 20 | 50 | 100 | |
|---|---|---|---|
| WT microarray/ WT RNAseq | 12/20 (60%) | 16/50 (32%) | 48/100 (48%) |
| snf1 microarray/ snf1 RNAseq | 12/20 (60%) | 22/50 (44%) | 67/100 (67%) |
Figure 4 shows all the possible pairwise comparisons at the optimal threshold. RNA-seq produces more extreme values in the most differentially expressed genes given that the scales of measurement in the hybridization and in the sequencing counts are different. However, overall the results are quite similar despite the differences in the methodologies used to measure mRNA abundances.
FIG. 4.
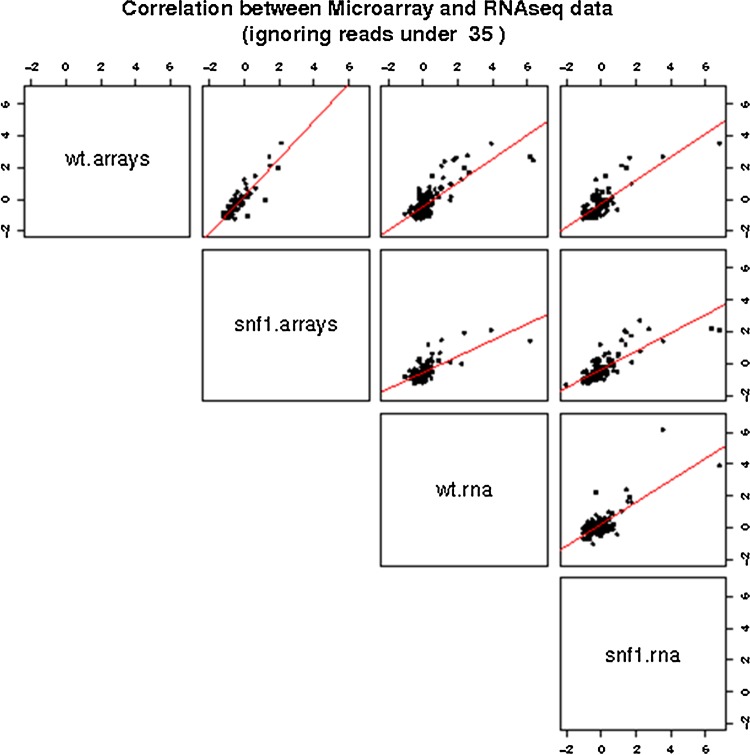
Comparisons of log-ratio values between microarrays and RNAseq filtering only genes over the optimal threshold of 35 RPKM. The diagonal contains the name of the variable that is represented in the x-axis for the row and in the y-axis for the column, respectively. Thus, the plot in the first row and the second column corresponds to the comparison between the arrays, the plot in the third row and the forth column corresponds to the comparison between the two sequencing experiments, aned the rest o plots correspond to the remaining crosscomparisons.
Detection of unconventional transcripts
Even with a low degree of coverage, the comparatively longer read size provided by pyrosequencing potentially allows for the detection of new events of splicing. Upon the application of Top-hat cuff links (Trapnell et al., 2010) to all the reads, including those that did not map into known transcripts, we have found six new splicing sites that originate new transcripts, not reported either in Ensembl or in SGD. Genes YGL031C (ribosomal protein L30 of the large 60S ribosomal subunit) and YER131W, YGR027C, YLR333C, YLR367W, and YLR388W (protein components of the small 40S ribosomal subunit) were found to display a new transcript form. All of them were 5′ heterogeneity length variants. However, a comprehensive survey of the literature revealed that such unconventional splice variants had already been described elsewhere (Juneau et al., 2007; Miura et al., 2006). Only new splice variants supported by, at least, a 10× coverage were considered. It is expected that an increase of the coverage will reveal new unconventional transcripts.
Conclusions
The main aim of differential gene expression experiments is the quantification of the differences among transcripts when comparing conditions. For this purpose we have shown that only a few reads per gene can account for a reasonably accurate evaluation of changes in its transcriptional pattern. In addition, it also allows detection of a number of transcriptionally active genes quite similar to of the number observed in the microarray analysis. Therefore, our work demonstrates that, even in a scenario of low coverage, the concordance among DNA microarrays, which has been the reference technology for transcriptional studies and the pyrosequencing technologies, is quite acceptable. Furthermore, uncommon splicing variants can be found even at low levels of coverage. Obviously, the detection of low-abundance variants will be critically dependent on higher coverage measurements. On the other hand, low coverage implies a lower number of genes over this minimum number of reads required for detecting changes in their transcriptional statuses.
An interesting conclusion from this study is the fact that using the standard annotation of yeast the results obtained are clearly suboptimal. The reason for this is that many reads map beyond the standard gene boundaries. The use of more detailed annotations of gene and transcript boundaries, derived from more recent works (Nagalakshmi et al., 2008) produces clearly improved results.
Acknowledgments
The authors acknowledge the help of Raquel Serrano at the initial steps of the microarray analysis. Work was supported by grants BFU2008-04188-C03-01, GEN2006-27748-C2-1-E/SYS, and EUI2009-04147 (SysMO ERA-NET) to J.A.; BFU2009-11593 to A.C. (Ministry of Science and Innovation, Spain), BIO BIO2008-04212 (Ministry of Science and Innovation), and PROMETEO/2010/001 (GVA-FEDER) to J.D. J.A. is recipient of an “Ajut de Suport a les Activitats dels Grups de Recerca” (2009SGR-1091, Generalitat de Catalunya). The National Institute of Bioinformatics (www.inab.org) and the CIBER de Enfermedades Raras (CIBERER) are initiatives of the ISCIII.
Author Disclosure Statement
J.P.P. is an employee of Secugen SL; L.P. is an employee of Lifesequencing SL; M.A.T. is an employee of Roche Applied Science.
References
- Alberola T.M. Garcia-Martinez J. Antunez O. Viladevall L. Barcelo A. Arino J., et al. A new set of DNA macrochips for the yeast Saccharomyces cerevisiae: features and uses. Int Microbiol. 2004;7:199–206. [PubMed] [Google Scholar]
- Arino J. Integrative responses to high pH stress in S. cerevisiae. Omics. 2010;14:517–523. doi: 10.1089/omi.2010.0044. [DOI] [PubMed] [Google Scholar]
- Blencowe B.J. Ahmad S. Lee L.J. Current-generation high-throughput sequencing: deepening insights into mammalian transcriptomes. Genes Dev. 2009;23:1379–1386. doi: 10.1101/gad.1788009. [DOI] [PubMed] [Google Scholar]
- Bloom J.S. Khan Z. Kruglyak L. Singh M. Caudy A.A. Measuring differential gene expression by short read sequencing: quantitative comparison to 2-channel gene expression microarrays. BMC Genomics. 2009;10:221. doi: 10.1186/1471-2164-10-221. [DOI] [PMC free article] [PubMed] [Google Scholar]
- Cloonan N. Forrest A.R. Kolle G. Gardiner B.B. Faulkner G.J. Brown M.K., et al. Stem cell transcriptome profiling via massive-scale mRNA sequencing. Nat Methods. 2008;5:613–619. doi: 10.1038/nmeth.1223. [DOI] [PubMed] [Google Scholar]
- Eveland A.L. McCarty D.R. Koch K.E. Transcript profiling by 3′-untranslated region sequencing resolves expression of gene families. Plant Physiol. 2008;146:32–44. doi: 10.1104/pp.107.108597. [DOI] [PMC free article] [PubMed] [Google Scholar]
- Flicek P. Aken B.L. Beal K. Ballester B. Caccamo M. Chen Y., et al. Ensembl 2008. Nucleic Acids Res. 2008;36:D707–D714. doi: 10.1093/nar/gkm988. [DOI] [PMC free article] [PubMed] [Google Scholar]
- Hedbacker K. Carlson M. SNF1/AMPK pathways in yeast. Front Biosci. 2008;13:2408–2420. doi: 10.2741/2854. [DOI] [PMC free article] [PubMed] [Google Scholar]
- Hegde P. Qi R. Abernathy K. Gay C. Dharap S. Gaspard R., et al. A concise guide to cDNA microarray analysis. Biotechniques. 2000;29:548–550. doi: 10.2144/00293bi01. 552–544, 556 passim. [DOI] [PubMed] [Google Scholar]
- Ioannidis J.P. Allison D.B. Ball C.A. Coulibaly I. Cui X. Culhane A.C., et al. Repeatability of published microarray gene expression analyses. Nat Genet. 2009;41:149–155. doi: 10.1038/ng.295. [DOI] [PubMed] [Google Scholar]
- Juneau K. Palm C. Miranda M. Davis R.W. High-density yeast-tiling array reveals previously undiscovered introns and extensive regulation of meiotic splicing. Proc Natl Acad Sci USA. 2007;104:1522–1527. doi: 10.1073/pnas.0610354104. [DOI] [PMC free article] [PubMed] [Google Scholar]
- Lamb T.M. Mitchell A.P. The transcription factor Rim101p governs ion tolerance and cell differentiation by direct repression of the regulatory genes NRG1 and SMP1 in Saccharomyces cerevisiae. Mol Cell Biol. 2003;23:677–686. doi: 10.1128/MCB.23.2.677-686.2003. [DOI] [PMC free article] [PubMed] [Google Scholar]
- Lamb T.M. Xu W. Diamond A. Mitchell A.P. Alkaline response genes of Saccharomyces cerevisiae and their relationship to the RIM101 pathway. J Biol Chem. 2001;276:1850–1856. doi: 10.1074/jbc.M008381200. [DOI] [PubMed] [Google Scholar]
- Li H. Durbin R. Fast and accurate long-read alignment with Burrows-Wheeler transform. Bioinformatics. 2010;26:589–595. doi: 10.1093/bioinformatics/btp698. [DOI] [PMC free article] [PubMed] [Google Scholar]
- Marioni J.C. Mason C.E. Mane S.M. Stephens M. Gilad Y. RNA-seq: an assessment of technical reproducibility and comparison with gene expression arrays. Genome Res. 2008;18:1509–1517. doi: 10.1101/gr.079558.108. [DOI] [PMC free article] [PubMed] [Google Scholar]
- Medina I. Carbonell J. Pulido L. Madeira S.C. Goetz S. Conesa A., et al. Babelomics: an integrative platform for the analysis of transcriptomics, proteomics and genomic data with advanced functional profiling. Nucleic Acids Res. 2010;38(Suppl):W210–W213. doi: 10.1093/nar/gkq388. [DOI] [PMC free article] [PubMed] [Google Scholar]
- Miura F. Kawaguchi N. Sese J. Toyoda A. Hattori M. Morishita S., et al. A large-scale full-length cDNA analysis to explore the budding yeast transcriptome. Proc Natl Acad Sci USA. 2006;103:17846–17851. doi: 10.1073/pnas.0605645103. [DOI] [PMC free article] [PubMed] [Google Scholar]
- Mortazavi A. Williams B.A. McCue K. Schaeffer L. Wold B. Mapping and quantifying mammalian transcriptomes by RNA-Seq. Nat Methods. 2008;5:621–628. doi: 10.1038/nmeth.1226. [DOI] [PubMed] [Google Scholar]
- Nagalakshmi U. Wang Z. Waern K. Shou C. Raha D. Gerstein M., et al. The transcriptional landscape of the yeast genome defined by RNA sequencing. Science. 2008;320:1344–1349. doi: 10.1126/science.1158441. [DOI] [PMC free article] [PubMed] [Google Scholar]
- Oshlack A. Robinson M.D. Young M.D. From RNA-seq reads to differential expression results. Genome Biol. 2010;11:220. doi: 10.1186/gb-2010-11-12-220. [DOI] [PMC free article] [PubMed] [Google Scholar]
- Platara M. Ruiz A. Serrano R. Palomino A. Moreno F. Arino J. The transcriptional response of the yeast Na(+)-ATPase ENA1 gene to alkaline stress involves three main signaling pathways. J Biol Chem. 2006;281:36632–36642. doi: 10.1074/jbc.M606483200. [DOI] [PubMed] [Google Scholar]
- Ruiz A. Serrano R. Arino J. Direct regulation of genes involved in glucose utilization by the calcium/calcineurin pathway. J Biol Chem. 2008;283:13923–13933. doi: 10.1074/jbc.M708683200. [DOI] [PubMed] [Google Scholar]
- Serrano R. Martin H. Casamayor A. Arino J. Signaling alkaline pH stress in the yeast Saccharomyces cerevisiae through the Wsc1 cell surface sensor and the Slt2 MAPK pathway. J Biol Chem. 2006;281:39785–39795. doi: 10.1074/jbc.M604497200. [DOI] [PubMed] [Google Scholar]
- Serrano R. Ruiz A. Bernal D. Chambers J.R. Arino J. The transcriptional response to alkaline pH in Saccharomyces cerevisiae: evidence for calcium-mediated signalling. Mol Microbiol. 2002;46:1319–1333. doi: 10.1046/j.1365-2958.2002.03246.x. [DOI] [PubMed] [Google Scholar]
- Shi L. Reid L.H. Jones W.D. Shippy R. Warrington J.A. Baker S.C., et al. The MicroArray Quality Control (MAQC) project shows inter- and intraplatform reproducibility of gene expression measurements. Nat Biotechnol. 2006;24:1151–1161. doi: 10.1038/nbt1239. [DOI] [PMC free article] [PubMed] [Google Scholar]
- Smyth G. Limma: linear models for microarray data. In: Gentleman R., editor; Carey V., editor; Dudoit S., editor; Irizarry R., editor; Huber W., editor. Bioinformatics and Computational Biology Solutions using R and Bioconductor. Springer; New York: 2005. pp. 397–420. [Google Scholar]
- Sultan M. Schulz M.H. Richard H. Magen A. Klingenhoff A. Scherf M., et al. A global view of gene activity and alternative splicing by deep sequencing of the human transcriptome. Science. 2008;321:956–960. doi: 10.1126/science.1160342. [DOI] [PubMed] [Google Scholar]
- T'Hoen P.A.C. Ariyurek Y. Thygesen H.H. Vreugdenhil E. Vossen R.H. de Menezes R.X., et al. Deep sequencing-based expression analysis shows major advances in robustness, resolution and inter-lab portability over five microarray platforms. Nucleic Acids Res. 2008;36:e141. doi: 10.1093/nar/gkn705. [DOI] [PMC free article] [PubMed] [Google Scholar]
- Trapnell C. Williams B.A. Pertea G. Mortazavi A. Kwan G. Van Baren M.J., et al. Transcript assembly and quantification by RNA-Seq reveals unannotated transcripts and isoform switching during cell differentiation. Nat Biotechnol. 2010;28:511–515. doi: 10.1038/nbt.1621. [DOI] [PMC free article] [PubMed] [Google Scholar]
- Viladevall L. Serrano R. Ruiz A. Domenech G. Giraldo J. Barcelo A., et al. Characterization of the calcium-mediated response to alkaline stress in Saccharomyces cerevisiae. J Biol Chem. 2004;279:43614–43624. doi: 10.1074/jbc.M403606200. [DOI] [PubMed] [Google Scholar]
- Wang Z. Gerstein M. Snyder M. RNA-Seq: a revolutionary tool for transcriptomics. Nat Rev Genet. 2009;10:57–63. doi: 10.1038/nrg2484. [DOI] [PMC free article] [PubMed] [Google Scholar]