

Abstract
In mammals, sex development is genetically and hormonally regulated. The process starts with the establishment of chromosomal structures (XY or XX), followed by the expression of sex-dependent genes. In order to elucidate the differential protein profiles between male and female amniocytes, a proteomic approach has been performed in this study. Here, we utilized a proteomics-based approach including 2D-DIGE and MALDI-TOF MS analysis to obtain differentially expressed proteins between male and female amniocytes. After resolving protein samples with 2D-DIGE technique, 45 proteins corresponding to 28 unique proteins were differentially expressed between male and female amninocytes from three independent batches of amniotic fluid. Of all of these unique identified spots, five of them (annexin A1, cathepsin D, cytoskeletal 19, protein disulfide-isomerase, and vimentin) exhibited more than 1.5-fold upregulation or downregulation in at least two independent experiments. Importantly, the identified proteins involved in protein degradation and protein folding display upregulated in male amniocytes, implying the differential regulations of protein degradation and protein folding during sex development. In conclusion, the identified differentially expressed proteins may be employed as potential signatures for the sex development. Moreover, the established proteomic platform might further utilize to discover the potential biomarkers for the prenatal genetic disorders in fetus.
Introduction
In mammals, sex development is genetically and hormonally regulated. The process starts with the establishment of chromosomal structures (XY or XX), followed by the expression of sex-dependent genes and the formation of either a testis in male or an ovary in female (DiNapoli and Capel, 2008). Male sex differentiation and male secondary sex characteristics are then controlled by three testis secreted hormones: Müllerian inhibiting substance, testosterone, and insulin-like factor 3 (Polanco and Koopman, 2007). In the lack of these critical testicular hormones, female sex differentiation arises. This sequential process of mammalian sex determination and development is also known as the Jost paradigm (Blecher and Erickson, 2007).
Two-dimensional gel electrophoresis (2-DE) and MALDI-TOF MS has been widely used for profiling plasma proteins, and some of the nonionic and zwitterionic detergents such as thiourea and CHAPS have been introduced to increase the solubility of the hydrophobic proteins. In addition, a significant improvement of gel-based analysis of protein quantifications and detections is the introduction of 2D-DIGE. 2D-DIGE is able to codetect numerous samples in the same 2-DE to minimize gel-to-gel variation and compare the protein features across different gels by means of an internal fluorescent standard. This innovative technology relies on the prelabeling of protein samples before electrophoresis with fluorescent dyes Cy2, Cy3, and Cy5 each exhibiting a distinct fluorescent wavelength to allow multiple experimental samples to include an internal standard. Thus, the samples can be simultaneously separated in one gel. The internal standard, which is a pool of an equal amount of the experimental protein samples, can facilitate the data accuracy in normalization and increase statistical confidence in relative quantitation across gels (Chen et al., 2011; Chou et al., 2010; Huang et al., 2010; Lai et al., 2010; Marouga et al., 2005; Timms and Cramer, 2008; Westermeier and Scheibe, 2008).
With the initiation of advanced analytical tools over the past few years, such as transgenic techniques, microarray-based gene profiling, and proteomics, the field of mammalian sex determination has made a remarkable progress in the understanding of the genetics and multifaceted molecular mechanisms that regulate this essential biological event. Here, we utilized a proteomics-based approach including 2D-DIGE and MALDI-TOF MS analysis to obtain a panel of proteins found to be differentially expressed between male amniocytes and female amniocytes. The identified differentially expressed proteins may be employed as potential signatures for the sex development. In addition, the established proteomic platform might further utilize to discover the potential biomarkers for the prenatal genetic disorders in fetus.
Materials and Methods
Chemicals and reagents
Generic chemicals were purchased from Sigma-Aldrich (St. Louis, MO, USA), whereas reagents for 2D-DIGE were purchased from GE Healthcare (Uppsala, Sweden). All primary antibodies were purchased from Abcam (Cambridge, UK) and antimouse, antigoat, and antirabbit secondary antibodies were purchased from GE Healthcare. All the chemicals and biochemicals used in this study were of analytical grade.
Fetal cells collection and purification
Amniotic fluid samples were obtained by amniocentesis from pregnant women (16–18th week of gestation), ranging from 30 to 40 years of age with no genetics disorder under cytogenetic analysis, after written informed consent and ethics board approval. In each independent experiment, 15 samples from pregnancies with male fetuses and 15 samples from pregnancies with female fetuses were collected. Amniotic fluid samples were pooled and centrifuged to isolate amniocytes for cell lysis with 2-DE lysis buffer containing CHAPS (4%, w/v), urea (7 M), thiourea (2 M), Tris-HCl (pH 8.3, 10 mM), EDTA (1 mM). The lysed samples were precipitated by adding 1 volume of TCA (100%,−20°C) to 4 volumes of sample and incubated for 10 min at 4°C. The precipitated protein was then recovered by centrifugation at 13,000 rpm for 10 min, and the resulting pellet was washed twice with ice-cold acetone. Air-dried pellets were resuspended in 2-DE lysis buffer.
Sample preparation for 2D-DIGE and gel image analysis
The protein sample concentrations were determined using Coomassie Protein Assay Reagent (BioRad, Hercules, CA, USA). Before performing 2D-DIGE, protein samples were labeled with N-hydroxy succinimidyl ester-derivatives of the cyanine dyes Cy3 and Cy5 following the protocol described previously (Chan et al., 2005; Gharbi et al., 2002). Briefly, 100 μg of protein sample was minimally labeled with 250 pmol of either Cy3 or Cy5 for comparison on the same 2-DE. The labeling reactions were performed in the dark on ice for 30 min and then quenched with a 20-fold molar ratio excess of free L-lysine to dye for 10 min. The differentially Cy3- and Cy5-labeled samples were then reduced with dithiothreitol for 10 min. IPG buffer, pH3–10 nonlinear [2% (v/v), GE Healthcare] was added and the final volume was adjusted to 450 μL with 2D-lysis buffer for rehydration. The rehydration process was performed with immobilized nonlinear pH gradient (IPG) strips (pH3–10, 24 cm), which were later rehydrated by CyDye-labeled samples in the dark at room temperature overnight (at least 12 h). Isoelectric focusing was then performed using a Multiphor II apparatus (GE Healthcare) for a total of 62.5 kV-h at 20°C. Strips were equilibrated in urea (6 M), glycerol (30%, v/v), SDS (1%, w/v), Tris-HCl (pH8.8, 100 mM), dithiothreitol (65 mM) for 15 min and then in the same buffer containing iodoacetamide (240 mM) for another 15 min. The equilibrated IPG strips were transferred onto 26×20-cm 12.5% polyacrylamide gels casted between low fluorescent glass plates. The strips were overlaid with low melting point agarose (0.5%, w/v) in a running buffer containing bromophenol blue. The gels were run in an Ettan Twelve gel tank (GE Healthcare) at 4 Watt per gel at 10°C until the dye front had completely run off the bottom of the gels. Afterward, the fluorescence 2-DE were scanned directly between the low fluorescent glass plates using an Ettan DIGE Imager (GE Healthcare). This imager is a charge-coupled device-based instrument that enables scanning at different wavelengths for Cy3-, and Cy5-labeled samples. Gel analysis was performed using DeCyder 2-D Differential Analysis Software v7.0 (GE Healthcare) to codetect, normalize and quantify the protein features in the images. Features detected from nonprotein sources (e.g., dust particles and dirty backgrounds) were filtered out. Spots displaying a ≥1.5 fold increase or decrease in abundance were selected for protein identification.
Protein staining
Colloidal coomassie blue G-250 staining was used to visualize CyDye-labeled protein features in 2-DE. Bonded gels were fixed in ethanol (30%, v/v), phosphoric acid (2%, v/v) overnight, washed three times (30 min each) with ddH2O and then incubated in methanol (34%, v/v), ammonium sulhate (17%, w/v), phosphoric acid (3%, v/v) for 1 h, prior to adding coomassie blue G-250 (0.5 g/liter). The gels were then left to stain for 5–7 days. No destaining step was required. The stained gels were then imaged on an ImageScanner III densitometer (GE Healthcare), which processed the gel images as .tif files.
In-gel digestion
Excised poststained gel pieces were washed three times in acetonitrile (50%), dried in a SpeedVac for 20 min, reduced with dithiothreitol (10 mM) in ammonium bicarbonate (pH 8.0, 5 mM) for 45 min at 50°C, and then alkylated with iodoacetamide (50 mM) in Ammonium bicarbonate (5 mM) for 1 h at room temperature in the dark. The gel pieces were then washed three times in acetonitrile (50%) and vacuum-dried before reswelling with 50 ng of modified trypsin (Promega, Madison, WI, USA) in Ammonium bicarbonate (5 mM). The pieces were then overlaid with 10 μL of Ammonium bicarbonate (5 mM) and trypsinized for 16 h at 37°C. Supernatants were collected, peptides were further extracted twice with trifluoroacetic acid (5%) in acetonitrile (50%), and the supernatants were pooled. Peptide extracts were vacuum dried, resuspended in 5 μL ddH2O, and stored at−20°C prior to MS analysis.
Protein identification by MALDI-TOF MS
Extracted proteins were cleaved with a proteolytic enzyme to generate peptides, then a peptide mass fingerprinting (PMF) database search following MALDI-TOF MS analysis was employed for protein identification. Briefly, 0.5 μL of tryptic digested protein sample was first mixed with 0.5 μL of a matrix solution containing α-cyano-4-hydroxycinammic acid at a concentration of 1 mg in 1 mL of acetonitrile/trifluoroacetic acid (50%/0.1%, v/v), spotted onto an anchorchip target plate (Bruker Daltonics, Fremont, CA, USA) and dried. The peptide mass fingerprints were acquired using an Autoflex III mass spectrometer (Bruker Daltonics) in reflector mode. The algorithm used for spectrum annotation was SNAP (Sophisticated Numerical Annotation Procedure). This process used the following detailed metrics: peak detection algorithm: SNAP; signal-to-noise threshold: 25; relative intensity threshold: 0%; minimum intensity threshold: 0; maximal number of peaks: 50; quality factor threshold: 1000; SNAP average composition: averaging; baseline subtraction: median; flatness: 0.8; median level: 0.5. The spectrometer was also calibrated with a peptide calibration standard (Bruker Daltonics) and internal calibration was performed using trypsin autolysis peaks at m/z 842.51 and m/z 2,211.10. Peaks in the mass range of m/z 800–3,000 were used to generate a peptide mass fingerprint that was searched against the Swiss-Prot/TrEMBL database (v2010_09) with 11636205 entries using Mascot software v2.3.01 (Matrix Science, London, UK). The following parameters were used for the search: Homo sapiens; tryptic digest with a maximum of one missed cleavage; carbamidomethylation of cysteine, partial protein N-terminal acetylation, partial methionine oxidation and partial modification of glutamine to pyroglutamate and a mass tolerance of 50 ppm. Identification was accepted based on significant MASCOT Mowse scores (p<0.05), spectrum annotation, and observed versus expected molecular weight and pI on 2-DE.
Immunoblotting
Immunoblotting was used to validate the differential expression of mass spectrometry identified proteins. Aliquots of 20 μg of proteins were diluted in Laemmli sample buffer [final concentrations: Tris (pH 6.8, 50 mM) glycerol (10%, v/v), SDS (2%, w/v), bromophenol blue (0.01%, w/v)] and separated by 1D-SDS-PAGE following standard procedures. After electroblotting separated proteins onto 0.45 μm Immobilon P membranes (Millipore, Bedford, MA, USA), the membranes were blocked with 5% w/v skim milk in TBST [Tris (pH 8.0, 50 mM), NaCl (150 mM) and Tween-20 (0.1%, v/v)] for 1 h. Membranes were then incubated in primary antibody solution in TBS-T containing sodium azide (0.02%, w/v) for 2 h. Membranes were washed in TBS-T (3×10 min) and then probed with the appropriate horseradish peroxidase-coupled secondary antibody (GE Healthcare). After further washing in TBS-T, immunoprobed proteins were visualized using an enhanced chemiluminescence method (Visual Protein Co., UK).
Results
2D-DIGE and MALDI-TOF MS analysis of the male and female fetal cell proteome
Amniotic fluid samples were obtained by amniocentesis from pregnant women with no genetics disorder under cytogenetic analysis. In each of three independent experiments, 15 samples from pregnancies with male fetuses and 15 samples from pregnancies with female fetuses were collected. Amniotic fluid samples were pooled and centrifuged to isolate amniocytes for proteomic analysis. The isolated amniocytes were lysed with 2-DE lysis buffer, precipitated with TCA/acetone followed by resuspended in 2-DE lysis buffer for protein quantification. In order to study the alteration of proteomes in male and female amniocytes, comparative proteomics analysis was performed by 2D-DIGE. The 2-DE images of the three independent samples of male and female groups were minimally labeled with Cy3 and Cy5 dyes and distributed to each gel. The samples arrangement for a triplicate 2D-DIGE experiment is shown in Figure 1A. Thus, the triplicate samples resolved in different gels can be quantitatively analyzed on multiple 2-DE. After resolving protein samples with 2D-DIGE technique, the DeCyder image analysis software indicated that more than 1,500 protein features were showing greater than 1.5-fold change in expression level across three independent experiments. MALDI-TOF MS identification revealed that 45 proteins corresponding to 28 unique proteins were differentially expressed and identified (Fig. 1B, Fig. 2, Table 1, and Supplementary Fig. 1). Most of these identified proteins belong to cytoplasm proteins (56%), plasma membrane (9%), and ER proteins (9%), and these proteins are found to be involved in cytoskeleton (27%), signal transduction (23%), and protein folding (8%) (Fig. 3). Of all of these unique identified spots, five of them (annexin A1, cathepsin D, cytoskeletal 19, protein disulfide-isomerase, and Vimentin) exhibited more than 1.5-fold upregulation or downregulation in at least two independent experiments.
FIG. 1.
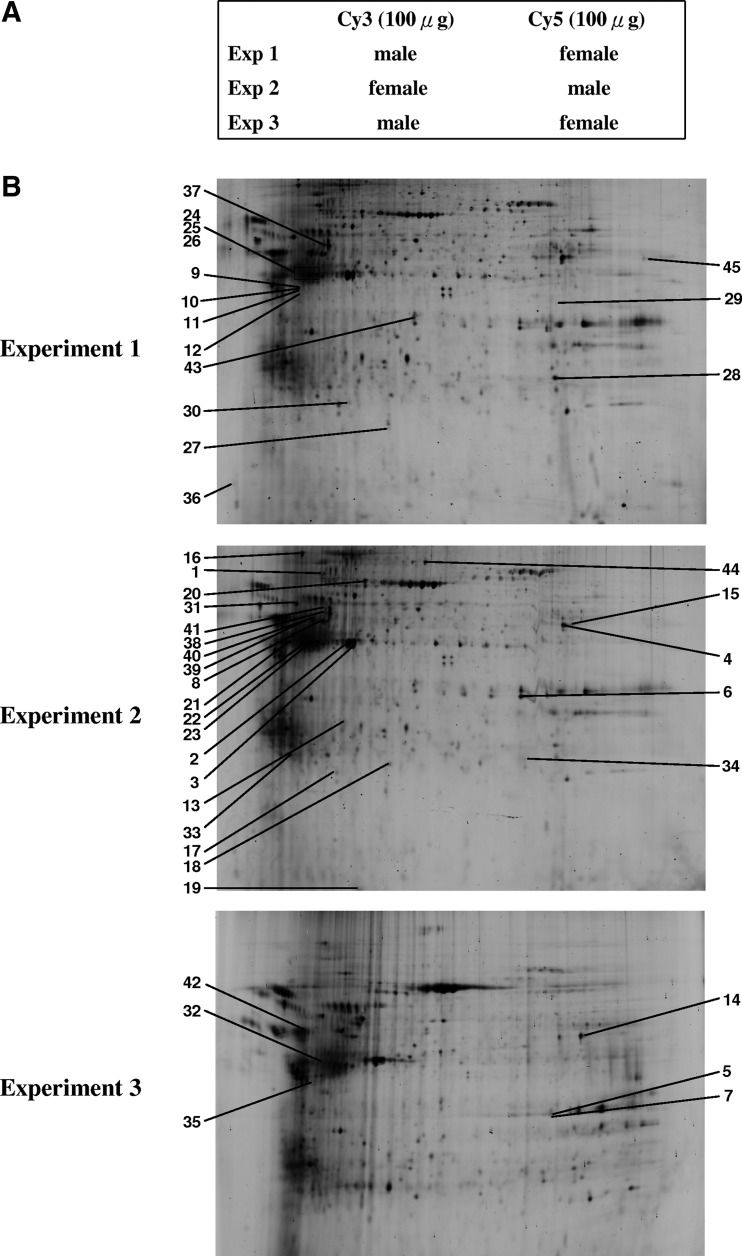
2D-DIGE analysis of gender-dependent differentially expressed proteins between male and female fetal cells in amniotic fluid. (A) Samples arrangement for three independent 2D-DIGE experiments. (B) Protein samples (150 μg each) were labeled with Cy3/Cy5 and separated using 24 cm, pH 3–10 nonlinear IPG strips. 2D-DIGE images of the protein samples from male fetal cells and female fetal cells at appropriate excitation and emission wavelengths were shown and the identified differentially expressed protein spots listed in Table 1 were labeled with their spot number.
FIG. 2.
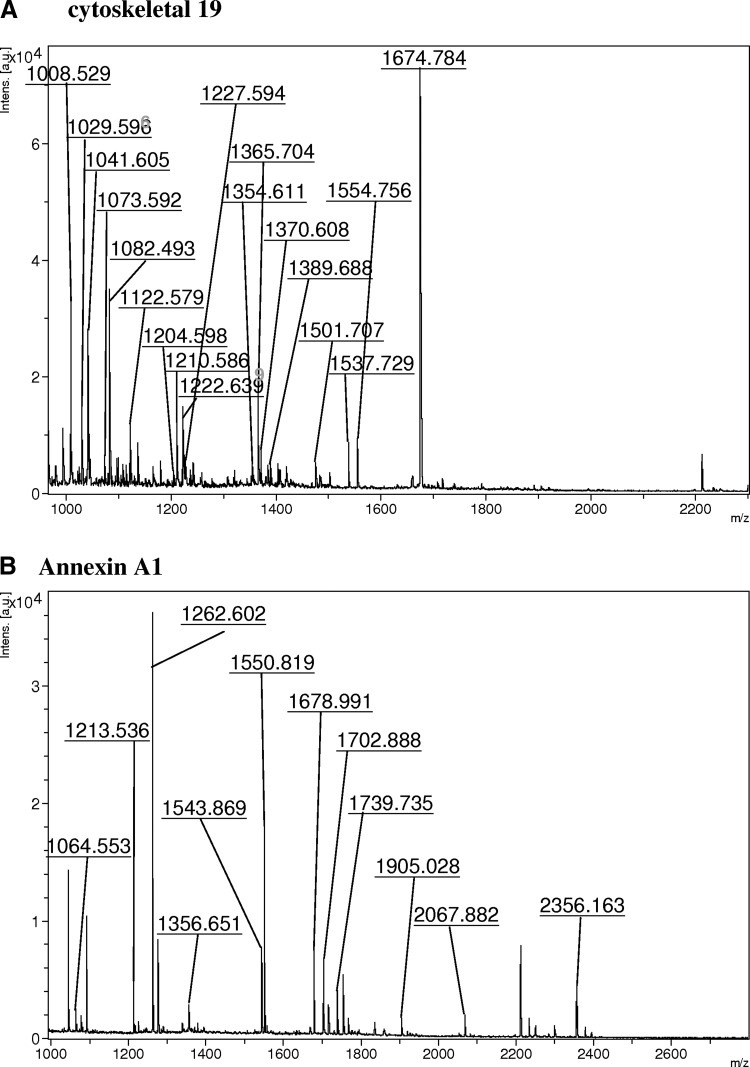
Representative peptide mass finger printing of identified proteins (A) cytoskeletal 19 and (B) annexin A1.
Table 1.
2D-DIGE and MALDI-TOF MS Analysis of Gender-Dependent Differentially Expressed Proteins Between Male and Female Fetal Cells in Amniotic Fluid
| No. | Accession No. | Protein name | pI | MW | No. match. peptides | Cov. (%) | Score | Male/female (Exp 1) | Male/female (Exp 2) | Male/female (Exp 3) | Subcellular location | Functional ontology | chromosome location | Matched peptides |
|---|---|---|---|---|---|---|---|---|---|---|---|---|---|---|
| 1 | P11021 | 78-kDa glucose-regulated protein | 5.07 | 72402 | 8/16 | 16% | 83/56 | 1.88 | ER | Protein synthesis | 9q33–q34.1 | R.IEIESFYEGEDFSETLTR.A K.DNHLLGTFDLTGIPPAPR.G |
||
| 2 | P60709 | Actin, cytoplasmic 1 | 5.29 | 42052 | 6/15 | 26% | 69/56 | 1.62 | Cytoplasm | Cytoskeleton | 7p15–12 | K.DLYANTVLSGGTTMYPGIADR.M R.AVFPSIVGRPR.H |
||
| 3 | P60709 | Actin, cytoplasmic 1 | 5.29 | 42052 | 12/50 | 41% | 85/56 | 1.52 | Cytoplasm | Cytoskeleton | 7p15–12 | K.DLYANTVLSGGTTMYPGIADR.M R.KDLYANTVLSGGTTMYPGIADR.M |
||
| 4 | P06733 | Alpha-enolase | 7.01 | 47481 | 11/34 | 24% | 68/56 | 1.92 | Cytoplasm | Metabolism | 1p3603–36.2 | K.VVIGMDVAASEFFR.S R.YISPDQLADLYK.S |
||
| 5 | P04083 | Annexin A1 | 6.57 | 38918 | 7/16 | 27% | 84/56 | −1.89 | Cell membrane | Signal transduction /Ca regulation | 9q12–21.2 | K.GVDEATIIDILTKR.N K.GLGTDEDTLIEILASR.T |
||
| 6 | P04083 | Annexin A1 | 6.57 | 38918 | 12/25 | 42% | 147/56 | −1.59 | Cell membrane | Signal transduction /Ca regulation | 9q12–21.2 | K.GVDEATIIDILTKR.N R.SEDFGVNEDLADSDAR.A |
||
| 7 | P04083 | Annexin A1 | 6.57 | 38918 | 6/25 | 26% | 99/56 | −1.61 | Cell membrane | Signal transduction /Ca regulation | 9q12–21.2 | K.GGPGSAVSPYPTFNPSSDVAALHK.A K.GLGTDEDTLIEILASR.T |
||
| 8 | P06576 | ATP synthase subunit beta, mitochondrial | 5.26 | 56525 | 19/38 | 35% | 151/56 | 1.51 | Mitochondrion | Signal transduction | 12q13.13 | K.IPVGPETLGR.I R.IMNVIGEPIDER.G |
||
| 9 | Q13938 | Calcyphosin | 4.74 | 21068 | 7/21 | 31% | 82/56 | 1.6 | Cytoplasm | Signal transduction | 19p13.3 | R.SGEWTEDEVLR.R R.SLDADEFRQGLAK.L |
||
| 10 | Q13938 | Calcyphosin | 4.74 | 21068 | 9/26 | 25% | 81/56 | 1.56 | Cytoplasm | Signal transduction | 19p13.3 | R.GASGIQGLARFFR.Q -.MDAVDATMEK.L |
||
| 11 | Q13938 | Calcyphosin | 4.74 | 21068 | 8/30 | 25% | 76/56 | 1.58 | Cytoplasm | Signal transduction | 19p13.3 | −.MDAVDATMEK.L R.GASGIQGLARFFR.Q |
||
| 12 | Q13938 | Calcyphosin | 4.74 | 21068 | 5/12 | 24% | 64/56 | 1.77 | Cytoplasm | Signal transduction | 19p13.3 | R.GASGIQGLARFFR.Q R.SLDADEFRQGLAK.L |
||
| 13 | P07858 | Cathepsin B | 5.88 | 38766 | 5/18 | 20% | 60/56 | 1.56 | Lysosome | Protein degradation | 8p22 | R.GQDHCGIESEVVAGIPR.T K.SGVYQHVTGEMMGGHAIR.I |
||
| 14 | P07339 | Cathepsin D | 6.1 | 45037 | 10/24 | 29% | 92/56 | 1.72 | Lysosome | Protein degradation | 11p15.5 | K.EGCEAIVDTGTSLMVGPVDEVR.E K.LVDQNIFSFYLSR.D |
||
| 15 | P07339 | Cathepsin D | 6.1 | 45037 | 9/30 | 24% | 62/56 | 2.1 | Lysosome | Protein degradation | 11p15.5 | K.EGCEAIVDTGTSLMVGPVDEVR.E K.EGCEAIVDTGTSLMVGPVDEVR.E |
||
| 16 | P14625 | Endoplasmin / HSP90B1 | 4.76 | 92696 | 5/17 | 8% | 64/56 | 1.7 | ER | Protein folding | 12q24.2-q24.3 | K.FAFQAEVNR.M R.LTESPCALVASQYGWSGNMER.I |
||
| 17 | P47756 | F-actin-capping protein subunit beta | 5.36 | 31616 | 10/27 | 40% | 114/56 | 1.66 | Cytoplasm | Cell motility | 1p36.1 | R.STLNEIYFGK.T K.SGSGTMNLGGSLTR.Q |
||
| 44 | P06396 | Gelsolin | 5.9 | 86043 | 8/30 | 12% | 60/56 | 1.72 | Secreted | Cytoskeleton | 9q32.34 | TGAQELLR EPGLQIWR | ||
| 18 | P09211 | Glutathione S-transferase P | 5.43 | 23569 | 5/19 | 36% | 64/56 | 1.52 | Cytoplasm | Rodox regulation | 11q13 | K.FQDGDLTLYQSNTILR.H K.DQQEAALVDMVNDGVEDLR.C |
||
| 19 | Q8NDA8 | HEAT repeat-containing protein KIAA1833 | 6.44 | 183728 | 9/17 | 7% | 63/56 | −1.95 | Unknown | Unknown | 8q24.3 | R.TSAGHEEGATRLAR.A K.VMEELLRR.L |
||
| 20 | P11142 | Heat-shock cognate 71-kDa protein | 5.37 | 71082 | 15/30 | 28% | 125/56 | 1.84 | Cytoplasm | Protein folding | 11q24.1 |
K.LDKSQIHDIVLVGGSTR.I K.VEIIANDQGNR.T |
||
| 21 | P08727 | Keratin, type I cytoskeletal 19 | 5.04 | 44065 | 16/52 | 24% | 103/56 | −1.58 | Cytoplasm | Cytoskeleton | 17q21.2 | K.LTMQNLNDR.L R.DYSHYYTTIQDLR.D |
||
| 22 | P08727 | Keratin, type I cytoskeletal 19 | 5.04 | 44065 | 18/54 | 40% | 115/56 | −1.55 | Cytoplasm | Cytoskeleton | 17q21.2 | K.LTMQNLNDR.L R.IVLQIDNAR.L |
||
| 23 | P08727 | Keratin, type I cytoskeletal 19 | 5.04 | 44065 | 9/25 | 23% | 89/56 | −1.91 | Cytoplasm | Cytoskeleton | 17q21.2 | R.QSSATSSFGGLGGGSVR.F R.DYSHYYTTIQDLR.D |
||
| 24 | P08727 | Keratin, type I cytoskeletal 19 | 5.04 | 44065 | 20/43 | 40% | 187/56 | −1.88 | Cytoplasm | Cytoskeleton | 17q21.2 | K.LTMQNLNDR.L K.IRDWYQK.Q |
||
| 25 | P08727 | Keratin, type I cytoskeletal 19 | 5.04 | 44065 | 12/18 | 27% | 156/56 | −1.64 | Cytoplasm | Cytoskeleton | 17q21.2 | K.IRDWYQK.Q R.DYSHYYTTIQDLR.D |
||
| 26 | P08727 | Keratin, type I cytoskeletal 19 | 5.04 | 44065 | 15/36 | 36% | 154/56 | −1.86 | Cytoplasm | Cytoskeleton | 17q21.2 | K.LTMQNLNDR.L K.ILGATIENSR.I |
||
| 27 | P40121 | Macrophage-capping protein | 5.88 | 38779 | 8/22 | 23% | 74/56 | −1.79 | Cytoplasm/Nucleus | Cell motility | 2p11.2 | R.EVQGNESDLFMSYFPR.G R.MQYAPNTQVEILPQGR.E |
||
| 28 | Q13330 | Metastasis-associated protein MTA1 | 9.4 | 81422 /49017 |
7/16 | 12% | 57/56 | −1.67 | Nucleus/Cytoplasm | Signal transduction | 14q32.3 | R.DYSHYYTTIQDLR.D R.DYSHYYTTIQDLR.D |
||
| 29 | Q13330 | Metastasis-associated protein MTA1 | 9.4 | 81422 /49017 |
12/27 | 17% | 86/56 | −1.75 | Nucleus/Cytoplasm | Signal transduction | 14q32.3 | R.EILRPWHAAR.N R.YQADITDLLK.E |
||
| 30 | Q8WXW3 | Progesterone-induced-blocking factor 1 | 5.77 | 90035 | 11/28 | 16% | 75/56 | −1.63 | Secreted / Centrosome | Immune response | 13q22.1 | K.TMMIDNLKVDYLTK.I R.LQAQLEESK.K |
||
| 31 | P07237 | Protein disulfide-isomerase | 4.76 | 57480 | 4/16 | 11% | 5856 | 1.81 | ER | Protein folding | 17q25 | R.TVIDYNGER.T K.ILFIFIDSDHTDNQR.I |
||
| 32 | P07237 | Protein disulfide-isomerase | 4.76 | 57480 | 9/21 | 16% | 70/56 | 1.64 | ER | Protein folding | 17q25 | R.KTFSHELSDFGLESTAGEIPVVAIR.T K.TFSHELSDFGLESTAGEIPVVAIR.T |
||
| 33 | Q9HCE1 | Putative helicase MOV-10 | 9 | 114512 | 7/12 | 8% | 59/56 | −1.93 | Cytoplasm | Transcription regulation | 1p13.2 | R.DVPLLPSDVK.L R.GLDDIKDLK.V |
||
| 34 | Q8WUD1 | Ras-related protein Rab-2B | 7.68 | 24427 | 7/34 | 25% | 58/56 | −1.51 | Cell membrane | Signal transduction | 14q11.2 | R.QHSSSNMVIMLIGNK.S -.MTYAYLFKYIIIGDTGVGK.S |
||
| 35 | P52565 | Rho GDP-dissociation inhibitor 1 | 5.02 | 23250 | 7/23 | 25% | 60/56 | 1.58 | Cytoplasm | Cell motility | 17q25.3 | K.YIQHTYRK.G K.IDKTDYMVGSYGPR.A |
||
| 36 | Q9UPQ9 | Trinucleotide repeat-containing gene 6B protein | 6.57 | 183444 | 12/27 | 7% | 63/56 | 1.65 | Cytoplasm | Transcription regulation | 22q13.1 | K.STLPGSTTSNKGK.G R.MVSALQQQQQQQQR.Q |
||
| 37 | Q9UPQ9 | Trinucleotide repeat-containing gene 6B protein | 6.57 | 183444 | 15/39 | 10% | 73/56 | 1.55 | Cytoplasm | Transcription regulation | 22q13.1 | K.IGSKSSNASWPPEFQPGVPWK.G R.MVSALQQQQQQQQR.Q |
||
| 38 | P68366 | Tubulin alpha-4A chain | 4.95 | 50634 | 7/18 | 19% | 68/56 | 1.59 | Cytoplasm | Cytoskeleton | 2q35 | R.AVFVDLEPTVIDEIR.N R.QLFHPEQLITGK.E |
||
| 39 | P07437 | Tubulin beta chain | 4.78 | 50095 | 14/26 | 30% | 124/56 | 1.65 | Cytoplasm | Cytoskeleton | 6p21.33 | R.EIVHIQAGQCGNQIGAK.F K.NSSYFVEWIPNNVK.T |
||
| 40 | P07437 | Tubulin beta chain | 4.78 | 50095 | 19/49 | 51% | 145/56 | 1.72 | Cytoplasm | Cytoskeleton | 6p21.33 | K.LTTPTYGDLNHLVSATMSGVTTCL R.FK.GHYTEGAELVDSVLDVVR.K |
||
| 41 | P08670 | Vimentin | 5.06 | 53676 | 11/24 | 25% | 108/56 | −1.66 | Cytoplasm | Cytoskeleton | 10p13 | K.VELQELNDR.F K.FADLSEAANR.N |
||
| 42 | P08670 | Vimentin | 5.06 | 53676 | 7/23 | 18% | 69/56 | −1.73 | Cytoplasm | Cytoskeleton | 10p13 | R.SLYASSPGGVYATR.S R.LGDLYEEEMR.E |
||
| 43 | P04004 | Vitronectin | 5.55 | 55069 | 7/22 | 12% | 63/56 | −1.59 | Secreted | Cell adhesion | 17q11 | R.FEDGVLDPDYPR.N R.DVWGIEGPIDAAFTR.I |
||
| 45 | Q96SR6 | Zinc-finger protein 382 | 9.4 | 65122 | 7/22 | 16% | 66/56 | −1.62 | Nucleus | Gene Regulation | 19q13.12 | K.SYLIEHQR.I R.HQKTHTGEKPYECK.Q |
Identified proteins that display a ≧1.5-fold increase or decrease in abundance and show reproducible in at least two independent experiments are shaded gray.
FIG. 3.
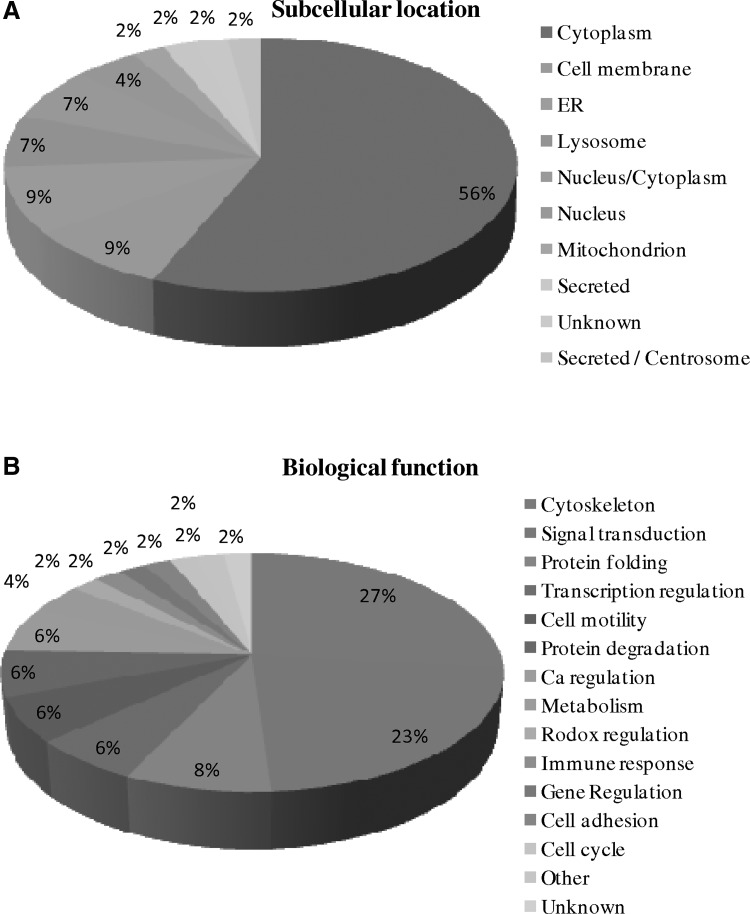
Percentage of proteins identified from male and female fetal cells in amniotic fluid according to their subcellular location (A) and biological functions (B).
Representative examples for the evaluation by DeCyder analysis of alterations in spot intensity are displayed in Figure 4 and Supplementary Figure 2. To display visually alterations in corresponding spot intensity proportions, selected identified spots are shown as 3D images as well as their spot locations in the 2D maps (Fig. 4 and Supplementary Fig. 2).
FIG. 4.
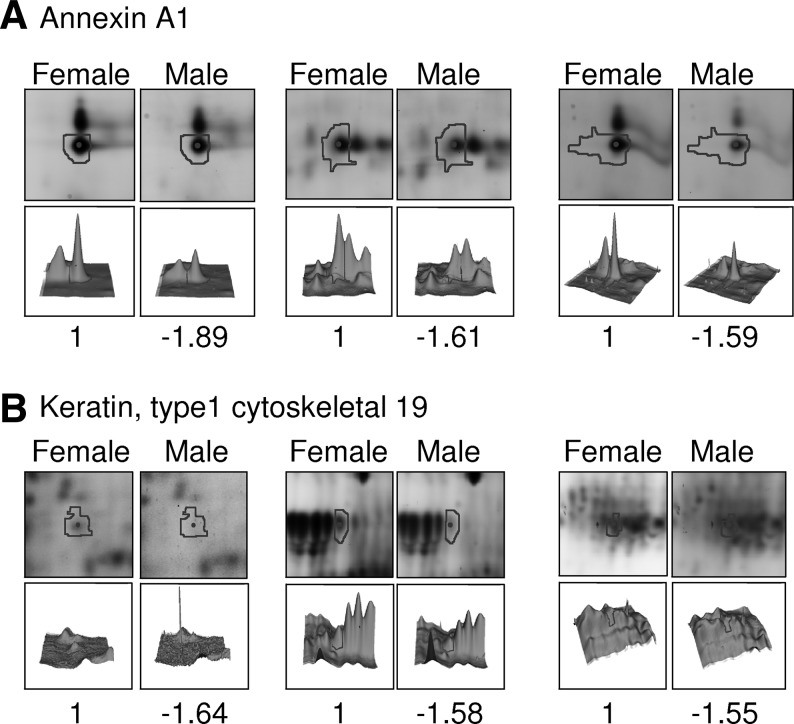
Representative images of the identified spots: (A) annexin A1; (B) cytoskeletal 19) displaying gender-dependent protein expression changes.
Validation by immunoblotting
To verify the identities of proteins deduced from the results of 2D-DIGE and MALDI-TOF MS, the expression levels of identified PDI, cathepsin D, and tubulin beta were investigated by immunoblotting (Fig. 5). As is shown in Figure 5, the 58 kDa of PDI was significant increased in the male amninocytes in comparison with female ones. The expression levels of cathepsin D (a 45-kDa protein) and tubulin beta (a 50-kDa protein) were also increased in male amninocytes. These immunoblotting results are completely consistent with the data from the 2D-DIGE and MALDI-TOF MS, and further suggest their roles in the sex-development.
FIG. 5.
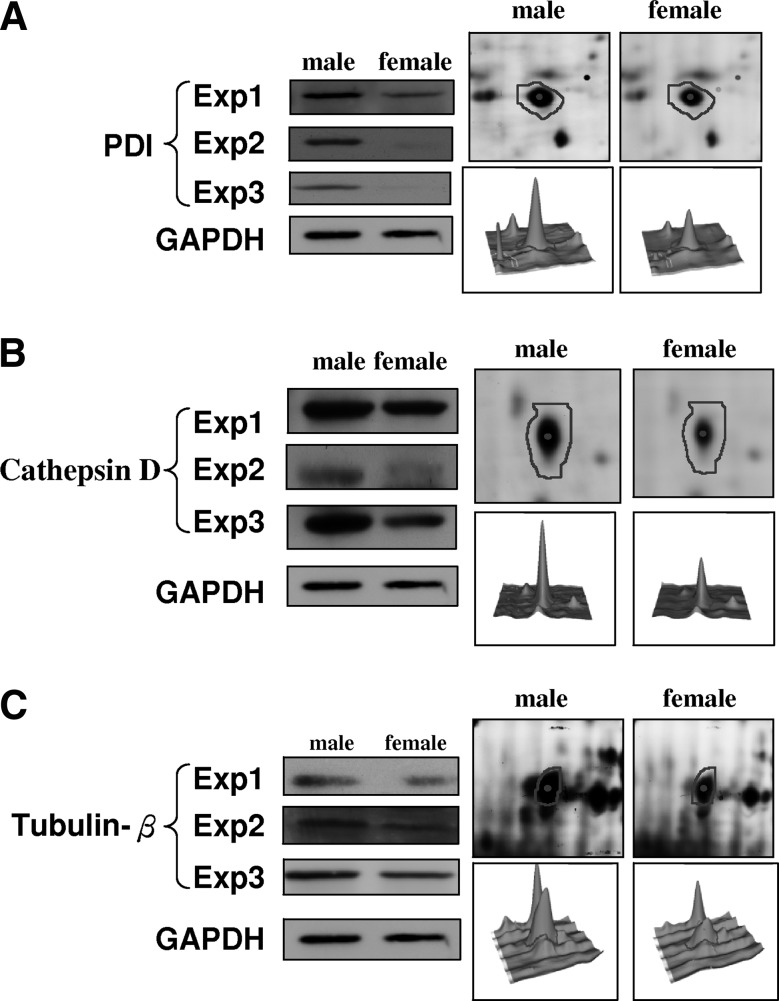
Representative immunoblotting analysis for selected differentially expressed proteins identified by proteomic analysis.
Discussion
In humans, sex determination is taking place at the stage of fertilization and further regulated by genetic and hormonal processes. At approximately 6–7 weeks of human gestation, the formation of either a testis in male or an ovary in female is occurred (DiNapoli and Capel, 2008). Male sex differentiation and male secondary sex characteristics are controlled by testis secreted hormones. In the lack of these critical testicular hormones, female sex differentiation takes place. Currently, some sex determination genes have been identified including SRY, SOX9, SF1, DAX1, WNT4, WT1, DMRT1, DHH, RSPO1, and ATRX (Pleskacova et al., 2009). Most of these sex-related studies were based on gene transcriptional level such as the expressional changes of mRNA (Nordqvist and Tohonen, 1997), cDNA library (Wertz and Herrmann, 2000), suppression subtractive hybridization (Menke and Page, 2002) and microarray (Verma-Kurvari et al., 2005). Few studies were directly using proteomics to investigate the translation level of proteins. Recently, Ewen et al. (2009) were using LC-based proteomic analysis to investigate protein expression during gonadal sex determination in mice. The result indicated that potential novel regulators of gonad development and sex determination not revealed previously by transcriptomics and proteomics studies were identified including more than 60 proteins with potential relationship to human disorders of sexual development.
In this study, we utilized a proteomics-based approach including 2D-DIGE and MALDI-TOF MS analysis to obtain differentially expressed proteins between male amniocytes and female amniocytes. The strategy used in this study allowed the assessment of 29 proteins differentially expressed in between male amniocytes and female amniocytes. Five of them (annexin A1, cathepsin D, cytoskeletal 19, protein disulfide-isomerase, and Vimentin) were exhibited more than 1.5-fold upregulation or downregulation in at least two independent experiments, in which cathepsin D and protein disulfide-isomerase were shown to be upregulated in male amniocytes. In contrast, annexin A1, cytoskeletal 19, and Vimentin were shown to be upregulated in female amniocytes. Database search showed that genes encoding for these proteins are located on chromosomes other than Y chromosome and their expression is possibly due to the trans-activation of transcription factors located specifically on chromosome Y or on chromosome X.
Pelliniemi and Kim's sex determination study revealed that cytokeratin 19 mRNA was disappearance at the age of 14.5 days and cytokeratin 19 protein was significant downregulation by the age of 19 days during the differentiation of sertoli cells in the rat testis, but not in the ovary, suggesting that this protein is closely related to epithelial structural differentiation (Loffler et al., 2000; Pelliniemi and Frojdman, 2001). This result was also reproduced in our amniocyte studies, which showed a downregulation of cytokeratin 19 in male amniocytes in comparison with female amniocytes suggesting cytokeratin 19 with an important role in sex determination. Vimentin is one of the mesenchymal markers during tumor epithelial–mesenchymal transition. Like cytokeratin 19, vimentin is a member of intermediate filament proteins and are both recognized as tumor cell markers and metastasis markers (Buccheri et al., 2003; Leader et al., 1987; Lin et al., 2002; Porcel et al., 2004). This implies part of tumorigenic and sex determination processes might share similar mechanisms and protein expression. Cathepsin D, a lysosomal aspartic protease, is overexpressed in estrogen receptor positive breast cancer cells and is generally a prognostic marker for some cancers (Rochefort, 1999). Additionally, cathepsin D gene expression was reported to be regulated differently by sex steroid hormones in endometrial and breast cancer cell lines (Touitou et al., 1989). Our finding indicates that cathepsin D is upregulated in male amniocytes rather than in female amniocytes, suggesting cathepsin D might be differentially regulated by sex steroid hormones in fetal cells. Annexin A1 belongs to the annexin family of Ca2+-dependent phospholipid-binding proteins. In previous studies, treatment of MCF-7 breast cancer cells with high concentration of estrogen leads to an upregulation of annexin A1. Silencing of annexin A1 with specific siRNA inhibited the estrogen-dependent proliferation. Thus, annexin A1 may mediate the signaling pathways of estrogen receptor and directly modulate the proliferative functions of estrogens (Ang et al., 2009). Another report indicated female hormone 17beta-estradiol is able to stimulate annexin A1 expression (Davies et al., 2007). Our finding demonstrated annexin A1 is upregulated in female amniocytes suggesting the increase of the protein level is possibly contributed by estrogen, estrogen receptors, and female hormones. Notably, the identified proteins involved in protein degradation and protein folding display upregulated in male amniocytes implying the differential regulations of protein degradation and protein folding during sex development (Fig. 6).
FIG. 6.
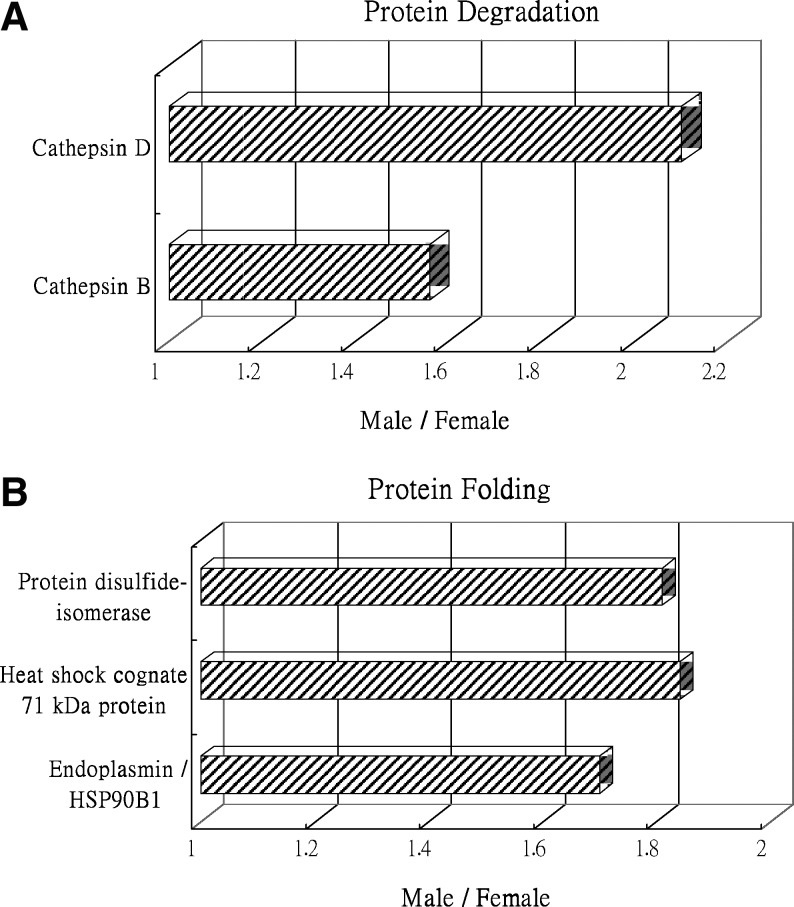
Expression profiles for proteins potentially contributing to (A) protein degradation and (B) protein folding in comparing male and female fetal cells in amniotic fluid. Horizontal bars represent fold changes in protein expression in male fetal cells versus female fetal cells. The vertical axis indicates the identified proteins; the horizontal axis indicates the fold change in protein expression. Additional details for each protein can be found in Table 1.
In conclusion, our proteomics analysis of male and female amniocytes is the first report for this field and provides a valuable impact for sex-development research. The 2D-DIGE and MALDI-TOF MS have been applied as powerful approaches for the proteomic analysis of human diseases. However, this proteomic strategy is never applied in the field of sex-dependent protein expression in amniocytes. In this study, we developed a proteomics strategy and found some specific protein signatures for male and female amniocytes. Even though the overall reproducibility of the proteomic results were not high due to the variations from independent batches of samples, our results indicate that calcium-dependent signaling protein (such as annexin A1), proteolytic enzyme (such as cathepsin D), cytoskeleton protein (such as cytokeratin 19 and vimentin), and folding-assistant protein (such as protein disulfide-isomerase) confidently showed a sex-dependent differential expression and might play important roles in sex development. Furthermore, the established proteomic platform might further utilize to discover the potential biomarkers for the prenatal genetic disorders in the fetus.
Conclusion
In this study, we utilized a proteomics-based approach to obtain differentially expressed proteins between male and female amniocytes. The identified proteins involved in protein degradation and protein folding display upregulated in male amniocytes implying the differential regulations of protein degradation and protein folding during sex development. Furthermore, the established proteomic platform might further utilize to discover the potential biomarkers for the prenatal genetic disorders in the fetus.
Supplementary Material
Acknowledgments
This work was supported by grant (NSC 99-2311-B-007-002) from the National Science Council, Taiwan, NTHU Booster grant (99N2908E1) from the National Tsing Hua University and grant (VGHUST99-P5-22) Veteran General Hospitals University System of Taiwan.
Author Disclosure Statement
The authors confirm that no competing financial interests exist.
References
- Ang E.Z. Nguyen H.T. Sim H.L., et al. Annexin-1 regulates growth arrest induced by high levels of estrogen in MCF-7 breast cancer cells. Mol Cancer Res. 2009;7:266–274. doi: 10.1158/1541-7786.MCR-08-0147. [DOI] [PubMed] [Google Scholar]
- Blecher S.R. Erickson R.P. Genetics of sexual development: a new paradigm. Am J Med Genet A. 2007;143A:3054–3068. doi: 10.1002/ajmg.a.32037. [DOI] [PubMed] [Google Scholar]
- Buccheri G. Torchio P. Ferrigno D. Clinical equivalence of two cytokeratin markers in mon-small cell lung cancer: a study of tissue polypeptide antigen and cytokeratin 19 fragments. Chest. 2003;124:622–632. doi: 10.1378/chest.124.2.622. [DOI] [PubMed] [Google Scholar]
- Chan H.L. Gharbi S. Gaffney P.R., et al. Proteomic analysis of redox- and ErbB2-dependent changes in mammary luminal epithelial cells using cysteine- and lysine-labelling two-dimensional difference gel electrophoresis. Proteomics. 2005;5:2908–2926. doi: 10.1002/pmic.200401300. [DOI] [PubMed] [Google Scholar]
- Chen Y.W. Chou H.C. Lyu P.C., et al. Mitochondrial proteomics analysis of tumorigenic and metastatic breast cancer markers. Funct Integr Genomics. 2011;11:225–239. doi: 10.1007/s10142-011-0210-y. [DOI] [PubMed] [Google Scholar]
- Chou H.C. Chen Y.W. Lee T.R., et al. Proteomics study of oxidative stress and Src kinase inhibition in H9C2 cardiomyocytes: a cell model of heart ischemia reperfusion injury and treatment. Free Radic Biol Med. 2010;49:96–108. doi: 10.1016/j.freeradbiomed.2010.04.001. [DOI] [PubMed] [Google Scholar]
- Davies E. Omer S. Morris J.F., et al. The influence of 17beta-estradiol on annexin 1 expression in the anterior pituitary of the female rat and in a folliculo-stellate cell line. J Endocrinol. 2007;192:429–442. doi: 10.1677/JOE-06-0132. [DOI] [PMC free article] [PubMed] [Google Scholar]
- DiNapoli L. Capel B. SRY and the standoff in sex determination. Mol Endocrinol. 2008;22:1–9. doi: 10.1210/me.2007-0250. [DOI] [PMC free article] [PubMed] [Google Scholar]
- Ewen K. Baker M. Wilhelm D., et al. Global survey of protein expression during gonadal sex determination in mice. Mol Cell Proteomics. 2009;8:2624–2641. doi: 10.1074/mcp.M900108-MCP200. [DOI] [PMC free article] [PubMed] [Google Scholar]
- Gharbi S. Gaffney P. Yang A., et al. Evaluation of two-dimensional differential gel electrophoresis for proteomic expression analysis of a model breast cancer cell system. Mol Cell Proteomics. 2002;1:91–98. doi: 10.1074/mcp.t100007-mcp200. [DOI] [PubMed] [Google Scholar]
- Huang H.L. Hsing H.W. Lai T.C., et al. Trypsin-induced proteome alteration during cell subculture in mammalian cells. J Biomed Sci. 2010;17:36. doi: 10.1186/1423-0127-17-36. [DOI] [PMC free article] [PubMed] [Google Scholar]
- Lai T.C. Chou H.C. Chen Y.W., et al. Secretomic and proteomic analysis of potential breast cancer markers by two-dimensional differential gel electrophoresis. J Proteome Res. 2010;9:1302–1322. doi: 10.1021/pr900825t. [DOI] [PubMed] [Google Scholar]
- Leader M. Collins M. Patel J., et al. Vimentin: an evaluation of its role as a tumour marker. Histopathology. 1987;11:63–72. doi: 10.1111/j.1365-2559.1987.tb02609.x. [DOI] [PubMed] [Google Scholar]
- Lin J.C. Chen K.Y. Wang W.Y., et al. Evaluation of cytokeratin-19 mRNA as a tumor marker in the peripheral blood of nasopharyngeal carcinoma patients receiving concurrent chemoradiotherapy. Int J Cancer. 2002;97:548–553. doi: 10.1002/ijc.10075. [DOI] [PubMed] [Google Scholar]
- Loffler S. Horn L.C. Weber W., et al. The transient disappearance of cytokeratin in human fetal and adult ovaries. Anat Embryol (Berl) 2000;201:207–215. doi: 10.1007/s004290050019. [DOI] [PubMed] [Google Scholar]
- Marouga R. David S. Hawkins E. The development of the DIGE system: 2D fluorescence difference gel analysis technology. Anal Bioanal Chem. 2005;382:669–678. doi: 10.1007/s00216-005-3126-3. [DOI] [PubMed] [Google Scholar]
- Menke D.B. Page D.C. Sexually dimorphic gene expression in the developing mouse gonad. Gene Expr Patterns. 2002;2:359–367. doi: 10.1016/s1567-133x(02)00022-4. [DOI] [PubMed] [Google Scholar]
- Nordqvist K. Tohonen V. An mRNA differential display strategy for cloning genes expressed during mouse gonad development. Int J Dev Biol. 1997;41:627–638. [PubMed] [Google Scholar]
- Pelliniemi L.J. Frojdman K. Structural and regulatory macromolecules in sex differentiation of gonads. J Exp Zool. 2001;290:523–528. doi: 10.1002/jez.1096. [DOI] [PubMed] [Google Scholar]
- Pleskacova J. Snajderova M. Lelbl J. Disorders of sex differentiation: genes responsible for development of genital system and final phenotype. Ceska Gynekol. 2009;74:192–197. [PubMed] [Google Scholar]
- Polanco J.C. Koopman P. Sry and the hesitant beginnings of male development. Dev Biol. 2007;302:13–24. doi: 10.1016/j.ydbio.2006.08.049. [DOI] [PubMed] [Google Scholar]
- Porcel J.M. Vives M. Esquerda A., et al. Use of a panel of tumor markers (carcinoembryonic antigen, cancer antigen 125, carbohydrate antigen 15-3, and cytokeratin 19 fragments) in pleural fluid for the differential diagnosis of benign and malignant effusions. Chest. 2004;126:1757–1763. doi: 10.1378/chest.126.6.1757. [DOI] [PubMed] [Google Scholar]
- Rochefort H. Estrogen-induced genes in breast cancer, and their medical importance. Bull Acad Natl Med. 1999;183:955–968. [PubMed] [Google Scholar]
- Timms J.F. Cramer R. Difference gel electrophoresis. Proteomics. 2008;8:4886–4897. doi: 10.1002/pmic.200800298. [DOI] [PubMed] [Google Scholar]
- Touitou I. Cavailles V. Garcia M., et al. Differential regulation of cathepsin D by sex steroids in mammary cancer and uterine cells. Mol Cell Endocrinol. 1989;66:231–238. doi: 10.1016/0303-7207(89)90035-x. [DOI] [PubMed] [Google Scholar]
- Verma-Kurvari S. Nef S. Parada L.F. Hormonal regulation of male reproductive tract development. Ann N Y Acad Sci. 2005;1061:1–8. doi: 10.1196/annals.1336.002. [DOI] [PubMed] [Google Scholar]
- Wertz K. Herrmann B.G. Large-scale screen for genes involved in gonad development. Mech Dev. 2000;98:51–70. doi: 10.1016/s0925-4773(00)00452-4. [DOI] [PubMed] [Google Scholar]
- Westermeier R. Scheibe B. Difference gel electrophoresis based on lys/cys tagging. Methods Mol Biol. 2008;424:73–85. doi: 10.1007/978-1-60327-064-9_7. [DOI] [PubMed] [Google Scholar]
Associated Data
This section collects any data citations, data availability statements, or supplementary materials included in this article.