

Abstract
Purpose
To analyze the morphology and density of corneal epithelial cells, keratocytes, and subbasal nerves, in patients with early stage Fuchs' endothelial corneal dystrophy (FECD) by in vivo confocal microscopy (IVCM).
Methods
IVCM (Confoscan 4, Nidek, Inc.) of the central cornea was performed in 30 corneas of 30 patients with early stage FECD and 13 corneas of 13 normal controls. Images were analyzed for morphology and density of the superficial and basal epithelial cells, keratocyte density, endothelial cell density (ECD), as well as subbasal corneal nerve parameters. Central corneal thickness (CCT) was measured in all patients and normals by ultrasound pachymetry.
Results
The ECD was significantly lower (−45.5%, P<0.001) in FECD patients as compared with controls. Total number of nerves and main nerve trunks were significantly reduced (−46.3%, P<0.001; −39.7%, P<0.001) in patients with FECD. Posterior keratocyte density was significantly higher in FECD patients (P<0.001). Significant inverse correlations were found between CCT and total number of nerves (r=−0.69, P<0.001), CCT and main nerve trunks (−0.47, P=0.016), as well as CCT and total nerve length (r=−0.62, P=0.006). Significant correlation was found between ECD and total number of nerves (r=0.44, P=0.012) as well as between ECD and main nerve trunks (r=0.65, P<0.001).
Conclusions
IVCM demonstrates alterations in corneal innervation in patients with early stage FECD, suggesting a potential role of corneal nerves in the pathogenesis of FECD. Additional studies are required to investigate whether subbasal nerve alterations are caused by nonspecific corneal edema, from FECD-induced decrease in ECD, or potentially leading to loss of endothelial cells.
Keywords: in vivo confocal microscopy, Fuchs' endothelial corneal dystrophy, cornea, corneal nerves, epithelium, keratocytes
Introduction
Fuchs' endothelial corneal dystrophy (FECD) is a bilateral, slowly progressive, disorder of corneal endothelium, characterized by extracellular matrix deposition, morphological changes in corneal endothelial mosaic, and decreased corneal endothelial cell density (ECD).1 FECD manifests as progressive corneal edema, loss of vision, corneal scarring, and pain. Although the corneal endothelium has been considered to be the primary cause of corneal decompensation, increased keratocyte apoptosis has been detected in FECD compared with normal subjects.2 These findings led us to hypothesize that other cell types, in addition to corneal endothelial cells, might be altered in early FECD corneas.
In vivo confocal microscopy (IVCM), which has been evolving continuously over the past two decades, is a non-invasive methodology that allows the imaging of the living human cornea. Since Lemp et al3 first applied ex vivo tandem scanning confocal microscopy to an eyebank cornea, non-invasive in vivo visualization of corneal tissue, including corneal nerves, has become a powerful clinical and research tool.4, 5, 6 Corneal nerve imaging is a fascinating technique for both clinicians and researchers alike, as it provides a better understanding of how corneal nerves are involved in regulating corneal physiology, homeostasis, wound healing, and cytoprotection.7, 8, 9, 10
Several prior studies have reported IVCM results in patients with FECD.11, 12, 13 Chiou et al showed morphological alterations of corneal endothelium in FECD patients by tandem scanning IVCM, whereas Mustonen et al demonstrated pathological alterations in all corneal layers using slit scanning IVCM. In addition, Hara et al showed a significant correlation between the ECD as acquired by IVCM and non-contact specular microscopy in FECD patients. However, to date there are no systematic studies examining subbasal corneal nerve changes in early FECD patients in a quantitative manner.
The purpose of this study was therefore to perform a comprehensive analysis of subbasal corneal nerves, corneal epithelial cell morphology and stromal keratocyte density in FECD patients by IVCM, and to correlate these findings to corneal ECD and central corneal thickness (CCT) measurements.
Materials and methods
Patients
This was a retrospective, cross-sectional, single-center study. Institutional Review Board/Ethics Committee of the Massachusetts Eye and Ear Infirmary approval was obtained and the study was HIPAA compliant and adhered to the tenets of the Declaration of Helsinki. Thirty corneas of 30 patients with early stage FECD (68.0±9.5 years (range 50–86); 18 female, 12 male) and 13 corneas of 13 control subjects (64.2±13.9 years (range 30–80); 7 female, 6 male) were examined at the Cornea Service, Massachusetts Eye and Ear Infirmary between 2006 and 2011. Specular confocal microscopy was performed in FECD patients for routine clinical care. Control patients included patients who underwent specular confocal microscopy for ECD measurements for cataracts and refractive surgery evaluations.
In this study, 21 patients with FECD stage 1 and 9 patients with FECD stage 2 were included. No patients with FECD stages 3 and 4 were included, and none of the included patients had bullous keratopathy. Stage 1 was defined by appearance of guttae in the absence of edema, stage 2 was characterized by the appearance of guttae with additional stromal edema, but without epithelial changes, in stage 3 epithelial involvement plus the changes of stage 2 occurred, and in stage 4 additional scarring occurred. Stromal edema was defined as clinically apparent thickening of the stroma by slit-lamp biomicroscopy. Patients with recent history of contact lens use, any previous ocular surgery, diabetes, refractive surgery, herpes simplex keratitis, or herpes zoster ophthalmicus, were not included in the study. CCT had been measured by ultrasound pachymetry (Accupach VI, Accutome, Malvern, PA, USA).
Confocal microscopy
The central corneas were examined using IVCM (Confoscan 4, Nidek, Inc., Gamagori, Japan), using a × 40/0.75 objective lens. One drop of topical anesthesia (0.5% proparacaine hydrochloride; Alcaine, Alcon, Fort Worth, TX, USA) was instilled in both eyes. Patients were seated in front of the microscope with the aide of a chin rest and a fixation light for the contralateral eye to minimize eye movement. A drop of 0.3% hypromellose (GenTeal gel, Novartis Ophthalmics, East Hanover, NJ, USA) was placed on the tip of the objective lens as an optical coupling medium, and the lens was manually advanced until the gel contacted the central surface of the cornea. Full thickness confocal scans were acquired at a speed of 25 frames per second, obtaining 350 images per scan. Each image represented a coronal section of 460 × 345 μm (768 × 576 pixel) with a minimum axial step of 1 μm, magnification of × 500, and lateral resolution of 0.6 μm/pixel.
Image analysis
To assess the corneal epithelium, we selected images from the superficial and basal epithelial layers. For quantitative assessment of corneal nerves, we selected images of the subbasal nerve plexus from the layer immediately posterior to the basal epithelial layer and/or anterior to the Bowman's layer. To evaluate keratocyte densities, we selected images from the anterior (first images of the stroma posterior to Bowman's layer and the posterior stroma (images immediately anterior to the endothelial layer). The best-focused and most representative images for superficial and basal epithelial layer, subbasal nerve plexus, anterior and posterior stroma, and the endothelium were then quantitatively analyzed. The criteria to select the images were the best-focused and complete images, with the whole image in the same layer, without motion, and good contrast. Three representative images per patient per layer were analyzed by two masked observers.
Quantification of the ECD was performed automatically with the Confoscan 4 NAVIS software and corrected manually. Areas with guttae were excluded from analysis. Quantification of the keratocyte and epithelial cell densities was performed manually by Confoscan 4 NAVIS analysis software, and the automated analysis was not utilized. This was achieved by marking each clearly defined cell or nucleus in a pre-defined rectangular frame on the computer screen. The size of the pre-defined frame for evaluation of keratocyte densities measured 300 × 225 μm. Nuclei that overlapped the pre-defined frame were included only on left and inferior side. The analysis was performed manually and independently by two experienced examiners masked to the diagnosis to determine endothelial cell, posterior and anterior keratocyte, and superficial epithelial cell density. The estimated depth of field was calculated by assuming that actual density in the posterior stroma was equal to 22 166 cells per mm3.14 Volumetric density was recalculated with an estimated depth of field of 38 μm.
A fixed frame (300 × 225 μm) and a variable frame (minimum dimension of 150 × 112 μm) were used to determine superficial and basal cell densities, respectively. Cells that overlapped the pre-defined frames were included only on left and inferior side. Superficial epithelial cells become highly reflective before desquamation.15 To assess epithelial damage, percentage of highly reflective superficial epithelial cells was calculated by dividing highly reflective cells per frame by total number of superficial epithelial cells per frame and multiplying by 100. For epithelial cell size, operators defined the borders of superficial epithelial cells manually with the Confoscan Software NAVIS, calculating the epithelial cell area after manual delineation of cell borders. The area of 10 contiguous epithelial cells was selected from the center of the image, quantified, and averaged per frame.
Subbasal nerves were quantified as previously described.16, 17 Nerve density was assessed after images were exported, and nerves were manually traced with a perimeter tool (Adobe Acrobat 6.0 Professional, Adobe Systems, Inc., San Jose, CA, USA), measuring the total length of the nerve fibers per frame. Main nerve trunks were defined as the total number of main nerve trunks in one image after analyzing the images anterior and posterior to the analyzed image to confirm that these did not branch from other nerves. Nerve branching was defined as the total number of nerve branches in one image. The number of total nerves measured was defined as the number of all nerves, including main nerve trunks and branches in one image. As a grading scale for tortuosity, we used the classification described by Oliveira-Soto and Efron.10 Branching was defined as (total number of nerves−number of main nerve trunks)/number of main nerve trunks. Owing to patient movement and ocular pulsation CCT could not be determined by Confoscan 4. The CCT was measured in all patients and normals by ultrasound pachymetry.
Statistical analyses
Statistical analyses were performed using SPSS ver. 15.0; SPSS, Chicago, IL, USA. To compare values between two groups with respect to continuous variables independent samples Student's t-test was performed. For differences in dichotomous variables between groups, we used the Pearson χ2-test. Statistical correlations were evaluated by Pearson's correlation coefficient. In all statistical analyses, all tests were two-tailed and P<0.05 was considered statistically significant.
Results
There were no statistically significant differences between FECD patients and controls for age or gender (P=0.311 and 0.707; Table 1). Images of corneal endothelial cells, subbasal nerve, and epithelial cell layers of one healthy control and one FECD patient are shown in Figures 1a–h. Endothelial cells of the control group appeared as a regular array of mainly hexagonal cells, exhibiting bright cell bodies and dark cell borders (Figure 1a). By contrast, the endothelium of FECD patients showed typical guttae, pleomorphism, and polymegathism (Figure 1e). Owing to severe guttae, ECD was not measurable in two FECD patients. Innervation was reduced in FECD patients (Figure 1f) compared with the healthy controls (Figure 1b). However, the basal epithelial cell layer showed no morphological differences (Figures 1c and g) between both patients. In addition, hyperreflective superficial epithelial cells were seen in the FECD patient (Figure 1h). Further, the mean CCT as measured by ultrasound pachymetry was significantly higher in FECD patients (mean±SD; 598.8±58.7 μm) as compared with controls (545.8±24.2 μm, P<0.001; Table 2; Figure 2a). Moreover, the ECD was significantly lower in FECD patients (1624.3±529.7 cells per mm2) as compared with controls (2981.5±364.7cells per mm2, P<0.001; Table 2; Figure 2b).
Table 1. Subject demographics.
| Normal | FECD | Pa | |||
|---|---|---|---|---|---|
| Number of subjects/eyes | 13 | 30 | |||
| Gender | |||||
| Female/male | 7/6 | 18/12 | 0.707 | ||
| Mean±SD | Range | Mean±SD | Range | Pa | |
| Age (years) | 64.2±13.9 | 30–80 | 68.0±9.5 | 50–86 | 0.311 |
Differences between groups were tested for statistical significance with independent sample t-test for continuous variables and with the Pearson χ2-test for dichotomous variables.
Figure 1.
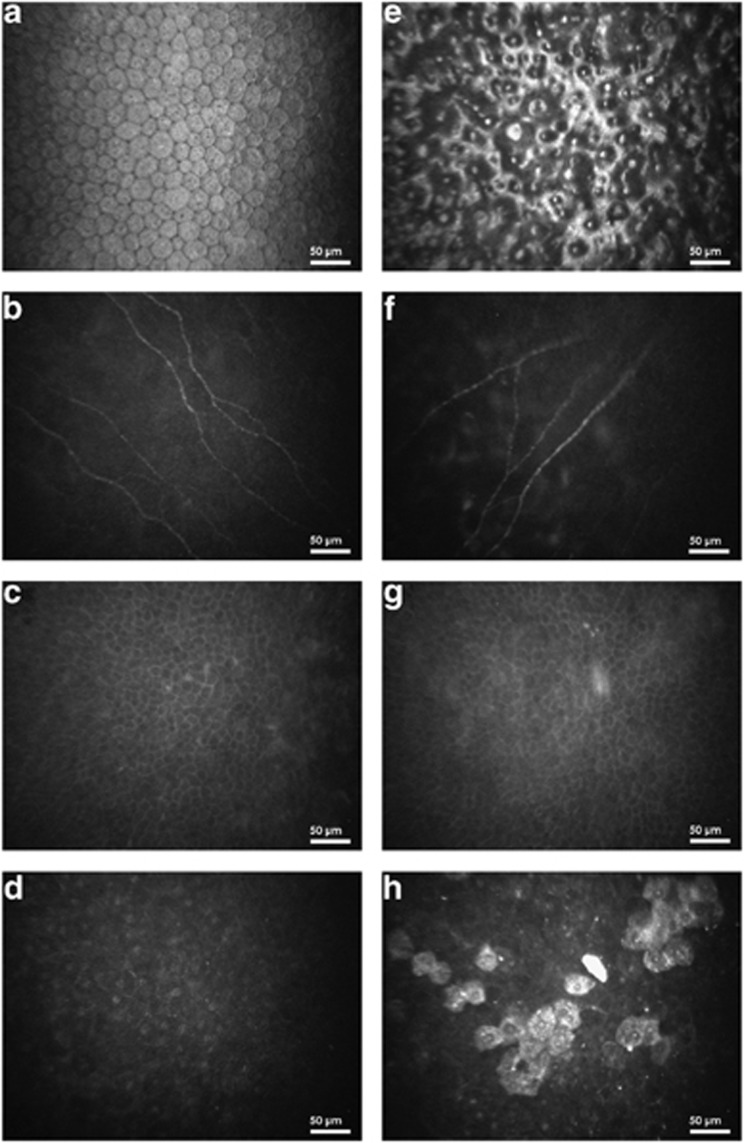
Endothelial cell layer (a, e), subbasal nerve plexus (b, f), basal epithelial layer (c, g), and superficial epithelial cell layer (d, h) of one healthy control (left column) and one FECD patient (right column), respectively. ECD could not be assessed in (e).
Table 2. Confocal microscopic findings.
| Normals | FECD patients | Pa | |||
|---|---|---|---|---|---|
| |
Mean±SD |
Range |
Mean±SD |
Range |
|
| Endothelial cells (cells per mm2) | 2981.5±364.7 | 2207–3483 | 1624.3±529.7 | 700–2515 | <0.001b |
| CCT (μm) | 545.8±24.2 | 495–587 | 598.8±58.7 | 521–774 | <0.001b |
| Total number of nerves (all nerves) | 12.1±1.9 | 9–15 | 6.2±1.9 | 3–10 | <0.001b |
| Main nerve trunks | 6.3±1.5 | 3–9 | 3.8±1.1 | 2–6 | <0.001b |
| Branching (total nerves−main nerves)/main nerves | 1.1±0.7 | 0.5–2.8 | 0.7±0.6 | 0–2 | 0.445 |
| Tortuosity | 1.9±0.3 | 1–2 | 2.0±0.5 | 1–3 | 0.302 |
| Total nerve length (μm/frame) | 2173.1±233.1 | 1612–2442 | 1756.9.±574.6 | 1016–2612 | 0.011b |
| Total nerve density (μm/mm2) | 32 194.3±3453.9 | 23 882–36 178 | 26 971.5±10 526.5 | 15 052–38 697 | |
| Posterior keratocytes (cells per mm2) | 582.7±21.6 | 552–615 | 611.2±23.4 | 580–697 | 0.001b |
| (cells per mm3)c | 22 166±820.8 | 20 978–23 370 | 23 226±889.2 | 22 470–26 486 | |
| Anterior keratocytes (cells per mm2) | 862.1±24.0 | 827–918 | 878.0±26.8 | 836–930 | 0.098 |
| (cells per mm3)c | 32 756±912 | 31 426–34 884 | 33 364±1018.4 | 31 768–35 340 | |
| Superficial epithelial cells (cells per mm2) | 1574.6±57.1 | 1506–1698 | 1494.6±139.6 | 1292–1688 | 0.102 |
| Basal epithelial cells (cells per mm2) | 5524.0±382.5 | 4934–6069 | 5740.6±262.8 | 5381–6442 | 0.062 |
| % of Reflective superficial epithelial cells | 2.7±2.6 | 0–8 | 6.5±5.6 | 1–19 | 0.063 |
| Epithelial cell area (μm2) | 398.9±31.8 | 360–445 | 409.6±60.2 | 327–500 | 0.610 |
Independent sample t-test.
Statistically significant differences given in italics.
The estimated depth of field was calculated by assuming that actual density in the posterior stroma was equal to 22 166 cells per mm3. Volumetric density was recalculated with an estimated depth of field of 38 μm.
Figure 2.
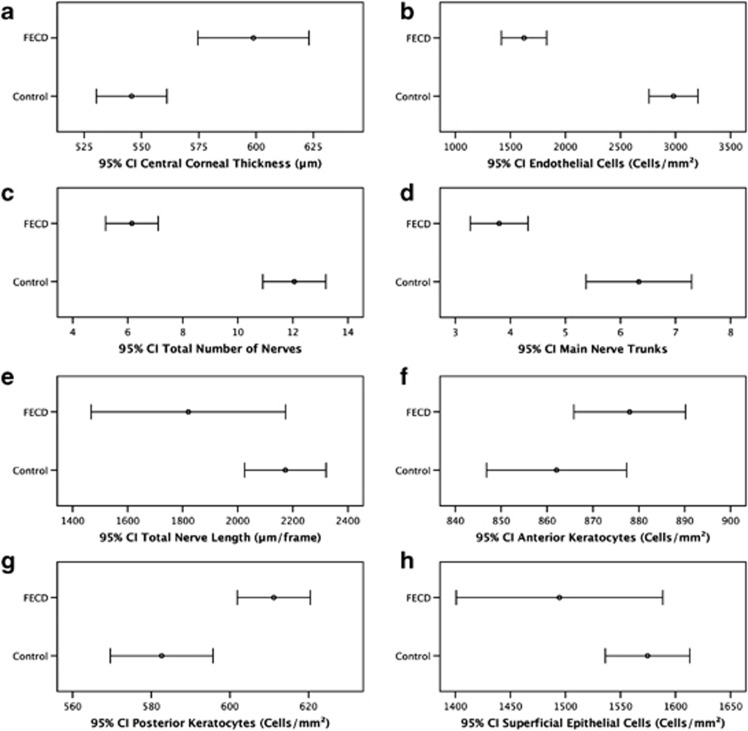
Mean values and 95% confidence intervals for CCT (a), ECD (b), subbasal corneal nerve and cellular parameters comparing healthy controls and FECD patients. Subbasal nerve parameters included total number of nerves (c), main nerve trunks (d), and total nerve length (e). Cellular parameters included anterior (f) and posterior keratocyte (g), and superficial epithelial cell (h) density. ECD could not be assessed in two FECD patients due to severe guttae.
There was a statistically significant reduction in the corneal nerve density and length in FECD patients vs normal controls for total number of nerves (6.2±1.9 vs 12.1±1.9, P<0.001), main nerve trunks (3.8±1.1 vs 6.3±1.5, P<0.001), and total corneal nerve length (1756.9±574.6 vs 2173.1±233.1 μm, P=0.011; Table 2; Figures 2c–e). Tortuosity levels of nerves (2.0±0.5 vs 1.9±0.3, P=0.302) and branching (0.8±1.0 vs 1.1±0.7, P=0.445) were comparable between FECD patients and controls (Table 2).
The density of posterior keratocytes (611.2±23.4 vs 582.7±21.6 cells per mm2, P<0.001) was significantly higher in FECD patients as compared with normal controls. In contrast, the density of anterior keratocytes (878.0±26.8 vs 862.1±24.0 cells per mm2, P=0.098) and superficial epithelial cells (1494.6±139.6 vs 1574.6±57.1 cells per mm2, P=0.102) did not differ significantly between FECD patients and controls (Table 2; Figures 2f–h). The percentage of reflective superficial epithelial cells was higher in FECD patients compared with normals, but did not reach statistical significant levels (6.5±5.6% vs 2.7±2.6%, P=0.063).
Statistically significant correlations were found between CCT and ECD (r=Pearson's correlation coefficient, r=−0,471, P=0.004, Figure 3a), CCT and total number of nerves (r=−0.69, P<0.001, Figure 3b), ECD and total number of nerves (r=0.44, P=0.012, Figure 3c), CCT and main nerve trunks (r=−0.47, P=0.016, Figure 3d), ECD to main nerve trunks (r=0.65, P<0.001, Figure 3e), and between CCT and total nerve length (r=−0.52, P=0.006, Figure 3f). Correlations between ECD to total nerve length (r=0.04, P=0.838) were not statistically significant (Table 3).
Figure 3.
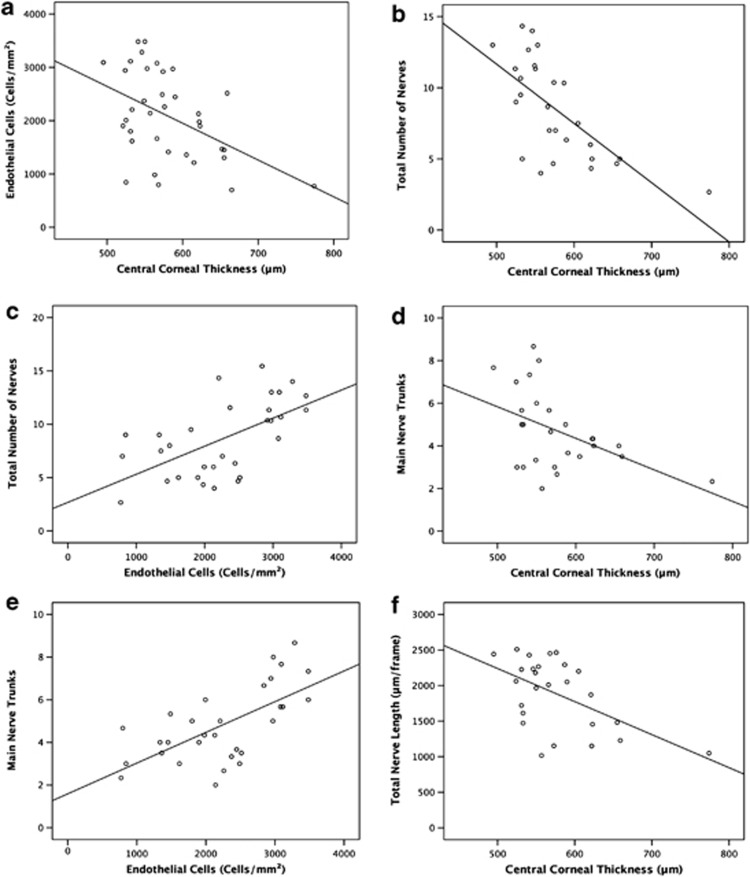
Scatterplots of ECD and CCT by nerve parameters comparing normals and FECD patients. (a) Scatterplot of ECD measured by Confoscan 4 against CCT including linear regression line (r=−0.47). (b) Scatterplot of total number of subbasal corneal nerves against CCT including linear regression line (r=−0.68). (c) Scatterplot of total number of subbasal corneal nerves against ECD including linear regression line (r=0.59). (d) Scatterplot of main nerve trunks of subbasal corneal nerves against CCT including linear regression line (r=−0.47). (e) Scatterplot of main nerve trunks of subbasal corneal nerves against ECD including linear regression line (r=0.65). (f) Scatterplot of total length of subbasal corneal nerves against CCT including linear regression line (r=−0.55).
Table 3. Pearson's correlations for ECD and CCT by nerve parameters.
| r* | P* | r* | P* | ||
|---|---|---|---|---|---|
| ECD vs CCT | −0.47 | 0.004a | |||
| ECD vs total number of nerves | 0.59 | <0.001a | CCT vs total number of nerves | −0.68 | <0.001a |
| ECD vs main nerve trunks | 0.65 | <0.001a | CCT vs main nerve trunks | −0.47 | 0.016a |
| ECD vs total nerve length | 0.18 | 0.335 | CCT vs total nerve length | −0.55 | 0.004a |
r*=Pearson's correlations coefficient.
P*=P-value, correlation is significant, significant values are in italics.
Statistically significant correlations.
Discussion
Specular microscopy has been used to study corneal ECD and to detect morphological changes of the endothelial layer that cannot be seen by slit-lamp biomicroscopy.18 Recently, the introduction of IVCM has enabled microscopical studies of the cornea in patients with FECD,11, 12, 13, 19, 20 although to date, only few IVCM studies have investigated corneal changes in these patients.11, 12, 13 To our knowledge, this study is the first to systematically and quantitatively analyze subbasal corneal nerve alterations in patients with early stage FECD by IVCM. Further, this is the largest study to date analyzing stromal and epithelial cell layers by IVCM in FECD patients.
Previously, Hara et al13 compared results by IVCM (ConfoScan, Tomey, Nagoya, Japan) and non-contact specular microscopy (SP-2000P, Topcon, Tokyo, Japan) in 11 eyes of six patients with FECD. They found IVCM to be superior to non-contact specular microscopy for the assessment of corneas with FECD, as it allowed visualization of endothelial cells, keratocytes, and corneal nerves despite corneal edema. Further, Mustonen et al,12 performed IVCM (ConfoScan P4, Tomey) in 17 eyes of 11 patients with FECD, demonstrating a mean ECD of 1202±850 cells per mm2. Moreover, Hara et al showed a mean ECD of 1471±662 cells per mm2 in patients with FECD. The slightly higher ECD in our study with 1694±549 cells per mm2 is likely due to milder stages of our FECD patients.
Our IVCM data demonstrate that in early stage FECD, in addition to known endothelial cell changes, there are clinically non-apparent alterations of the subbasal nerve plexus, posterior stroma, and the superficial epithelium. Hecker et al20 recently performed a study comparing anterior keratocyte densities between histological sections and tandem Scanning confocal microscopy, demonstrating depletion of keratocytes in the anterior 10% of the stroma in FECD patients requiring penetrating keratoplasty, although Mustonen et al12 did not find significant changes in the density of anterior and posterior keratocytes. In contrast, our study demonstrates a significant increase of posterior keratocyte density and a subtle increase of anterior keratocyte density as compared with normals. The different findings between the studies by Hecker et al, Mustonen et al, and our study, respectively, may be related to the different stages of disease used in theses studies, as Mustonen et al included mild to moderate stages, Hecker et al included late stage FECD and bullous keratopathy and we included only early stages of FECD. Further, these changes could be due to the fact that different confocal machines were used in different studies. It is important to note that due to the fact that corneal edema causes a volumetric tissue expansion and a loss of optical clarity, this may lead to an apparent loss of keratocytes, and thus the keratocyte density in FECD patients could be up to 10% higher than reported.21
The most significant findings of this study were the profound diminishment in total number of nerves, main nerve trunks, and the total nerve length in FECD patients. Similarly, Mustonen et al have previously reported a qualitative decrease of nerves in 8 of 17 eyes. It remains to be determined, whether the reduction of total nerve length and numbers is caused by stromal edema, or is potentially directly involved in the pathophysiology of FECD, a question that cannot be answered by this retrospective study. However, based on the current data, a prospective study is currently underway, comparing patients with FECD and pseudophakic bullous keratopathy, using the Heidelberg Retina Tomograph 3 equipped with Rostock Cornea Module (Heidelberg Engineering GmbH, Dossenheim, Germany). Understanding differences in corneal innervation in these groups may aid in the understanding of the role of corneal nerves in early FECD. Further prospective studies are needed to investigate the correlation of corneal nerve density and function in patients with FECD and other endothelial diseases. It is tempting to speculate that impaired signaling mechanisms between corneal endothelium and corneal nerves could potentially have a role in the pathogenesis of endothelial cells loss and subsequent corneal edema in FECD.
Interestingly, autocrine production of neuropeptides by the corneal endothelium has been reported by Koh and Waschek.22 These authors demonstrated that autocrine production of vasoactive intestinal peptide (VIP) by the corneal endothelium has a protective effect, having an active role in maintaining the differentiated state and suppressing apoptosis in corneal endothelial cells.23, 24 It is conceivable that both corneal endothelial cell loss occurring in FECD or other endothelial diseases, and corneal edema developing in FECD could lead to decreased levels of VIP or other neuropeptides, consequently affecting corneal nerve density and function. Conversely, the loss of corneal nerves could lead to decreased levels of neuropeptides, including VIP, subsequently resulting in endothelial cell apoptosis. The strong correlation between CCT and decrease in corneal nerves supports the potential direct interaction between corneal nerves and the endothelium.
The differences in corneal nerve findings between normal and FECD patients could be slightly overestimated due to the minor age difference between these groups. Although Grupcheva et al24 have demonstrated a decrease in nerve fibre density with age, Erie et al8 did not find a significant correlation between age and subbasal nerve fibre density. A second limitation of this study is that one cannot be certain that measurement of CCT by pachymetry and the area imaged by IVCM took place in the same area. Nevertheless, assessment of both corneal cell and nerve density and morphology might allow elucidation of new mechanisms involved in corneal diseases.
In conclusion, IVCM is a non-invasive tool, allowing detection of clinically non-apparent cellular and nerve changes in early stage FECD. Our IVCM findings demonstrate alterations in corneal innervation in patients with early stage FECD, suggesting that corneal nerve changes may be involved in the pathogenesis of this disease. Further studies are required to investigate whether the reduction in subbasal nerves is caused by nonspecific corneal edema, from FECD-induced decrease in ECD, or potentially leading to loss of endothelial cells.
Acknowledgments
This work was supported by the NIH K12-EY016335, NIH K08-EY020575, New England Corneal Transplant Research Fund, Falk Medical Research Foundation, and an unrestricted grant to the Department of Ophthalmology, Harvard Medical School. The funding organisations had no role in the design or conduct of this research.
The authors declare no conflict of interest.
References
- Adamis AP, Filatov V, Tripathi BJ, Tripathi RC. Fuchs' endothelial dystrophy of the cornea. Surv Ophthalmol. 1993;38:149–168. doi: 10.1016/0039-6257(93)90099-s. [DOI] [PubMed] [Google Scholar]
- Li QJ, Ashraf MF, Shen DF, Green WR, Stark WJ, Chan CC, et al. The role of apoptosis in the pathogenesis of Fuchs endothelial dystrophy of the cornea. Arch Ophthalmol. 2001;119:1597–1604. doi: 10.1001/archopht.119.11.1597. [DOI] [PubMed] [Google Scholar]
- Lemp MA, Dilly PN, Boyde A. Tandem-scanning (confocal) microscopy of the full-thickness cornea. Cornea. 1985–1986;4:205–209. [PubMed] [Google Scholar]
- Cavanagh HD, Petroll WM, Alizadeh H, He YG, McCulley JP, JV Jester. Clinical and diagnostic use of in vivo confocal microscopy in patients with corneal disease. Ophthalmology. 1993;100:1444–1454. doi: 10.1016/s0161-6420(93)31457-0. [DOI] [PubMed] [Google Scholar]
- Auran JD, Koester CJ, Kleiman NJ, Rapaport R, Bomann JS, Wirotsko BM, et al. Scanning slit confocal microscopic observation of cell morphology and movement within the normal human anterior cornea. Ophthalmology. 1995;102:33–41. doi: 10.1016/s0161-6420(95)31057-3. [DOI] [PubMed] [Google Scholar]
- Zhivov A, Stachs O, Kraak R, Stave J, Guthoff RF. In vivo confocal microscopy of the ocular surface. Ocul Surf. 2006;4:81–93. doi: 10.1016/s1542-0124(12)70030-7. [DOI] [PubMed] [Google Scholar]
- Müller LJ, Marfurt CF, Kruse F, Tervo TM. Corneal nerves: Structure, contents and function. Exp Eye Res. 2003;76:521–542. doi: 10.1016/s0014-4835(03)00050-2. [DOI] [PubMed] [Google Scholar]
- Erie JC, McLaren JW, Hodge DO, Bourne WM. The effect of age on the corneal subbasal nerve plexus. Cornea. 2005;24:705–709. doi: 10.1097/01.ico.0000154387.51355.39. [DOI] [PubMed] [Google Scholar]
- Rosenberg ME, Tervo TM, Immonen IJ, Müller LJ, Grönhagen-Riska C, Vesaluoma MH. Corneal structure and sensitivity in type 1 diabetes mellitus. Invest Ophthalmol Vis Sci. 2000;41:2915–2921. [PubMed] [Google Scholar]
- Oliveira-Soto L, Efron N. Morphology of corneal nerves using confocal microscopy. Cornea. 2001;20:374–384. doi: 10.1097/00003226-200105000-00008. [DOI] [PubMed] [Google Scholar]
- Chiou AG, Kaufman SC, Beuerman RW, Ohta T, Soliman H, Kaufman HE. Confocal microscopy in cornea guttata and Fuchs' endothelial dystrophy. Br J Ophthalmol. 1999;83:185–189. doi: 10.1136/bjo.83.2.185. [DOI] [PMC free article] [PubMed] [Google Scholar]
- Mustonen RK, McDonald MB, Srivannaboon S, Tan AL, Doubrava MW, Kim CK. In vivo confocal microscopy of fuchs' endothelial dystrophy. Cornea. 1998;17:493–503. doi: 10.1097/00003226-199809000-00006. [DOI] [PubMed] [Google Scholar]
- Hara M, Morishige N, Chikama T, Nishida T. Comparison of confocal biomicroscopy and noncontact specular microscopy for evaluation of the corneal endothelium. Cornea. 2003;22:512–515. doi: 10.1097/00003226-200308000-00005. [DOI] [PubMed] [Google Scholar]
- McLaren JW, Bourne WM, Patel SV. Automated assessment of keratocyte density in stromal images from the ConfoScan 4 confocal microscope. Invest Ophthalmol Vis Sci. 2010;51:1918–1926. doi: 10.1167/iovs.09-4186. [DOI] [PMC free article] [PubMed] [Google Scholar]
- Wiegand W, Thaer AA, Kroll P, Geyer OC, Garcia AJ. Optical sectioning of the cornea with a new confocal in vivo slit-scanning videomicroscope. Ophthalmology. 1995;102:568–575. doi: 10.1016/s0161-6420(95)30981-5. [DOI] [PubMed] [Google Scholar]
- Calvillo MP, McLaren JW, Hodge DO, Bourne WM. Corneal reinnervation after LASIK: prospective 3-year longitudinal study. Invest Ophthalmol Vis Sci. 2004;45:3991–3996. doi: 10.1167/iovs.04-0561. [DOI] [PubMed] [Google Scholar]
- Hamrah P, Cruzat A, Dastjerdi MH, Zheng L, Shahatit BM, Bayhan HA, et al. Corneal sensation and subbasal nerve alterations in patients with herpes simplex keratitis: an in vivo confocal microscopy study. Ophthalmology. 2010;117:1930–1936. doi: 10.1016/j.ophtha.2010.07.010. [DOI] [PMC free article] [PubMed] [Google Scholar]
- Bourne WM, Kaufman HE. Specular microscopy of human corneal endothelium in vivo. Am J Ophthalmol. 1976;81:319–323. doi: 10.1016/0002-9394(76)90247-6. [DOI] [PubMed] [Google Scholar]
- Kaufman SC, Beuerman RW, Kaufman HE. Diagnosis of advanced Fuchs' endothelial dystrophy with the confocal microscope. Am J Ophthalmol. 1993;116:652–653. doi: 10.1016/s0002-9394(14)73217-9. [DOI] [PubMed] [Google Scholar]
- Hecker LA, McLaren JW, Bachman LA, Patel V. Anterior keratocyte depletion in fuchs endothelial dystrophy. Arch Ophthalmol. 2011;129:555–561. doi: 10.1001/archophthalmol.2010.344. [DOI] [PMC free article] [PubMed] [Google Scholar]
- Efron N, Mutalib HA, Perez-Gomez I, Koh HH. Confocal microscopic observations of the human cornea following overnight contact lens wear. Clin Exp Optom. 2002;85:149–55. doi: 10.1111/j.1444-0938.2002.tb03027.x. [DOI] [PubMed] [Google Scholar]
- Koh SW, Waschek JA. Corneal endothelial cell survival in organ cultures under acute oxidative stress: effect of VIP. Invest Ophthalmol Vis Sci. 2000;41:4085–4092. [PubMed] [Google Scholar]
- Koh SW, Chandrasekara K, Abbondandolo CJ, Coll TJ, AR Rutzen. VIP and VIP gene silencing modulation of differentiation marker N-cadherin and cell shape of corneal endothelium in human corneas ex vivo. Invest Ophthalmol Vis Sci. 2008;49:3491–3498. doi: 10.1167/iovs.07-1543. [DOI] [PMC free article] [PubMed] [Google Scholar]
- Grupcheva CN, Wong T, Riley AF, McGhee CN. Assessing the sub-basal nerve plexus of the living healthy human cornea by in vivo confocal microscopy. Clin Experiment Ophthalmol. 2002;30:187–190. doi: 10.1046/j.1442-9071.2002.00507.x. [DOI] [PubMed] [Google Scholar]