

Abstract
Background
Ghrelin plays a role in appetite and has been hypothesized to play a role in the mechanism of Roux-en-Y gastric bypass (RYGB) surgery. Single nucleotide polymorphisms (SNPs) in the promoter region of its receptor gene (growth hormone secretagogue receptor type 1a—GHSR) have also been associated with weight loss outcomes following long-term dietary intervention in adults with impaired glucose tolerance. Our objectives were to evaluate changes in serum ghrelin levels and determine the effect of GHSR promoter polymorphisms on post-RYGB surgery weight loss.
Methods
Preoperative and 6-month postoperative serum ghrelin levels were measured in 37 patients with extreme obesity undergoing RYGB surgery. Total ghrelin was also measured in liver tissue collected intraoperatively. Association analysis between genotypes for SNPs rs9819506 and rs490683 in the promoter region of the GHSR gene and weight loss outcomes in the 30 months following surgery was performed in over 650 RYGB patients.
Results
Serum ghrelin levels increased after RYGB surgery. Weight loss trajectories were significantly different using an additive model for both ghrelin SNPs, with patients homozygous for the rs490683 CC genotype exhibiting the most weight loss. Weight loss trajectories were also different using a dominant model. The rs490683 risk allele demonstrated decreased promoter activity in vitro.
Conclusions
The role of increased ghrelin levels in weight loss outcomes following RYGB surgery may be influenced by variation in the GHSR gene.
Keywords: Ghrelin, SNP, RYGB, Weight loss
Introduction
Roux-en-Y gastric bypass (RYGB) surgery has emerged as an effective treatment for extreme obesity that ameliorates many related comorbid conditions such as hypertension, sleep apnea, hyperlipidemia, and others [1]. Ghrelin, a 28-amino acid peptide that is secreted primarily from the stomach and proximal small intestine that stimulates appetite and promotes food intake [2], has been hypothesized to play a role in the mechanism of RYGB [3, 4]. Ghrelin is secreted in response to a reduction in gastrointestinal contents and is suppressed by eating [5]. Circulating ghrelin is activated through enzymatic acylation that is essential for binding to its receptor, the growth hormone secretagogue receptor type 1a (GHSR). GHSR is expressed in a wide variety of tissues [6–8]. In human and animal studies, activation of the GHSR receptor through ghrelin binding results in increased food intake and weight gain [9–11].
Ghrelin blood levels are inversely proportional to BMI; obese individuals have lower circulating ghrelin levels [12]. Dietary weight loss substantially elevates ghrelin levels [13] stimulating appetite. Studies of plasma ghrelin levels following RYGB surgery vary, with some showing decreases [14–21], no change [4, 22–31], or increases [32–36] in fasting ghrelin levels. Why the studies vary so widely is not clear, but may relate to technical differences in surgical procedures [37]. Few studies have examined ghrelin levels in other tissues.
Variations in the ghrelin and ghrelin receptor genes have been linked to obesity, eating behavior and appetite, blood triglycerides, fasting insulin, and insulin resistance [38–42]. In particular, two ghrelin receptor promoter single nucleotide polymorphisms (SNPs), rs490683 (GHSR194) and rs9819506 (GHSR288), were correlated with BMI, weight loss during a dietary intervention, and measures of insulin resistance [43]. Differences in ghrelin receptor promoter activity measured in vitro via luciferase assay have been reported [44], which may cause reduced ghrelin activity.
In order to further define the role of ghrelin in RYGB surgery, we measured ghrelin levels in plasma and liver tissue. We also determined the association of two ghrelin receptor promoter SNPs with BMI, the prevalence of comorbid conditions and weight loss following a short-term dietary intervention, and weight loss trajectory post-RYGB surgery. The effect of the SNPs on promoter activity was also measured.
Methods
Patients
A total of 694 individuals who underwent gastric bypass surgery at Geisinger Medical Center, Danville, PA, USA from 2004 to 2010 were consented and enrolled in an institutional review board-approved study investigating predictors of weight loss, metabolic syndrome, and non-alcoholic steatohepatitis (NASH). From the 694 individuals, blood samples for genetic analysis were available from 657 and liver and serum samples for ghrelin protein analysis from 37 (Tables 1 and 2). The 37 patients were stratified into four groups by the presence of type 2 diabetes mellitus (T2D) and non-alcoholic fatty liver disease (NAFLD) activity: presence of T2D (+D) (T2D) and NAFLD (+N) designated as (+D/+N); presence of type 2 diabetes but normal liver (+D/−N); presence of NAFLD but not type 2 diabetes (−D/+N); and absence of both conditions (−D/−N). NAFLD/NASH activity was quantified by using the criteria outlined by Kleiner et al. [45] as part of a clinical evaluation by a pathologist. The classification of the 37 male and female patients was as follows: (+D/+N), n=9; (+D/−N), n=9; (−D/ +N), n=8; and (−D/−N), n=11.
Table 1.
Patient characteristics by T2D and NAFLD diagnosis
| Characteristic | (+D/+N) | (+D/−N) | (−D/+N) | (−D/−N) |
|---|---|---|---|---|
| Age | 47.3±2.7 | 48.0±4.6 | 33.1±4.8 | 42.1±3.7 |
| Number | 7 females | 9 females | 7 females | 11 females |
| BMI (kg/m2) | 49.2±3.0 | 47.5±2.5 | 47.0±2.4 | 46.6±3.2 |
| HbA1c (%) | 7.08±0.25 | 6.47±0.34 | 5.63±0.32* | 5.92±0.19* |
| Glucose (mg/dl) | 146.0±11.6 | 135.4±11.0 | 111.5±7.8 | 119.2±4.5 |
| Insulin (mU/l) | 33.7±8.1 | 19.0±4.5 | 21.6±4.4 | 14.0±1.8* |
| HOMA | 3.5±0.84 | 2.08±0.26 | 2.74±0.55 | 1.81±0.22 |
| Pre-RYGB serum ghrelin (ng/ml) | 2.2±0.57 | 1.9±0.40 | 1.5±0.35 | 1.9±0.41 |
| Post-RYGB serum ghrelin (ng/ml) | 3.3±0.24 | 2.7±0.42 | 2.1±0.29 | 2.9±0.39 |
| Liver total ghrelin (ng/ml) | 1.41±0.07 | 1.50±0.07 | 1.47±0.01 | 1.56±0.04 |
p<0.05, versus the (+D/+N) group
Table 2.
Baseline patient demographics for genetic analysis
| Variable | Females n=535 (81.4 %) | Males n=122 (18.6 %) | p value |
|---|---|---|---|
| Age | 45.5±0.49 | 48.0±1.11 | =0.036* |
| Caucasian | 502 | 111 | |
| African-American | 13 | 3 | |
| Hispanic, mixed | 5 | 4 | |
| Other or unknown | 15 | 4 | |
| BMI | 48.2±0.35 | 50.1±0.76 | =0.018* |
| Type 2 diabetes | 169 (31 %) | 59 (48 %) | =0.002* |
| Glucose (mg/dl) | 104.3±1.8 | 120.1±6.1 | <0.001* |
| Insulin (mU/l) | 22.0±0.9 | 28.5±1.7 | <0.001* |
| HOMA | 6.2±0.4 | 8.7±0.7 | <0.001* |
| HbA1c | 6.2±0.06 | 6.7±0.16 | =0.078 |
HbA1c hemoglobin A1c, HOMA homeostasis model assessment
p<0.05
Liver Ghrelin Analysis
Liver wedge biopsies were obtained during RYGB surgery, cut into two sections for formalin fixation and immediate immersion in liquid nitrogen, and stored at −80°C. Frozen liver tissues (~0.5 g) were mechanically homogenized with 500 μL 1× phosphate buffered saline (PBS) assay buffer containing Complete Mini Protease Inhibitor Cocktail (1 tablet per 3 mL PBS final concentration, 3.5× protease inhibitor, Roche Diagnostics). Buffer solution was free of organic solvents and detergents. Homogenized samples were centrifuged at 14,000 rpm for 10 min and protein-containing supernatant was recovered. Total ghrelin from liver tissue homogenate (with no additional HCl or protease inhibitor) was analyzed in duplicate by ELISA (Human Ghrelin (Total) ELISA, Millipore Corp.) using PBS cocktail as the assay buffer. Sensitivity was determined at 100 pg/ml for des-octanoyl ghrelin in serum.
Blood Ghrelin Analysis
Fasting blood samples from a clinic visit approximately 3 months prior to surgery were available from 30 of 37 patients on whom frozen liver was also available. A second sample was collected at a 5- or 12-month postoperative clinic visit. Whole blood was collected in serum separator tubes (containing no protease inhibitor or HCl). Serum was extracted and stored at −80°C. Pre- and postoperative serum samples were analyzed in duplicate for total ghrelin via ELISA with the same kit specifications as above (Millipore Corp.).
Clinical Measurements
Pre-surgical values for fasting insulin, glucose, and HbA1c were measured using Roche automated clinical chemistry methodology in the Geisinger Clinical laboratory. The homeostasis model assessment (HOMA) was used to assess pancreatic β-cell function, insulin sensitivity, and insulin resistance. The measurement of insulin resistance was calculated by the HOMA calculator, version 2.2 (Diabetes Trial Unit, University of Oxford, UK) using clinical values of fasting insulin (microunits per milliliter) and fasting glucose (milligram per deciliter). This software calculates HOMA for glucose values between 54.1 and 450.5 mg/dl and insulin values between 2.9 and 57.6 μU/ml.
Height and weight were recorded at all clinic visits. Ideal body weight was based on a BMI of 25 kg/m2. Excess body weight was calculated as actual body weight minus ideal body weight; percentage of excess body weight lost was calculated as (weight lost/excess body weight)×100.
DNA Isolation and Genotyping
SNPs at two loci in the promoter region of the ghrelin receptor gene (rs490683 and rs9819506) were selected based on prior reports of significant association with BMI and glucose tolerance during dietary weight loss [43]. DNA was isolated as previously described [46]. Following DNA isolation, samples were genotyped for two ghrelin receptor promoter SNPs, rs490683 and rs9819506, using reagents and protocol provided by Applied Biosystems (rs490683-C__2169194_10 and rs9819506-C__2863288_10).
Promoter Activity Assay
The effects of SNP rs490683 on promoter activity were evaluated by subcloning an insert of 154 nucleotides (nt), encompassing the SNP, into the pGL3-basic luciferase vector as we have previously described [47–49]. The fidelity of the DNA sequence and the presence of the two different genotypes were confirmed by sequencing. The mouse adult hypothalamic cell line, A2/12 (Cellutions Biosystems, Inc.), was used for transient transfections which were performed by electroporation as we have previously described [49]. After overnight incubation, cells were harvested and luciferase activity was measured and adjusted as we have previously described [49]. The data shown represent six replicate measurements from two independent experiments.
Statistics
Data were analyzed using SPSS Statistics 17.0 (IBM) and SAS v9.2 (SAS). Normality was assessed and non-parametric tests were applied as appropriate. Baseline patient characteristics were compared using chi-square tests, two-sample t tests, and ANOVA, where appropriate. Pre- and postsurgical values were evaluated using paired t tests and the post hoc Student–Newman–Keuls was employed for multiple comparisons after ANOVA, unless otherwise noted. Linear mixed regression models with a random intercept were used to determine whether dietary weight loss and postoperative weight loss were associated with SNP genotype. Statistical models were conducted by using allelic status (dominant and recessive models). For each subject, multiple weight measures from pre- and postsurgery were included in the model. The dependent variable was percent of excess body weight loss. The independent variables, chosen to enable a flexible, nonlinear shape to the weight loss curve, were the continuous variable for time from surgery (including quadratic and cubic terms), indicator variables for each genetic group, and an indicator variable for whether the measure was before or after surgery. All two- and three-way interactions were tested and retained when significant. The parameter estimates from final models were used to create weight loss curves for each genotype group. Significance was set at p<0.05 and values are reported as mean±standard error of the mean, unless otherwise indicated.
Results
Serum and Liver Ghrelin
Pre- and post-RYGB serum samples were available from 37 patients for ghrelin analysis. Analysis of demographic data showed significant sex differences for age and presurgical HbA1c (Supplemental Table 1) so the results from the three males were excluded. Initial analyses compared those with type 2 diabetes to those without and those with NAFLD to those with normal liver histology. Each of the four individual groups was then analyzed for differences against the others. Patients without T2D were significantly younger than those with T2D and those with T2D had higher presurgical glucose, insulin, and HOMA levels, consistent with type 2 diabetes (Table 1).
Neither pre-RYGB (mean time before surgery 3.9± 0.5 months, range 0.5–10 months) nor post-RYGB (mean measurement time postsurgery 5.9±0.4 months, range 4.5–12 months) total serum ghrelin levels differed by T2D or NAFLD status, nor among the four individual diabetic and NAFLD groups (Fig. 1). However, post-RYGB surgery total serum ghrelin levels (Fig. 1) were significantly higher than presurgical levels in all patients (postsurgery, 2.7±0.20 ng/ ml vs. presurgery, 1.8±0.20 ng/ml, p=0.004). Serum ghrelin levels were also higher post-RYGB surgery in patients with or without T2D or NAFLD. Liver ghrelin levels also did not significantly differ by group (Supplemental Fig. 1).
Fig. 1.
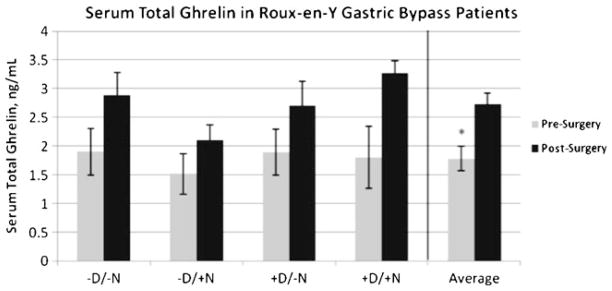
Serum total ghrelin levels pre- and post-RYGB surgery. There were no differences between groups at either pre- or post-RYGB. Postsurgical serum ghrelin levels were significantly higher than pre-surgical levels; n=4–8/group/ timepoint; *p<0.05
Genetic Association Analyses
Association analysis of two GHSR promoter SNPs (rs490683 and rs9819506) with weight loss was performed in 657 subjects (Table 2). The 657 subjects had a total of 12,612 weight (and therefore BMI) measurements (mean of 19.2 per patient). Genotyping was successful in 94 % of patients (617 out of 657) for rs490683 and in 96 % (633 of 657) of patients for rs9818506. The genotype frequencies (Table 3) were consistent with HapMap data. Both loci were in Hardy–Weinberg equilibrium (p>0.05). Significant sex differences were observed for age, baseline BMI, percentage with type 2 diabetes, and presurgical glucose, insulin, and HOMA (Table 2). However, neither gender nor any of these variables were significantly associated with either of the GHSR promoter SNPs (additive model p values were all>0.05). Both sexes were therefore included in the weight loss analyses.
Table 3.
Frequency of GHSR promoter SNPs rs490683 and rs9819506
| Allele | rs480683 (GHSR194) | rs9819506 (GHSR288) |
|---|---|---|
| Major/major | G/G=0.51 (n=335) | C/C=0.47 (n=312) |
| Major/minor | G/C=0.36 (n=235) | C/T=0.40 (n=266) |
| Minor/minor | C/C=0.07 (n=47) | T/T=0.08 (n=55) |
| Undetermined | 0.06 | 0.04 |
Linear mixed modeling of weight loss during a dietary pre-RYGB weight loss program as well as weight loss following RYGB surgery was performed using additive, recessive, and dominant models. The weight loss curves using an additive model were significantly different for both SNPs (Fig. 2), with patients homozygous for the rs490683 (GHSR194) CC genotype exhibiting the most weight loss. Weight loss trajectories were also different using a dominant model (Fig. 3). With this genetic model, the rs9819506 (GHSR288) SNP minor (T) allele was associated with more weight loss. Using a recessive model, the weight loss curves for the rs9819506 (GHSR288) SNP were not significantly different (Supplemental Fig. 2).
Fig. 2.
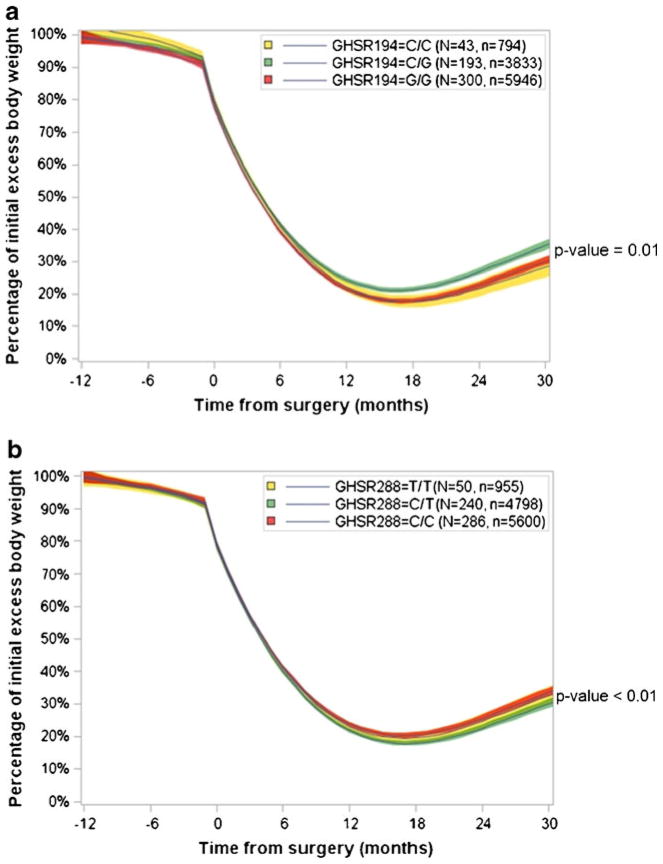
Linear mixed modeling of weight loss by individual rs490683 (GHSR194) and rs9819506 (GSHR288) genotypes in the 30 months following RYGB surgery. a Using an additive model, significant differences in weight loss trajectories were present among the three genotype groups for rs490683 (p=0.011). b Using an additive model, significant differences in weight loss trajectories were present among the three genotype groups for rs9819506 (p<0.0001). N=number of patients in analysis; n=total number of BMI measurements
Fig. 3.
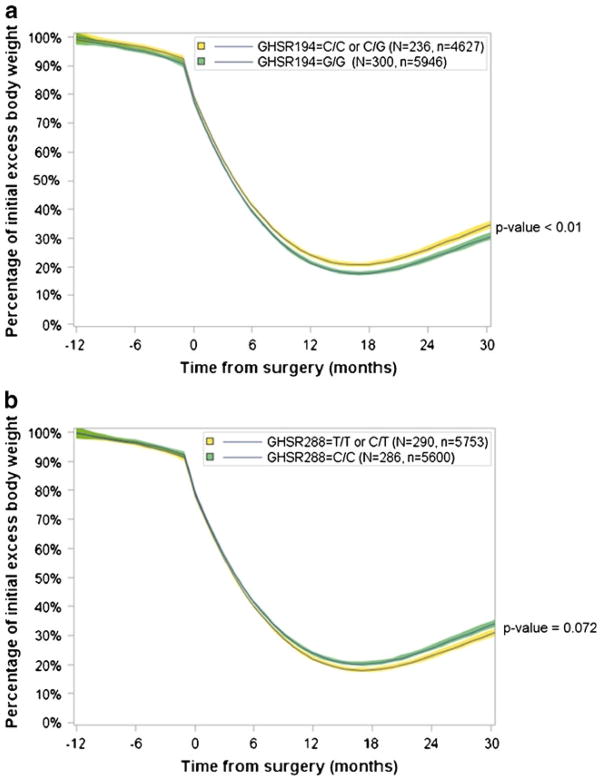
Linear mixed modeling of weight loss using a dominant genetic model for rs490683 (GHSR194) and rs9819506 (GSHR288) in the 30 months following RYGB surgery. a Significant differences in weight loss trajectories were present in the patients who carried the minor allele for rs490683 (p<0.0097). b Significant differences in weight loss trajectories were present in the patients who carried the minor allele for rs9819506 (p<0.0072)
Promoter Activity
The ghrelin receptor SNPs analyzed are located in the 5′ promoter region of the gene. We selected the rs490683 SNP to analyze for impact on promoter activity in vitro based upon the association with weight trajectories after RYGB surgery. The rs490683 C/C genotype had a 20 % (Fig. 4) lower (p=0.055) luciferase activity in the adult hypothalamic A2/12 cell line compared to the G/G genotype. Bioinformatic modeling of the region encompassing the SNP showed that substitution of the “G” allele by the “C” results in a change of the recognition site for the potential binding of transcription factors from ARP-1 to ELK-1 and from H4TF2 to NF1/L.
Fig. 4.
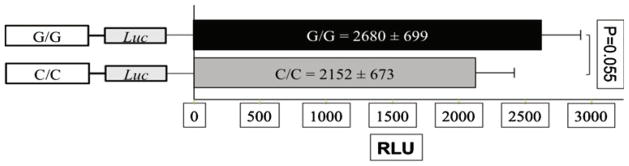
Effects of SNP genotype on ghrelin receptor gene promoter activity. The C/C genotype of the rs490683 SNP decreased promoter activity by approximately 20 %. The data shown represent the means of three independent experiments using six replicates per genotype per experiment (RLU relative luciferase light units, adjusted by the light units of the pGL3-basic control plasmid)
Discussion
Previous studies on the effects of RYGB surgery on fasting serum ghrelin levels in patients with extreme obesity have been mixed. An initial study by Cummings and colleagues reported a decrease in plasma ghrelin levels 6 months after RYGB surgery [37, 50]. Other studies replicated decreased fasting ghrelin levels post-RYGB surgery [14–21], but others reported no change [4, 22–31] or significant increases in postsurgical ghrelin levels [32–36]. One study demonstrated ghrelin levels decreased immediately after surgery, returned to preoperative levels by 1 month postsurgery, and were further elevated after 12 months [34]. Differences in response may be related to variations in surgical technique such as the conformation and size of the remaining stomach pouch, variations in technical aspects of ghrelin assay measurements, and effects of plasma insulin on the regulation of ghrelin [37]. Disruptions in vagus nerve signaling during surgery may also affect postsurgical ghrelin levels. The RYGB surgical procedure on whom we obtained serum levels was standardized for all patients, eliminating this as a variable for this study. In addition to differences in surgical technique, the stability of body weight, i.e., state of energy balance, may also affect ghrelin plasma levels after RYGB. We found that ghrelin levels increased after surgery at a time when patients are still in the phase of moderate weight loss, consistent with ghrelin’s function as an appetite stimulant, at levels that were comparable to values obtained for similar populations [32].
Although liver has not been identified as a major location of ghrelin action, both receptor subtypes 1a and 1b are expressed in liver tissue and ghrelin has direct actions on insulin, TNF-α, and IL-6 [8, 51, 52]. We found that total ghrelin levels in liver were similar to those found in serum. Whether ghrelin serves an autocrine function in the liver or our results merely reflect the high vascularity and blood content of the liver is not known. Interestingly, we found no relationship between ghrelin (liver or serum), leptin, IL-6, or TNF-α levels with NAFLD or type 2 diabetes mellitus. Leptin, TNF-α, and IL-6 have been hypothesized to be involved in the development of insulin resistance and NAFLD and increase with increased severity of insulin resistance and type 2 diabetes [53, 54]. Our results are based on a population with extreme obesity; thus, the degree of fat mass that contributes to the metabolism of these cytokines may obscure otherwise detectable differences in leaner populations.
We found significant associations between ghrelin receptor SNPs rs9819506 and rs490683 and the trajectory of weight loss in the first 30 months following RYGB surgery using linear mixed modeling with more than 10,000 BMI measurements from 657 patients of mixed European ancestry. Previously, an association was reported between the C/C genotype of rs490683 and weight loss during a 3-year dietary intervention in a study of 507 Finns with impaired glucose tolerance [43]. Our data indicate that RYGB patients who were the C/C genotype at this locus lost about 5 % more excess body weight than patients who did not carry this genotype, whereas C/C patients lost 1–3 % more body weight in the Finnish lifestyle study. The higher weight loss induced by the RYGB surgery may be related to the relative effectiveness of the two interventions. We also found that patients who carried the C/C genotype at rs9819506 lost slightly less weight, whereas no significant difference in weight loss was found in the Finnish study at this locus. Moreover, functional analysis of SNP rs490683 in an adult mouse hypothalamic cell line showed that the homozygous C/C genotype attenuated activity of the promoter by approximately 20 %. This could lead to reduction of expression levels of GHSR1 that may lower the net signaling from ghrelin binding, decreasing appetite resulting in weight loss, countering the increase in ghrelin levels that occurs following RYGB surgery allowing individuals with these genotypes to achieve more favorable weight loss outcomes.
The mechanism by which the lowered transcriptional activity occurs is suggested by the alteration of consensus transcription factor binding sites by the rs490683 C/C genotype. Previous functional studies using gel-shift assays and rat hypothalamic nuclear extracts showed that the “C” allele was associated with a sevenfold attenuation in binding affinity, possibly due to the disruption of a putative binding site for the nuclear factor-1 transcription factor [43]. This is consistent with our functional analysis of the same SNP, whereby the “C” allele reduced promoter activity in mouse clonal hypothalamic cells. Furthermore, we also found that the minor allele at locus rs9819506 was associated with more weight loss after RYGB surgery. The favorable genotype at these two ghrelin receptor promoter loci may provide part of the mechanism for variation in weight loss and weight maintenance in patients undergoing RYGB surgery.
Supplementary Material
Acknowledgments
This work was supported by funds from Geisinger Clinic, the Weis Center for Research, and the Geisinger Obesity Research Institute and grants DK072488 (GSG and CDS) and DK088231 (GSG) from the NIH. We thank Ms. Christina Manney for her assistance with sample collection, data management, and patient access, and Ms. Amanda Stayer for excellent technical assistance with the promoter SNP analyses and luciferase experiments. We gratefully acknowledge the extraordinary cooperation and support of the patients enrolled in the Geisinger Bariatric surgery program without which this study would not have been possible.
Footnotes
Electronic supplementary material The online version of this article (doi:10.1007/s11695-012-0631-2) contains supplementary material, which is available to authorized users.
Conflict of Interest Co-author Christopher Still received grant and consulting support from Ethicon-Endosurgery. All the other authors have declared to have no conflicts of interest.
Contributor Information
Michelle E. Matzko, Obesity Institute, Geisinger Clinic, 100 N. Academy Ave., Danville, PA 17822-2130, USA. Department of Biobehavioral Health, The Pennsylvania State University, University Park, PA, USA
George Argyropoulos, Obesity Institute, Geisinger Clinic, 100 N. Academy Ave., Danville, PA 17822-2130, USA. Weis Center for Research, Geisinger Clinic, 100 N. Academy Ave., Danville, PA 17822-2130, USA.
G. Craig Wood, Obesity Institute, Geisinger Clinic, 100 N. Academy Ave., Danville, PA 17822-2130, USA. Center for Health Research, Geisinger Clinic, Danville, PA, USA.
Xin Chu, Obesity Institute, Geisinger Clinic, 100 N. Academy Ave., Danville, PA 17822-2130, USA. Weis Center for Research, Geisinger Clinic, 100 N. Academy Ave., Danville, PA 17822-2130, USA.
Roger J. M. McCarter, Department of Biobehavioral Health, The Pennsylvania State University, University Park, PA, USA
Christopher D. Still, Obesity Institute, Geisinger Clinic, 100 N. Academy Ave., Danville, PA 17822-2130, USA
Glenn S. Gerhard, Email: gsgerhard@geisinger.edu, Obesity Institute, Geisinger Clinic, 100 N. Academy Ave., Danville, PA 17822-2130, USA. Weis Center for Research, Geisinger Clinic, 100 N. Academy Ave., Danville, PA 17822-2130, USA
References
- 1.NIH NOEI: Clinical guidelines on the identification, evaluation, and treatment of overweight and obesity in adults. Bethesda: US Department of Health and Human Services; 1998. [Google Scholar]
- 2.Asakawa A, Inui A, Kaga O, et al. Ghrelin is an appetite-stimulatory signal from stomach with structural resemblance to motilin. Gastroenterology. 2001;120:337–45. doi: 10.1053/gast.2001.22158. [DOI] [PubMed] [Google Scholar]
- 3.Borg C, Le Roux C, Ghatei M, et al. Progressive rise in gut hormone levels after Roux-en-Y gastric bypass suggests gut adaptation and explains altered satiety. Br J Surg. 2005;93:210–5. doi: 10.1002/bjs.5227. [DOI] [PubMed] [Google Scholar]
- 4.Karamanakos SN, Vagenas K, Kalfarentzos F, et al. Weight loss, appetite suppression, and changes in fasting and postprandial ghrelin and peptide-YY levels after Roux-en-Y gastric bypass and sleeve gastrectomy: a prospective, double blind study. Ann Surg. 2008;247:401–7. doi: 10.1097/SLA.0b013e318156f012. [DOI] [PubMed] [Google Scholar]
- 5.Cummings D, Purnell J, Frayo R, et al. A pre-prandial rise in plasma ghrelin levels suggests a role in meal initiation in humans. Diabetes. 2001;50:1714–9. doi: 10.2337/diabetes.50.8.1714. [DOI] [PubMed] [Google Scholar]
- 6.Guan X, Yu H, Palyha O, et al. Distribution of mRNA encoding the growth hormone secretagogue receptor in brain and peripheral tissues. Mol Brain Res. 1997;48:23–9. doi: 10.1016/s0169-328x(97)00071-5. [DOI] [PubMed] [Google Scholar]
- 7.Howard A, Feighner S, Cully D, et al. A receptor in the pituitary and hypothalamus that functions in growth hormone release. Science. 1996;273 doi: 10.1126/science.273.5277.974. [DOI] [PubMed] [Google Scholar]
- 8.Gnanapavan S, Kola B, Bustin S, et al. The tissue distribution of the mRNA of ghrelin and subtypes of its receptor, GHSR1, in humans. J Clin Endocrin Metab. 2002;87:2988. doi: 10.1210/jcem.87.6.8739. [DOI] [PubMed] [Google Scholar]
- 9.Sun Y, Wang P, Zheng H, et al. Ghrelin stimulation of growth hormone release and appetite is mediated through the growth hormone secretagogue receptor. Proc Natl Acad Sci USA. 2004;101:4679–84. doi: 10.1073/pnas.0305930101. [DOI] [PMC free article] [PubMed] [Google Scholar]
- 10.Tschoep M, Smiley D, Heiman M. Ghrelin induces adiposity in rodents. Nature. 2000;407:908–13. doi: 10.1038/35038090. [DOI] [PubMed] [Google Scholar]
- 11.Wren A, Seal L, Cohen M, et al. Ghrelin enhances appetite and increases food intake in humans. J Clin Endocrinol Metab. 2001;86:5992–5. doi: 10.1210/jcem.86.12.8111. [DOI] [PubMed] [Google Scholar]
- 12.Muccioli G, Tschöp M, Papotti M, et al. Neuroendocrine and peripheral activitiies of ghrelin: implications in metabolism and obesity. Eur J Pharmacology. 2002;440:235–54. doi: 10.1016/s0014-2999(02)01432-2. [DOI] [PubMed] [Google Scholar]
- 13.Angulo P. Nonalcoholic fatty liver disease. N Engl J Med. 2002;346 doi: 10.1056/NEJMra011775. [DOI] [PubMed] [Google Scholar]
- 14.Morinigo R, Casamitjana V. Moize Vea. Short-term effects of gastric bypass surgery on circulating ghrelin levels. Obesity Research. 2004;12:1108–16. doi: 10.1038/oby.2004.139. [DOI] [PubMed] [Google Scholar]
- 15.Leonetti F, Silecchia G. Different plasma ghrelin levels after laproscopic gastric bypass and adjustable gastric banding in morbid obese subjects. Clin Endocrin Metab. 2003;88:4227–31. doi: 10.1210/jc.2003-030133. [DOI] [PubMed] [Google Scholar]
- 16.Lin E, Gletsu N, Fugate K. The effects of gastric surgery on systemic ghrelin levels in the morbidly obese. Arch Surg. 2004;139:780–4. doi: 10.1001/archsurg.139.7.780. [DOI] [PubMed] [Google Scholar]
- 17.Fruehbeck G, Rotellar F. Hernandez-Lizoain Jea. Fasting plasma ghrelin concentrations 6 months after gastric bypass are not determined by weight loss of changes in insulinemia. Obes Surg. 2004;14:1208–15. doi: 10.1381/0960892042386904. [DOI] [PubMed] [Google Scholar]
- 18.Geloneze B, Tambascia M, Pilla V, et al. Ghrelin: a gut-brain hormone. Effect of gastric bypass surgery. Obes Surg. 2003;13:17–22. doi: 10.1381/096089203321136539. [DOI] [PubMed] [Google Scholar]
- 19.Tritos N, Mun E, Bertkau A, et al. Serum ghrelin levels in response to glucose load in obese subjects post-gastric bypass surgery. Obes Res. 2003;11:919–24. doi: 10.1038/oby.2003.126. [DOI] [PubMed] [Google Scholar]
- 20.Rodieux F, Giusti V, D’Alessio D, et al. Effects of gastric bypass and gastric banding on glucose kinetics and gut hormone release. Obesity. 2008;16:298–305. doi: 10.1038/oby.2007.83. [DOI] [PubMed] [Google Scholar]
- 21.Foschi D, Corsi F, Colombo F, et al. Different effects of vertical banded gastroplasty and Roux-en-Y gastric bypass on meal inhibition of ghrelin secretion in morbidly obese patients. J Investigative Surgery. 2008;21:77–81. doi: 10.1080/08941930701883624. [DOI] [PubMed] [Google Scholar]
- 22.Le Roux C, Aylwin J, Batterham R. Gut hormone profiles following bariatric surgery favor an anorectic state, facilitate weight loss, and improve metabolic paramters. Ann Surg. 2006;243:108–14. doi: 10.1097/01.sla.0000183349.16877.84. [DOI] [PMC free article] [PubMed] [Google Scholar]
- 23.Le Roux CW, Welbourn R. Werling Mea. Gut hormones as mediators of appetite and weight loss after Roux-en-Y gastric bypass. Ann Surg. 2007;246:780–5. doi: 10.1097/SLA.0b013e3180caa3e3. [DOI] [PubMed] [Google Scholar]
- 24.Faraj M, Havel P, Phelis S, et al. Plasma acylation-stimulating protein, adiponectin, leptin, and ghrelin before and after weight loss induced by gastric bypass surgery in morbidly obese subjects. J Clin Endocrin Metab. 2003;88:1594–692. doi: 10.1210/jc.2002-021309. [DOI] [PubMed] [Google Scholar]
- 25.Korner J, Bessler M, Cirilo LJ, et al. Effects of Roux-en-Y gastric bypass surgery on fasting and post-prandial concentrations of plasma ghrelin, peptide YY, and insulin. J Clin Endocrin Metab. 2005;90:359–65. doi: 10.1210/jc.2004-1076. [DOI] [PubMed] [Google Scholar]
- 26.Korner J, Inabnet W, Febres G. Prospective study of gut hormone and metabolic changes after adjustable gastric banding and Roux-en-Y gastric bypass. Int J Obes. 2009;33:786–95. doi: 10.1038/ijo.2009.79. [DOI] [PMC free article] [PubMed] [Google Scholar]
- 27.Stoeckli R, Clianda R, Langer I, et al. Change of body weight and plasma ghrelin levels after gastric banding and gastric bypass. Obes Res. 2004;12:346–50. doi: 10.1038/oby.2004.43. [DOI] [PubMed] [Google Scholar]
- 28.Couce M, Cottam D, Esplen J, et al. Is ghrelin the culprit for weight loss after gastric bypass surgery? A negative answer. Obes Surg. 2006;16:870–8. doi: 10.1381/096089206777822151. [DOI] [PubMed] [Google Scholar]
- 29.Whitson B, Leslie D, Kellogg T, et al. Enteroendocrine changes after gastric bypass in diabetic and nondiabetic patients: a preliminary study. J Surgical Research. 2007;141:31–9. doi: 10.1016/j.jss.2007.02.022. [DOI] [PubMed] [Google Scholar]
- 30.Liou J-M, Lin J-T, Lee W-J, et al. The serial changes of ghrelin and leptin levels and their relations to weight loss after laparoscopic minigastric bypass surgery. Obes Surg. 2008;18:84–9. doi: 10.1007/s11695-007-9305-x. [DOI] [PubMed] [Google Scholar]
- 31.Olivan B, Teixeira J, Bose M, et al. Effect of weight loss by diet or gastric bypass surgery on peptide YY3–36 levels. Ann Surg. 2009;249:948–53. doi: 10.1097/SLA.0b013e3181a6cdb0. [DOI] [PMC free article] [PubMed] [Google Scholar]
- 32.Vendrell J, Broch M, Vilarrasa N. Resistin, adiponectin, ghrelin, leptin, and proinflammatory cytokines: relationships in obesity. Obes Res. 2004;12:962–71. doi: 10.1038/oby.2004.118. [DOI] [PubMed] [Google Scholar]
- 33.Holdstock C, Engstrom B, Ohrvall M, et al. Ghrelin and adipose tissue regulatory peptides: effect of gastric bypass sugery in obese humans. J Clin Endocrinol Metab. 2003;88:3177–83. doi: 10.1210/jc.2002-021734. [DOI] [PubMed] [Google Scholar]
- 34.Sundbom M, Holdstock C, Engstrom B, et al. Early changes in ghrelin following Roux-en-Y gastric byapass: influence of vagal nerve functionality? Obes Surg. 2007;17:304–10. doi: 10.1007/s11695-007-9056-8. [DOI] [PubMed] [Google Scholar]
- 35.Ybarra J, Bobbioni-Harsch E, Chassot G. Presistent correlation of ghrelin plasma levels with body mass index both in stable weight conditions and during gastric bypass-induced weight loss. Obes Surg. 2009;19:327–31. doi: 10.1007/s11695-008-9748-8. [DOI] [PubMed] [Google Scholar]
- 36.Garcia-Fuentes E, Garrido-Sanchez L, Garcia-Almeida J, et al. Different effect of laparoscopic Roux-en-Y gastric bypass and open biliopancreatic diversion of Scopinaro on serum PYY and ghrelin levels. Obes Surg. 2008;18:1424–9. doi: 10.1007/s11695-008-9560-5. [DOI] [PubMed] [Google Scholar]
- 37.Pournaras DJ, le Roux CW. Ghrelin and metabolic surgery. Int J Pept. 2012:217267. doi: 10.1155/2010/217267. pii. [DOI] [PMC free article] [PubMed] [Google Scholar]
- 38.Baessler A, Fisher M, Mayer B, et al. Epistatic interaction between haplotypes of the ghrelin ligand and receptor genes influence susceptibility to myocardial infarction and coronary artery disease. Human Molec Genet. 2007;16:887–99. doi: 10.1093/hmg/ddm033. [DOI] [PubMed] [Google Scholar]
- 39.Zavarella S, Petrone A, Zampetti S, et al. A new variation in the promoter region, the −604 C>T and the Leu72Met polymorphism of the ghrelin gene are associated with the protection to insulin resistance. Int J Obes. 2008;32:663–8. doi: 10.1038/sj.ijo.0803766. [DOI] [PubMed] [Google Scholar]
- 40.den Hoed M, Smeets A, Veldhorst M, et al. SNP analyses of postprandial responses in (an)orexigenic hormones and feelings of hunger reveal long-term physiological adaptations to facilitate homeostasis. Int J Obes (Lond) 2008;32:1790–8. doi: 10.1038/ijo.2008.195. [DOI] [PubMed] [Google Scholar]
- 41.Baessler A, Hasinoff M, Fischer M, et al. Genetic linkage and association of the growth hormone secretagogue receptor (ghrelin receptor) gene in human obesity. Diabetes. 2005;54:259–67. doi: 10.2337/diabetes.54.1.259. [DOI] [PMC free article] [PubMed] [Google Scholar]
- 42.Vartiainen J, Kesaniemi Y, Ukkola O. Sequencing analysis of the ghrelin gene 5′ flanking region: relations between the sequence variants, fasting plasma total ghrelin concentrations, and body mass index. Metabolism Clinical and Experimental. 2006;55:1420–5. doi: 10.1016/j.metabol.2006.06.014. [DOI] [PubMed] [Google Scholar]
- 43.Mager U, Degenhardt T, Pulkkinen L, et al. Variations in the ghrelin receptor gene associate with obesity and glucose metabolism in individuals with impaired glucose tolerance. PLoS One. 2008;3:e2941. doi: 10.1371/journal.pone.0002941. [DOI] [PMC free article] [PubMed] [Google Scholar]
- 44.Gueorguiev M, Lecoeur C, Meyre D, et al. Association studies on ghrelin and ghrelin receptor gene polymorphisms with obesity. Obesity (Silver Spring) 2009;17:745–54. doi: 10.1038/oby.2008.589. [DOI] [PubMed] [Google Scholar]
- 45.Kleiner D, Brunt EM, Van Natta M, et al. Design and validation of a histological scoring system for nonalcoholic fatty liver disease. Hepatology. 2005;41:1313–21. doi: 10.1002/hep.20701. [DOI] [PubMed] [Google Scholar]
- 46.Chu X, Erdman R, Susek M, et al. Association of morbid obesity with FTO and INSIG2 allelic variants. Arch Surg. 2008;143:235–40. doi: 10.1001/archsurg.2007.77. [DOI] [PubMed] [Google Scholar]
- 47.Argyropoulos G, Rankinen T, Bai F, et al. The agouti-related protein and body fatness in humans. Int J Obes. 2003;27:276–80. doi: 10.1038/sj.ijo.802201. [DOI] [PubMed] [Google Scholar]
- 48.Bai F, Rankinen T, Charbonneau C, et al. Functional dimorphism of two hAgRP promoter SNPs in linkage disequillibrium. J Med Genet. 2004;41:350–3. doi: 10.1136/jmg.2003.014092. [DOI] [PMC free article] [PubMed] [Google Scholar]
- 49.Ilnytska O, Stutz A, Park-York M, et al. Molecular mechanisms for activation of the agouti-related protein and stimulation of appetite. Diabetes. 2011;60:97–106. doi: 10.2337/db10-0172. [DOI] [PMC free article] [PubMed] [Google Scholar]
- 50.Cummings D, Weigle D, Frayo R, et al. Plasma ghrelin levels after diet-induced weight loss or gastric bypass surgery. N Engl J Med. 2002;346:1623–30. doi: 10.1056/NEJMoa012908. [DOI] [PubMed] [Google Scholar]
- 51.Kiewiet R, van Aken M, van der Weerd K, et al. Effects of acute administration of acylated and unacylated ghrelin on glucose and insulin concentrations in morbidly obese subjects without overt diabetes. Eur J Endocrinol. 2009;161:567–73. doi: 10.1530/EJE-09-0339. [DOI] [PubMed] [Google Scholar]
- 52.Dezaki K, Kakei M, Yada T. Ghrelin employs Gai2 and activates Kv channels to attenuate glucose-induced Ca2+ signaling and insulin resistance in islet B-cells: novel signal transduction of ghrelin. Diabetes. 2007;56:2319–27. doi: 10.2337/db07-0345. [DOI] [PubMed] [Google Scholar]
- 53.Leclercq I, Da Silva I, Morais A, et al. Insulin resistance in hepatocytes and siusoidal liver cells: mechanisms and consequences. J Hepatol. 2007;47:142–56. doi: 10.1016/j.jhep.2007.04.002. [DOI] [PubMed] [Google Scholar]
- 54.Pittas A, Joseph N, Greenberg A. Adipocytokines and insulin resistance. J Clin Endocrin Metab. 2004;89:447–52. doi: 10.1210/jc.2003-031005. [DOI] [PubMed] [Google Scholar]
Associated Data
This section collects any data citations, data availability statements, or supplementary materials included in this article.