

Abstract
We presented optic flow simulating eight directions of self-movement in the ground plane, while monkeys performed delayed match-to-sample tasks, and we recorded dorsal medial superior temporal (MSTd) neuronal activity. Randomly selected sample headings yield smaller test responses to the neuron's preferred heading when it is near the sample's heading direction and larger test responses to the preferred heading when it is far from the sample's heading. Limiting test stimuli to matching or opposite headings suppresses responses to preferred stimuli in both test conditions, whereas focusing on each neuron's preferred vs. antipreferred stimuli enhances responses to the antipreferred stimulus. Match vs. opposite paradigms create bimodal heading profiles shaped by interactions with late delay-period activity. We conclude that task contingencies, determining the prior probabilities of specific stimuli, interact with the monkeys' perceptual strategy for optic flow analysis. These influences shape attentional and working memory effects on the heading direction selectivities and preferences of MSTd neurons.
Keywords: optic flow, visual motion, extrastriate, cortex
neurons in dorsal medial superior temporal cortex (MSTd) selectively respond to the radial motion patterns of optic flow (Duffy and Wurtz 1991; Lappe et al. 1996; Saito et al. 1986) to encode the real-world heading of self-movement (Bremmer et al. 2010; Duffy and Wurtz 1995). The additional responsiveness of MSTd to object motion, simulating landmarks seen in passing (Logan et al. 2006), and to vestibular signals about self-movement (Duffy 1998; Gu et al. 2007) makes it well suited to a role in the perception (Heuer and Britten 2004) and control (Merchant et al. 2001) of self-movement.
Task modulation of neuronal responses to visual motion stimuli has been seen throughout dorsal extrastriate cortex and has generally been viewed as modulating the overall magnitude of responses (Martinez Trujillo and Treue 2004; Treue and Maunsell 1996). We previously found that task effects on the optic flow responses of MSTd combine magnitude and selectivity changes in a manner that depends on task demands (Dubin and Duffy 2007; Page and Duffy 2008). These effects include the dynamic selection and rejection of responsiveness to naturalistically superimposed optic flow and object motion cues, depending on which cue is needed to control steering toward a designated goal (Kishore et al. 2011).
During ambulatory navigation, heading changes define a path through the environment and activate path-selective MSTd neurons (Froehler and Duffy 2002). When it counts the most, optic flow analysis must rapidly render the detection of heading changes to support the feedback control of self-movement (Egger et al. 2010). In the current studies, we presented rapidly changing headings in a series of two alternative forced-choice delayed match-to-sample paradigms (2AFC-DMS) to determine how MSTd neurons respond under such naturalistically demanding circumstances.
We hypothesized that 2AFC-DMS task contingencies—the prior probabilities of individual stimuli in the sample and test intervals—can alter the responses of MSTd neurons, affecting which headings they prefer and the strength of those preferences. We find that the detailed structure of 2AFC-DMS tasks changes neuronal response profiles, potentially altering optic flow processing to suit the prior probability of particular upcoming stimuli in a manner that depends on each monkey's strategy for interpreting those stimuli.
METHODS
Animal Preparation
Animals were prepared for a single-neuron recording with surgery, preceded by sedation with Ketamine (15 mg/kg im) and Robinul (0.011 mg/kg im), followed by venous catheterization, endotracheal intubation, and general anesthesia using inhaled Isoflurane. During surgery, we monitored heart rate, core temperature, expired CO2, and the surgical plane of anesthesia.
We excised a 3 cm × 4 cm section of the scalp, debrided the calvarium, and inserted 24 dental pins into bone at the wound edge to anchor the implant. Scleral search coils were placed by bilateral perilimbotomy with leads to connectors in the implant (Judge et al. 1980). A head-positioning socket was implanted in the frontal midline with bilateral recording cylinders over 2-cm trephine holes above MSTd (AP − 2 mm; ML ± 15 mm; angle 0), all of which were encased in a dental acrylic cap.
After surgery and recovery from anesthesia, each animal was returned to its home cage, where it was monitored to guide the administration of Banamine (1 mg/kg im) analgesia under veterinary supervision. The excised scalp edge and recording chambers were cleaned daily. All protocols were approved by the University of Rochester Committee on Animal Research and complied with U.S. Public Health Service and Society for Neuroscience policy on the care of laboratory animals.
When fully recovered from surgery, the animals were trained to maintain visual fixation, as confirmed by eye-position monitoring using magnetic search coils. The monkeys maintained fixation (±3°) while viewing optic flow stimuli simulating self-movement. Fixation duration was increased over months of training with successful trials, followed by an audible tone and a liquid reward.
Optic Flow Stimuli
Optic flow stimuli were generated by a personal computer driving a television projector at 60 Hz to illuminate a rear-projection screen covering the center (90° × 90°) of the monkeys' visual field. Optic flow stimuli consisted of single-pixel white dots (0.19° at 2.61 cd/m2) presented on a dark background (0.18 cd/m2) and simulating observer self-movement through a three-dimensional cloud of illuminated points filling a 9-m depth field in front of the observer who was moving at 3 m/s. In the first frame, dots were distributed in a random pattern, filtered to smooth dot density across the screen. Dots were removed either by passing out of the 90° × 90° field of view or by the expiration of a randomly distributed dot duration ranging from 1 to 3 s. Dot speed was a sin2 function of dot eccentricity, measured as the angle between the monkey's line of sight and each dot's location on the screen and simulated distance. An average dot speed of 20°/s across all stimuli matched the speed preferences of MSTd neurons (Duffy and Wurtz 1997; Orban et al. 1995).
Behavioral Paradigms
Task paradigm.
Two monkeys learned four types of match-to-heading tasks. All tasks began with an optic flow sample stimulus, simulating transitional movement in one of the eight directions. The sample stimulus was presented for a 1,000- to 1,500-ms period and was followed by a 1,500-ms blank-screen delay period and then the presentation of an optic flow test stimulus. The monkey used a joystick to indicate whether the test stimulus matched (50% of trials) the sample or not, selecting a circle for match stimuli and a cross for nonmatches (left/right placement of the circle and cross was randomized across trials). Correct responses were followed by a liquid reward. Wrong responses, fixation breaks, or joystick releases led to a boop tone and a 10-s time-out. In all experiments, each combination of the sample and test stimuli was repeated six to nine times in a quasi-random stimulus sequence.
Experiment #1, match vs. near/far stimuli.
In the first experiment, one of the eight directions of optic flow was randomly selected as the sample stimulus presented for 1,500 ms. This was followed by a fixation-only delay period of 1,500 ms and then by the same stimulus, as the sample, match tests, or one of four nonmatch tests presented for 1,500 ms: two directions at ±45° directional offset from the match (near tests) or the two directions at ±135° directional offset from the match (far tests). In this experiment, the prior probability of any of the eight sample stimuli is 1/8 = 0.125, and the conditional prior probability of the five test stimuli, given the sample, might be taken to be 1/5 = 0.20 each. However, to balance the probability of the match and nonmatch test stimuli and avoid the monkey's gaming the task, we presented four times as many match stimuli as each of the four nonmatches.
Experiment #2, match vs. opposite stimuli.
In the second experiment, the sample was again a randomly selected one of the eight heading directions of optic flow presented for 1,000 ms. This was followed by a fixation-only delay of 1,500 ms and then either by the same stimulus as the sample match tests or by the nonmatch test, which always had the opposite heading direction—180° directional offset from the sample's heading direction. In this experiment, the test stimuli were presented for as long as it took the monkey to make its button-press selection, typically 500–800 ms. Here, the prior probability of any of the eight sample stimuli is 1/8 = 0.125, and that of the two test stimuli is 1/2 = 0.50, intrinsically balanced to equal numbers of match and nonmatch behavioral responses.
Experiment #3, preferred vs. opposite stimuli.
Neurons from the second experiment, which showed continued stable isolation, were included in a further study. In this third study, the sample stimulus was always that neuron's preferred direction of optic flow or the opposite direction, each presented for 1,000 ms and followed by a 1,500-ms fixation-only delay period. In these studies, the test either matched the sample or was in the opposite heading direction. Thus only two optic flow stimuli were presented. As in experiment #2, the test stimuli were presented for as long as it took the monkey to make its joystick response, typically 500–800 ms. Here, the prior probability of any of the two sample stimuli is 1/2 = 0.50, and that of the two test stimuli is 1/2 = 0.50, again, intrinsically balanced to equal numbers of match and nonmatch behavioral responses.
Experiment #4, preferred vs. near/far/opposite stimuli.
Neurons from the third study, which showed continued stable isolation, were included in a fourth study. In this fourth study, the sample was a randomly selected one of the eight heading directions of optic flow presented for 1,000 ms and followed by a 1,500-ms fixation-delay period. In this study, the test either matched the sample or was one of five nonmatch stimuli: opposite the sample ±45° directional offset from the sample (near) or ±135° directional offset from the sample (far). As in experiments #2 and #3, the test stimuli were presented for as long as it took the monkey to make its button-press selection, typically 500–800 ms. Here, the prior probability of any of the two sample stimuli is 1/2 = 0.50, and the conditional prior probability of the six test stimuli is 1/6 = 0.167 each, given the sample. Again, we balanced the probability of the match and nonmatch test stimuli to avoid the monkey's gaming the task.
Single-Neuron Recording
We passed epoxy-coated tungsten microelectrodes (FHC, Bowdoin, ME; MicroProbe, Gaithersburg, MD) through a transdural guide tube in a recording chamber (Crist et al. 1988) to isolate single-neuron action potentials. Activity was monitored as the electrode advanced to identify gray- and white-matter layers and the relative depth of physiological landmarks. On isolating a neuron, its receptive field was mapped using hand-held projectors. We used the rule that gray-matter layers, which include neurons with the large, direction-selective pattern motion preferring receptive fields of MSTd, are considered to be part of MSTd (Duffy and Wurtz 1991, 1995). MSTd neurons were identified by large receptive fields (>20°) that included the fixation point and show direction-selective responses preferring large moving patterns (Duffy and Wurtz 1991, 1995; Komatsu and Wurtz 1988a). A template-matching algorithm (Alpha Omega, Alpharetta, GA) was used to digitize neuronal discharge times. These were stored with stimulus and behavioral event markers from the REX system (Hays et al. 1982) for offline analysis in MATLAB (MathWorks, Natick, MA).
Recording Sites
Single-neuron recordings were directed to MSTd using stereotaxic positioning. When experiments were completed, electrolytic marks (25 μA × 25 s) were made at selected depths in several guide tubes in one of the two monkeys. After pentobarbital euthanasia, the animal was perfused with heparinized saline followed by formalin, and the brain was removed. After formalin fixation, cortical blocks were cut in 50-μm sections with every fourth and fifth section stained by the Nissl and Luxol Fast Blue.
We used electrolytic lesions and anatomic landmarks to infer the position of the recording sites. This analysis indicates that the neurons studied were in the anterior bank of the superior temporal sulcus (STS) within MSTd (Komatsu and Wurtz 1988b). Although the boundaries of STS areas are imprecise, we did not record neurons further up the STS in area 7a, further anteriorly in the fundal superior temporal cortex, or across the STS into the middle temporal area (MT) (Nelissen et al. 2006).
Data Analysis
Neuronal spike times were convolved with a 20-ms Gaussian to produce spike-density response functions averaging the six to 12 presentations of each stimulus condition. Average spike densities were plotted on a timeline relative to stimulus onset to compare firing-rate profiles across conditions. We derived spike firing rates during the periods from −300 ms to 0 ms before stimulus onset, from 100 ms to 400 ms after stimulus onset, and from 50 ms to 350 ms after the stimulus offset as measures of neuronal activity.
Average firing rates were normalized across conditions for each neuron. The highest mean firing rate for any stimulus, in any condition, was treated as the peak rate for response normalization in that neuron. The data were examined statistically using repeated measures ANOVA (SPSS v11.01; IBM SPSS, Armonk, NY) with the main effects of stimulus condition (sample vs. matched test vs. opposite test, etc.) and heading direction to identify significant effects.
RESULTS
We recorded the optic flow responses of 170 neurons from three hemispheres of two adult Rhesus monkeys: 54 neurons in experiment #1, match vs. near or far stimuli; 116 neurons in experiment #2, match vs. opposite stimuli, 35 of which were also studied in experiment #3, preferred vs. antipreferred stimuli; and experiment #4, preferred vs. opposite, near or far, stimuli. All studies were conducted at recording sites that included neurons with large receptive fields, most commonly encompassing one quadrant or more of the visual field and including the fovea. These neurons showed direction-selective, pattern-motion responses typical of those seen in MSTd (Komatsu and Wurtz, 1988b). In all stimulus-presentation periods, the monkeys fixated at the center of the screen.
Experiment #1, Match vs. Near or Far
The first experiment followed up on our previous finding of response-selectivity differences with near and far exogenous spatial-attentional pre-cues in a unique 4AFC saccade response task (Dubin and Duffy 2007). We hypothesized that similar results would be obtained in our new, more conventional 2AFC-DMS task. In this task, we first presented a randomly selected sample optic flow stimulus (1,500 ms), which was then followed by a fixation-only delay period (1,500 ms), and then a test optic flow stimulus (1,500 ms). The test stimulus either matched the sample stimulus or presented nonmatch stimuli with heading directions at ±45° (near) or ±135° (far) offset from the sample direction (Fig. 1, A and B).
Fig. 1.
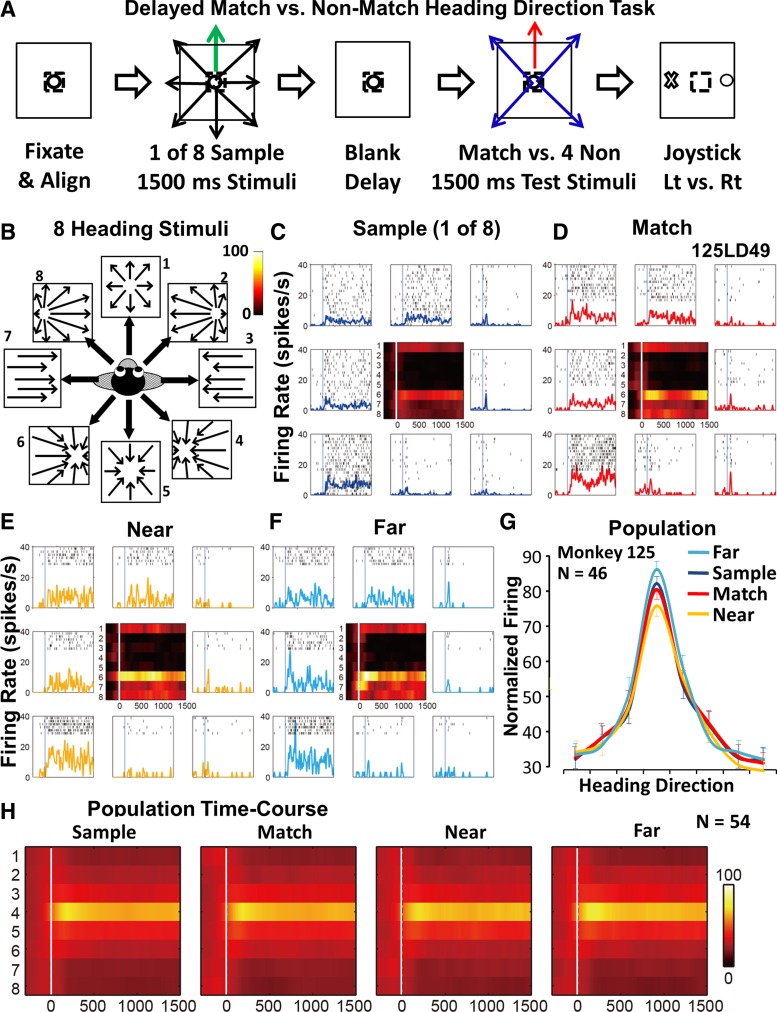
Match vs. near/far 2 alternative forced-choice delayed match-to-sample (2AFC-DMS) shows a significant effect of near suppression and far enhancement of the preferred optic flow stimulus. A: schematic diagram of the sequential presentation of a randomly selected 1 of 8 sample heading stimuli (green arrow), followed by a match (red arrow) or near/far nonmatch (blue arrows). Trials began when the monkey centered the joystick cursor (small dashed square) and fixated the centered target (small open circle). The monkey used the joystick to indicate match (X) or nonmatch (O). Lt, left; Rt, right. B: eight optic flow visual motion patterns (arrows) simulating self-movement in the ground plane were used for all stimuli. C–F: neuron preferring the left-backward heading stimulus (direction 6) in the sample (C), match (D), near nonmatch (E), and far nonmatch (F) conditions. Rasters and spike-density histograms (colored lines) of responses to the 8 optic flow stimuli (relative positions corresponding to the configuration in B; vertical lines indicate stimulus onset; color spike-density histograms are for all 8 directions in each condition). G: population responses from the 100- to 400-ms interval show the largest responses to the far nonmatch and the smallest responses to the near nonmatch. H: color spike-density histograms show averaged and normalized population responses evoked by the 8 optic flow heading stimuli (stacked rows aligned on sample preferred stimulus presented in the 4th row) for each condition with consistent direction preferences and strongest effects in the 1st 500 ms.
MSTd neurons show robust, unidirectional response profiles to the eight optic flow stimuli (Fig. 1C). The same response pattern is seen across all stimulus conditions: sample, match, near nonmatch, and far nonmatch. It is common to see the peak of neuronal activity in the early phase of the response periods, especially in response to the test stimuli (Fig. 1, D–F).
The timing of single-neuron responses varied across conditions (e.g., compare Fig. 1, C–F) but was focused in the first several 400 ms when averaged across neurons (Fig. 1H). We focused on the most consistently responsive 100- to 400-ms interval of the stimulus period. Two-way ANOVAs for each neuron show significant effects (P < 0.05) of direction (eight levels) or condition (sample, match, near, far) or their interactions in 85% (46/54) of the neurons. The responses of these neurons in all four conditions were aligned on the preferred response direction in the sample condition, normalized to the peak response firing rate across all conditions, and averaged to yield population response profiles (Fig. 1G). We compared responses across all conditions in these neurons using a repeated measures ANOVA having within-subject factors of task condition (four) and stimulus direction (eight) across neurons. This yields a significant main effect of direction (F7, 34 = 22.87, P < 0.001) and a significant direction-by-condition interaction effect (F21, 20 = 2.92, P = 0.01) but no significant main effect of condition (F3, 38 = 2.53, P = 0.072).
These effects are attributable to response-amplitude differences at the peak response direction, with the largest responses in the far nonmatch condition and the smallest responses in the near nonmatch condition. Responses to the sample and match stimuli are of intermediate amplitude, with activity in all responses concentrated within the first 500 ms of stimulus presentation (Fig. 1H). Thus we confirm the finding of Dubin and Duffy (2007) that the behavioral context of a stimulus can alter the optic flow selectivity of MSTd neurons. We show that the responses to the preferred stimulus are shaped by its role in a 2AFC-DMS task and by the near/far similarity of the sample and test stimuli.
Experiment #2, Match vs. Opposite
We hypothesized that differences between the match and near/far nonmatch responses seen in experiment #1 might reflect effects of there being four alternative nonmatches (two near and two far). To limit such effects, we simplified the task by presenting only one match and one nonmatch stimulus, while allowing the monkeys to make their joystick responses as soon as they liked. Thus in the second experiment, each trial began with a randomly selected one of the eight possible sample optic flow stimuli (1,000 ms), which was followed by a fixation-only delay period (1,500 ms), and then a test optic flow stimulus that was either a match to the sample or of the opposite heading direction and was extinguished as soon as the monkey made its joystick response (Fig. 2A).
Fig. 2.
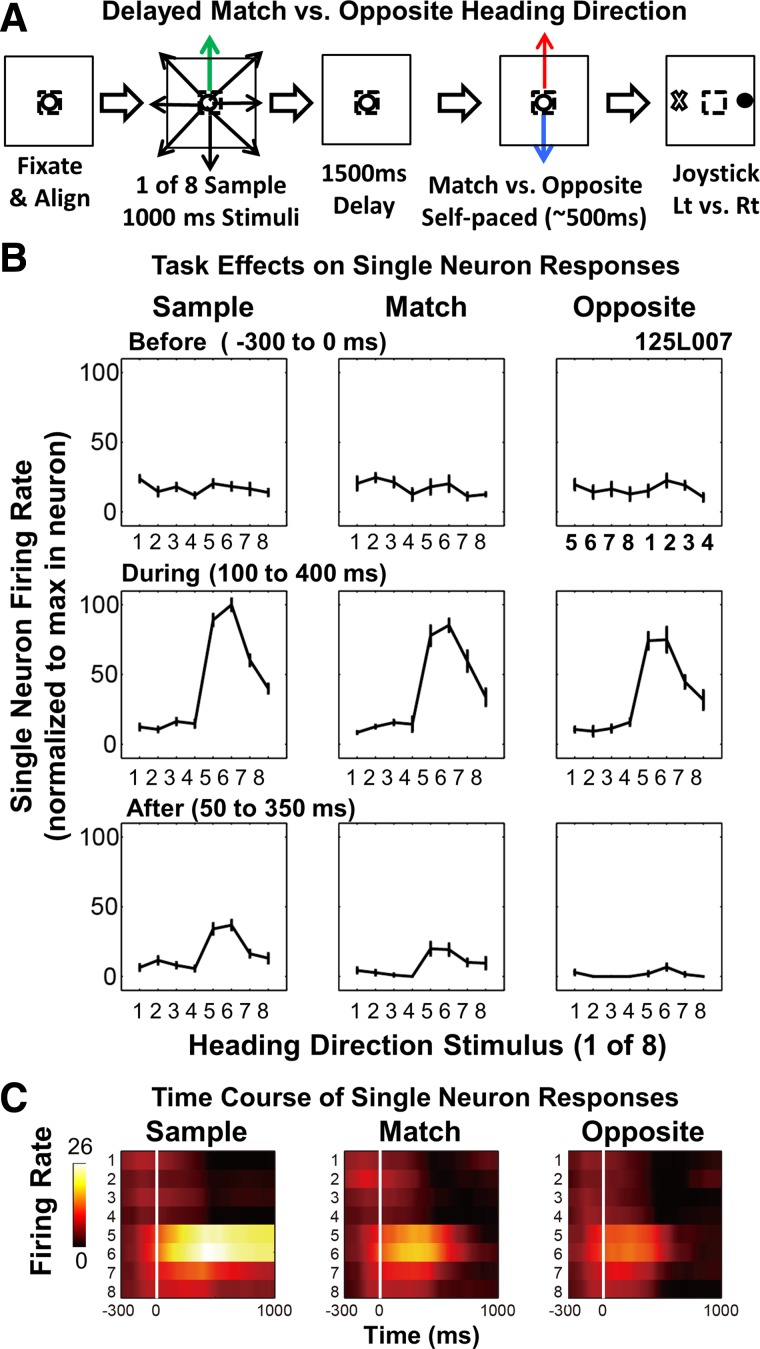
Match vs. opposite 2AFC-DMS paradigm showing significant suppression of both the match and opposite responses. A: schematic diagram of the sequential presentation of a randomly selected 1 of 8 sample heading stimuli (green arrow), followed by a match (red arrow) or opposite nonmatch (blue arrow). The monkeys' match (X) vs. opposite (O) joystick response is self paced. B: responses from a neuron in 3 stimulus intervals (rows) and 3 task conditions (columns). Responses to multiple stimulus presentations were averaged and normalized to the sample peak response (mean ± SE). The averaged response to sample stimuli (left, middle) is larger than those evoked by the same optic flow presented as match or opposite test stimuli. C: color spike-density histograms of activity evoked by the 8 optic flow heading stimuli (stacked rows) in each condition—in this neuron, showing greater suppression of opposite than match responses.
Single neurons show similar patterns of optic flow responsiveness in the sample and test stimulus periods, but the sample typically evoked larger responses (Fig. 2B). Most neurons show only subtle differences between the match and opposite responses, with approximately equal numbers showing somewhat smaller responses to the match or to the nonmatch stimulus (as illustrated).
We were again drawn to focus on the 100- to 400-ms stimulus period that most consistently showed clear responses (Fig. 2C), although we continued to examine the periods before and after that interval. A two-way ANOVA for each neuron revealed significant effects (P < 0.05) of direction (eight levels) or condition (sample, match, opposite) or their interactions in 67% (78/116) of the neurons. Responses in all three conditions were aligned on the preferred response direction in the sample condition, normalized to the peak response firing rate across all conditions for each neuron, and then averaged to yield population response profiles (Fig. 3).
Fig. 3.
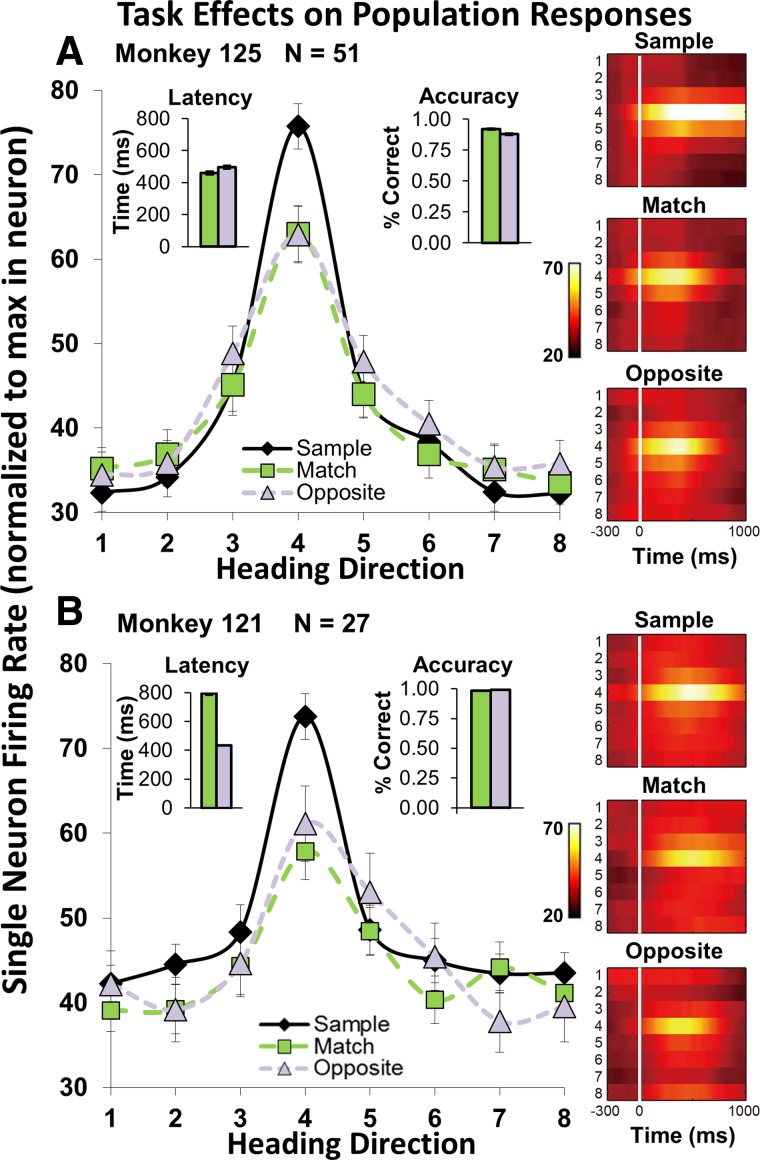
Match vs. opposite 2AFC-DMS population responses shows suppression concentrated at the sample preferred optic flow heading direction. A: monkey 125 showed a significant direction-by-condition interaction effect with the preferred stimulus evoking stronger responses in the sample than in the match or opposite conditions (100–400 ms interval). This monkey showed similar response times (RTs) and accuracies in match and opposite trials (inset, bar graphs). The color spike-density histograms (right) show stronger responses to the sample optic flow stimulus. B: monkey 121 showed a significant main effect of task condition, with the sample responses larger than the match and opposite responses at the preferred and several other stimuli (100–400 ms interval). This monkey showed prolonged RTs in match trials (left inset, bar graph) with similar accuracies in the match and opposite (right inset, bar graph). The color spike-density histograms (right) show more vigorous responses to the sample preferred stimulus and sustained activity associated with the prolonged responses of match trials.
In both monkeys, responses to sample stimuli are substantially larger than those evoked by match or opposite nonmatch test stimuli. We compared responses across all conditions in these neurons using a repeated measures ANOVA having within-subject factors of task condition (three) and stimulus direction (eight) across neurons. This yields a main effect of direction (F7, 71 = 26.62, P < 0.001) that reflects the clear heading direction selectivity of the neurons, as well as a significant direction-by-condition interaction effect (F14, 64 = 2.79, P = 0.003), which confirms that the directional responses differ across task conditions. There is no significant main effect of condition (F2, 76 = 1.13, P = 0.334) that reflects the fact that the match and opposite responses are almost identical.
Considering the two monkeys separately, data from monkey 125 replicate the effects seen in the combined data set. With the use of the same ANOVA design, we find a significant direction-by-condition interaction effect (F14, 37 = 2.64, P = 0.009) and a significant main effect of direction (F7, 44 = 19.45, P < 0.001) but no significant main effect of condition (F2, 49 = 0.66, P = 0.523; Fig. 3A). Post hoc ANOVAs comparing the sample and match conditions yield significant condition-by-direction interactions (F7, 44 = 4.98, P < 0.001) and main effects of direction (F7, 44 = 22.29, P < 0.001) but not condition (F1, 50 = 0.03, P = 0.875). Likewise, comparisons of the sample and opposite conditions showed significant condition-by-direction interactions (F7, 44 = 3.00, P = 0.012) and main effects of direction (F7, 44 = 12.72, P < 0.001) but not of condition (F1, 50 = 0.13, P = 0.716). Post hoc tests comparing the match and opposite conditions showed significant effects of direction (F7, 44 = 12.72, P < 0.001) but not of condition (F1, 50 = 1.23, P = 0.272) or of condition-by-direction interactions (F7, 44 = 1.09, P = 0.389). Thus there are direction-selective differences between the sample responses and the match and opposite test responses but not between the match and opposite responses themselves.
In contrast, the results from monkey 121 show a significant main effect of direction (F7, 20 = 7.59, P < 0.001) and condition (F2, 25 = 3.72, P < 0.039) but no significant direction-by-condition interaction effect (F14, 13 = 0.94, P = 0.550; Fig. 3B). However, post hoc tests across conditions for each direction showed significant differences only for direction 4 (F2, 25 = 4.43, P = 0.023), suggesting that the preferred stimulus accounts for condition differences. Post hoc tests comparing sample and match conditions showed significant effects of direction (F7, 20 = 8.65, P < 0.001) and condition (F1, 26 = 6.95, P = 0.014) but not of condition-by-direction interactions (F7, 20 = 1.18, P = 0.356). Post hoc tests comparing sample and opposite conditions also showed significant effects of direction (F7, 20 = 10.29, P < 0.001) and condition (F1, 26 = 6.06, P = 0.021) but not of condition-by-direction interactions (F7, 20 = 1.28, P = 0.308). Post hoc tests comparing match and opposite conditions also showed significant effects of direction (F7, 20 = 4.52, P = 0.004) but not of condition (F1, 26 = 0.23, P = 0.637) or of condition-by-direction interactions (F7, 20 = 1.10, P = 0.401). These results reflect the smaller responses of monkey 121 to both the preferred directions and the nonpreferred directions in the match and opposite test conditions.
The averaged response profiles from monkey 121 show a secondary peak in the match condition with prolonged neuronal responses and delayed joystick behavioral responses. Monkey 125 did not show these effects, suggesting a difference in how the two monkeys dealt with this task.
In sum, this study shows that selectivity effects do not always depend on the similarity of the sample and test stimuli. In this study, the test stimuli that match the sample show the same decrease in response amplitude as test stimuli having the opposite heading direction.
Preferred Stimulus Paradigms
We hypothesized that the diminished responses to preferred stimuli in the match vs. opposite paradigm might reflect our random selection of samples, making all of the optic flow stimuli equally relevant to the task. To test this hypothesis, we changed stimulus contingencies to make the preferred stimuli more behaviorally relevant. We used two 2AFC-DMS paradigms in which the sample was always either the preferred or antipreferred stimulus. The first paradigm used only two test stimuli: the sample repeated as a matching test stimulus and the opposite heading as the nonmatch test stimulus. The second paradigm used the sample as the match and five other heading directions, including the opposite, as nonmatches (Fig. 4A).
Fig. 4.
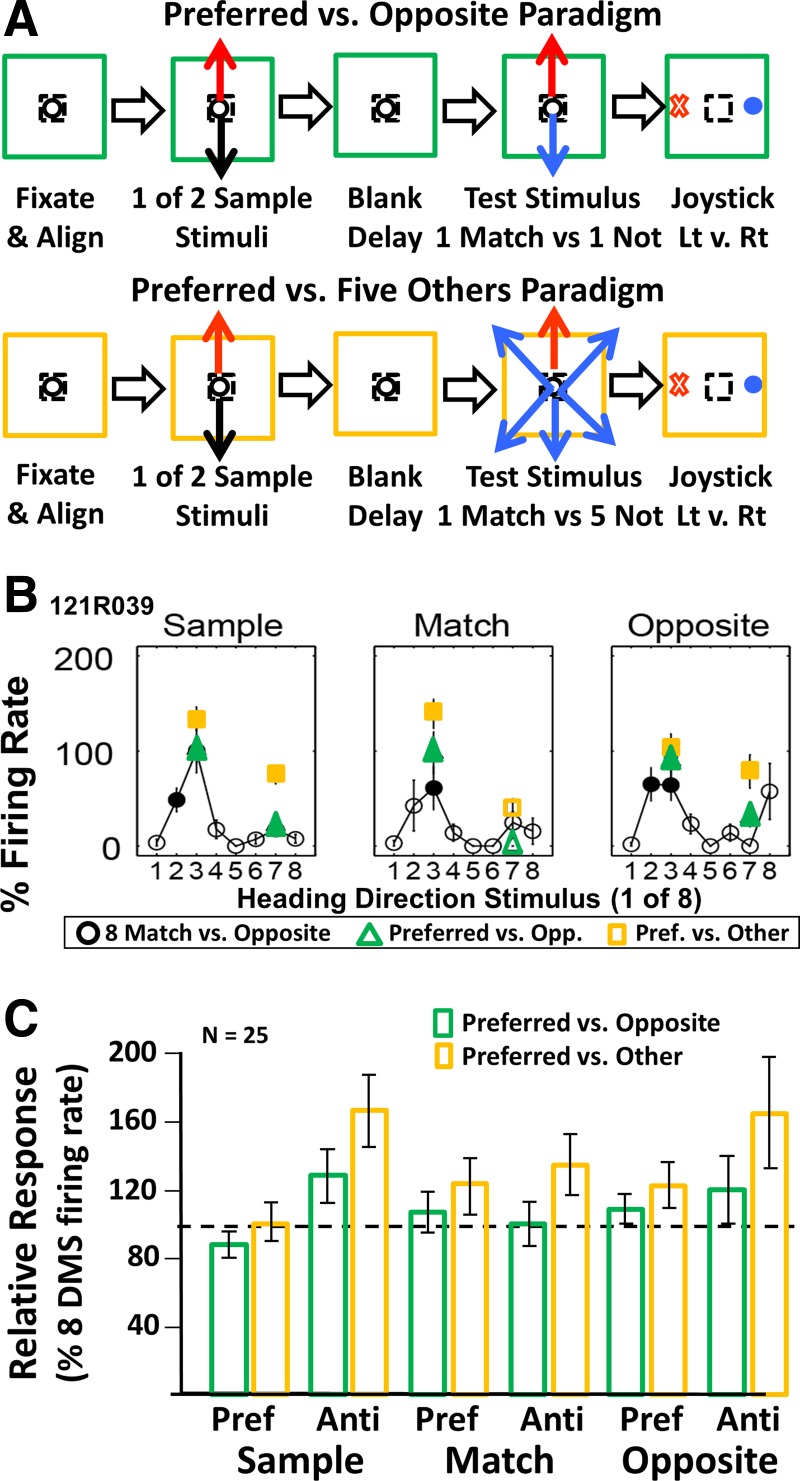
Neuronal responses depend on the number of sample and test stimuli. A: we presented 2 additional 2AFC-DMS paradigms that focused on responses to each neuron's preferred and antipreferred heading directions. The preferred vs. opposite paradigm (top, green) used each neuron's preferred and antipreferred heading directions as sample and test stimuli. The preferred vs. 5 other paradigms (bottom, yellow) used each neuron's preferred and antipreferred heading directions as sample and match stimuli and used 5 nonmatch stimuli: ±45°, ±135°, and 180° (opposite) relative to the sample heading direction. B: neuron, in which responses in the 8 stimuli, match vs. opposite paradigm (black lines), were somewhat changed by the preferred vs. opposite (Opp.) paradigm (green) and more substantially changed in the preferred (Pref.) vs. 5 other paradigms (yellow). All values are normalized to the 8 stimuli sample peak responses; filled symbols are significantly different from fixation control activity prior to sample onset. C: bar graph comparing averaged responses of 25 neurons recorded in 3 2AFC-DMS paradigms. Relative to responses in the 8 stimuli, match vs. opposite paradigm (dashed, horizontal line), the preferred stimulus paradigms showed increased responses to the antipreferred (Anti) stimuli in the sample and opposite test conditions of the preferred vs. opposite paradigm (green) more significantly so in the preferred vs. 5 other paradigms (yellow).
Both of the preferred direction paradigms yield behavioral response times (RTs), much like those from the randomly selected match/opposite paradigm: monkey 125, match/opposite = 461/496 ms, preferred/opposite = 492/537 ms, preferred/other = 459/460 ms; monkey 121, match/opposite = 795/434 ms, preferred/opposite = 805/441 ms, preferred/other = 788/410 ms. Nevertheless, the preferred stimulus paradigms evoked larger responses than seen in the immediately preceding eight direction match/opposite paradigm (Fig. 4B).
We illustrate the relative responses of these neurons across the three paradigms as the ratios of firing rates, from the preferred/opposite and the preferred/other paradigms to firing rates from the eight direction match/opposite paradigm. These ratios were derived for each stimulus condition (sample, match, and opposite) and each direction included in all three studies (Fig. 4C).
The responses from the match/opposite study and both preferred stimulus studies were combined in a repeated measures ANOVA having within-subject factors of experimental paradigm (three), task condition (three), and stimulus direction (two). This analysis yields a significant effect of a paradigm-by-stimulus interaction (F2, 30 = 5.73, P = 0.008), as well as a main effect of stimulus (F1, 31 = 13.89, P = 0.001) without other significant interaction or main effects.
We focused on the pair-wise comparisons of the preferred stimulus studies and the match vs. opposite study using post hoc ANOVAs having within-subject factors of experimental paradigm (three), task condition (three), and stimulus direction (two).
A comparison of the preferred/opposite and match/opposite studies again shows significant effects of a paradigm-by-stimulus interaction (F1, 31 = 11.20, P = 0.002), as well as a main effect of stimulus (F1, 31 = 24.02, P < 0.001), without other significant interaction or main effects. However, a comparison of preferred/others and match/opposite studies shows only a significant effect of stimulus (F1, 31 = 15.61, P < 0.001) without other significant main or interaction effects. Finally, a comparison of preferred/opposite and preferred/others studies shows a main effect of paradigm (F1, 31 = 4.26, P = 0.048) and stimulus (F1, 31 = 6.19, P = 0.018) without other significant main or interaction effects.
The preferred/opposite study draws us to conclude that the number of sample stimuli presented in the task has only a small impact on the responses. In contrast, the number of test stimuli presented in the task has a larger impact. In both cases, the effect is rather paradoxical: making the preferred stimulus more behaviorally relevant increases the magnitude of responses to the antipreferred stimulus. Overall, we conclude that the stimulus contingencies in 2AFC-DMS paradigms, both the variety of sample stimuli and the variety of choice stimuli, can alter responses to optic flow stimuli.
Condition-Dependent Bimodality
Closer examination of the responses of individual neurons in the preceding studies revealed that larger responses to antipreferred stimuli commonly reflect bimodal response profiles; profiles with two nonadjacent directions have higher-than-average firing rates. These dual-peak profiles were seen in at least one of the three conditions in most neurons (58%, 45/78; Fig. 5A). Dual-peak response profiles are rare in the initial match vs. near/far paradigm (two of 46 neurons).
Fig. 5.
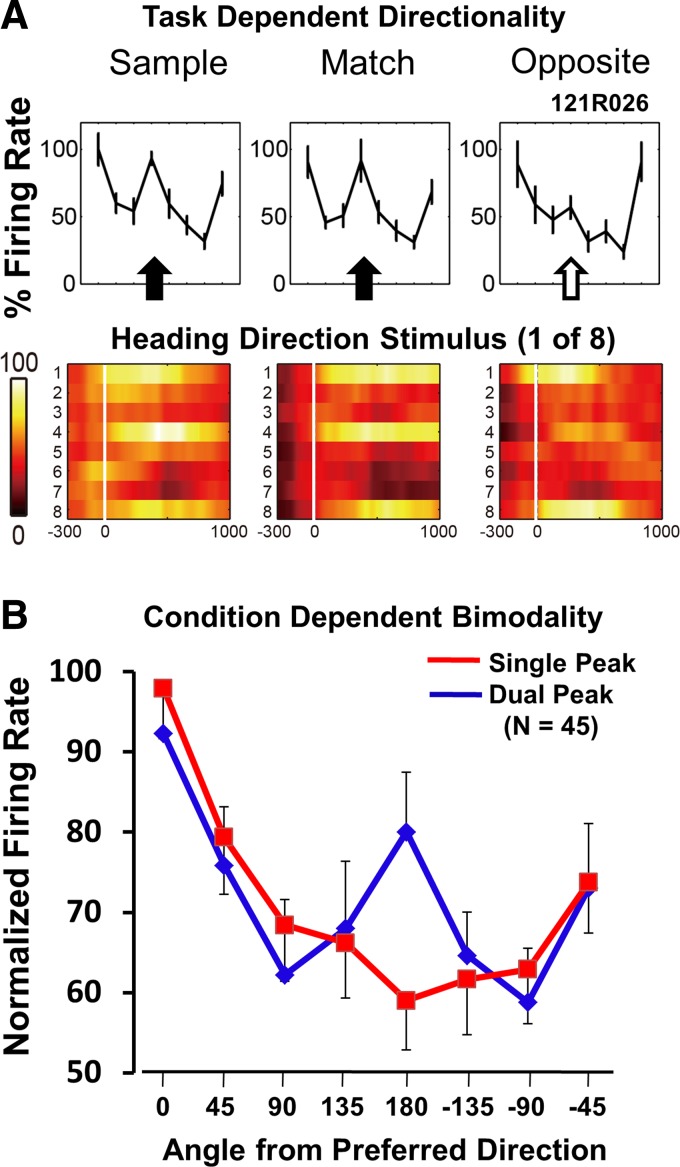
Bimodal direction response profiles in the match vs. opposite study. A: a neuron showing 2, 180° offset peaks in its directional response profile. The strongest directional response is present in all 3 conditions, whereas the smaller peak is present in the sample and match (filled arrows) but is greatly diminished in the opposite condition (open arrow). The color spike-density histograms (bottom) show bimodal directional response profiles in the sample and match conditions with a unimodal profile in the opposite condition. B: we identified neurons that show a significant direction-by-condition interaction effect in the test responses (P < 0.05, n = 45/78, 58%). In each of those neurons, we selected the condition that yielded the clearest dual-peak response profile (blue line) and the condition that yielded the clearest single-peak response profile (red line) to illustrate the conditional dependence of bimodality.
In each of these neurons, we selected the condition that had the clearest dual-peak profile and the condition that had the clearest single-peak profile. To do so, we derived the ratio of the firing rates from the preferred direction over the second-highest firing nonadjacent direction: dual peaks yield the lowest ratios; single peaks yield the highest. The tabulation of these ratios suggested that there are equal numbers of more bimodal and more unimodal profiles in each task's three conditions (i.e., 15/45 each). We aligned the response profiles on the direction with the highest firing rate and averaged the normalized response profiles for the most single-peak profiles and the most dual-peak profiles. The averaged response profiles revealed that the secondary peaks are concentrated at the direction opposite of the preferred direction (Fig. 5B).
We observed a potential mechanism of condition-specific, bimodal response profiles as residual effects of a preceding sample stimulus. Sample residual activity is not seen in the first 350 ms after the sample but emerges gradually late in the delay period and shapes responses to subsequent test stimuli (Fig. 6A). This late delay-period activity is highly direction selective and can be directly or inversely (as illustrated) related to the sample response profile. Responses to subsequent test stimuli appear to reflect subadditive interactions between the directional response profiles evoked by the sample stimulus and late delay-period activity. These response interactions can have enhancing or suppressive effects that can create bimodal response profiles (Fig. 6A). However, residual sample activity cannot fully explain bimodality, because bimodality is as likely in the sample as each of the test responses.
Fig. 6.
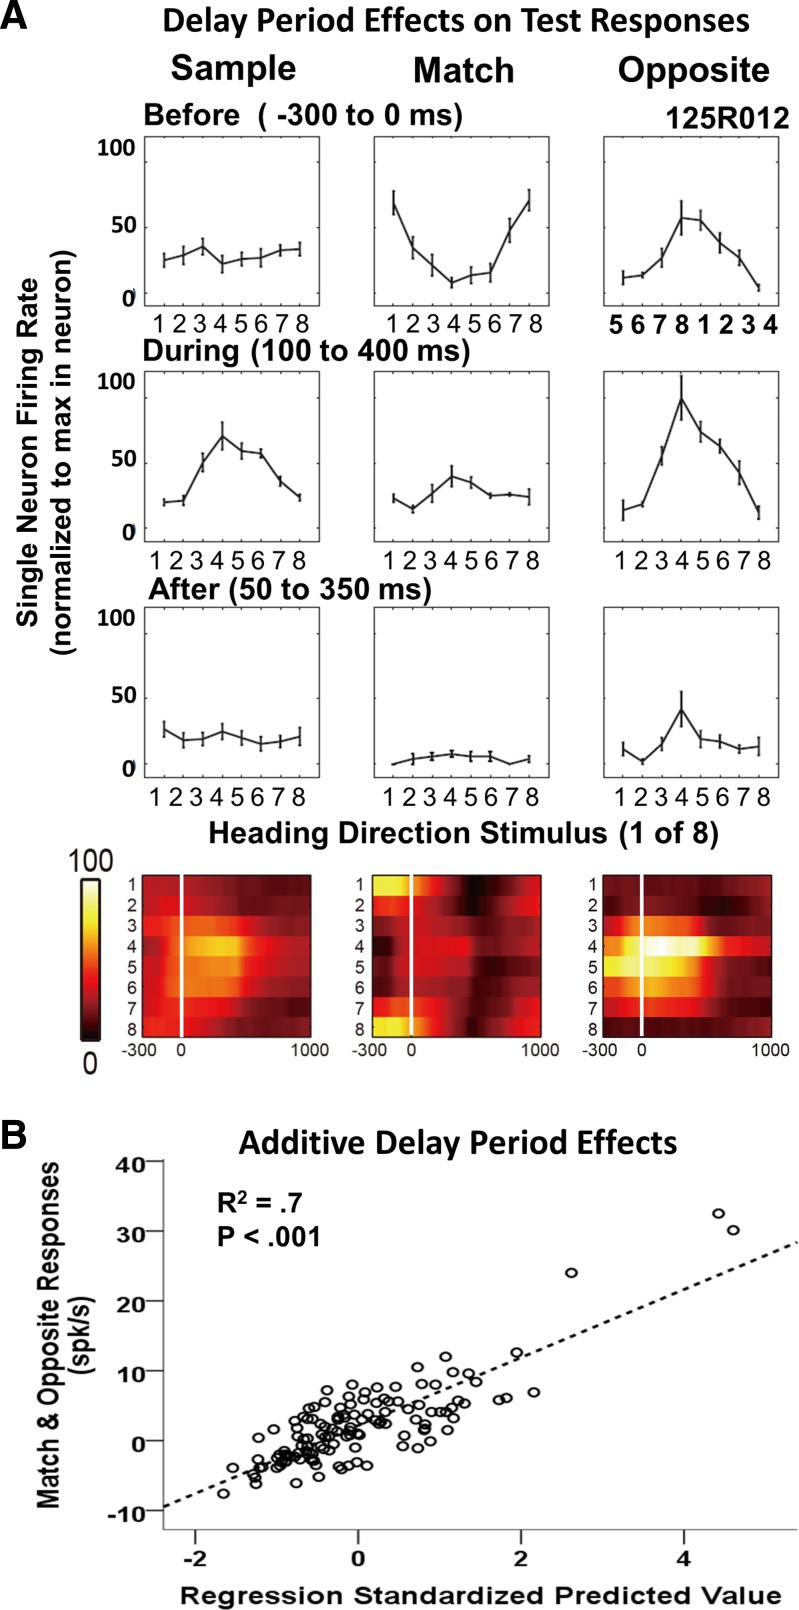
Delay-period activity altered responses to match and opposite stimuli. A: responses of a neuron that shows significant direction-selective, late delay-period activity. The delay-period activity yields inverted response profiles in the match (top, middle) and opposite (top, right) test conditions, because these intervals are aligned with the stimulus direction in the subsequent test period (180° different for match and opposite). The responses evoked by the test stimuli (middle row, middle and right columns) appear to be the result of additive interactions between the sample responses (middle row, left column) and the corresponding late delay-period activity (top row, middle and right columns). The color spike-density histograms (bottom) show the impact of delay-period activity on the test responses. B: responses of neurons with significant delay-period condition effects. Scatter plot of match/opposite test responses minus presample baseline firing rate (ordinate) and responses predicted by multiple linear regression (abscissa) based on responses to sample and late delay-period activity minus presample baseline firing rate. A significant linear fit showed additive interactions between delay-period and stimulus-evoked activity. spk/s, spikes/s.
We assessed the prevalence of late delay-period effects in match/opposite responses using two-way between-subject ANOVAs to identify significant effects. At the end of the delay period, 10% (8/78) of the neurons show significant condition (one neuron) or condition-by-direction interaction (seven neurons) effects. Multiple linear regression showed that the match/opposite responses of these neurons reflect additive interactions between late delay-period activity (β = 0.20, P < 0.001) and sample-evoked stimulus effects (β = 0.78, P < 0.001; Fig. 6B).
These findings suggest that direction-selective, late delay-period activity may contribute to condition-dependent, bimodal response profiles in match/opposite 2AFC-DMS paradigms. The concentration of these effects in the heading direction opposite of that preferred by the neuron could reflect intrinsic properties or consequences of the preferred/opposite paradigm.
DISCUSSION
Response Suppression and Enhancement
We first compared responses across conditions in a match vs. near/far nonmatch 2AFC-DMS paradigm. The sample and match responses were nearly identical, but the near nonmatches yielded smaller responses, and the far nonmatches yielded larger responses (Fig. 1). These results are similar to those reported by Dubin and Duffy (2007) in that they show robust changes in MSTd neuronal response selectivity with effects concentrated at each neuron's preferred stimulus. However, the earlier paradigms focused on spatial attentional effects and showed greater selectivity with near pre-cues, whereas the current DMS paradigm shows greater selectivity with a far test stimulus. This leads us to conclude that spatial attention and working memory effects provide parallel but independent task-dependent modulation of MSTd neuronal responsiveness.
The smaller near nonmatch responses seen in the current experiment are similar to effects seen in inferior temporal (IT) cortex DMS studies using object stimuli. In those studies, test stimuli yielded smaller responses in proportion to their similarity to the sample stimulus (Li et al. 1993; Miller and Desimone 1993). Two features distinguish our results from those in IT: first, we find increased responses to dissimilar stimuli, as well as decreased responses to similar stimuli. These effects are more similar to those seen in perirhinal neurons, with larger responses to DMS test objects (Lehky and Tanaka 2007). Second, the most similar stimulus in our paradigm—the match stimulus—does not show a similarity effect; its responses are the same as the sample.
Differences between similarity/dissimilarity effects in our studies and those in IT might reflect the nature of the respective stimulus sets. Object stimuli, appropriate to IT, can readily be seen as similar but less readily seen as opposites. In contrast, optic flow stimuli are readily seen as similar or opposite along the continuum of simulated heading direction. Thus the enhancement of responses to far nonmatch test stimuli may not have been seen in IT, because there are no unequivocally far nonmatch objects.
More comparable stimulus sets have been used in dorsal stream area MT. Patches of planar motion presented in the motion-defined receptive fields of MT yield approximately equal numbers of cells, showing response decrements or increments in DMS paradigms (Lui and Pasternak 2011). Comparisons with our findings are constrained by the use of only preferred and antipreferred directions in MT. Thus we cannot conclude that all dorsal stream areas show similar effects or that those effects are uniformly different from those in ventral stream areas.
Task Effects and Perceptual Strategy
We hypothesized that the match vs. near/far study's four different nonmatch test stimuli promoted a visual pattern-discrimination strategy that highlighted the relative similarities (near nonmatches) and dissimilarities (far nonmatches) of the test stimuli relative to the sample. We tested that hypothesis by changing our paradigm to make it more comparable with other studies by restricting the 2AFC-DMS task to match vs. opposite test stimulus heading directions. Initially, we randomly selected a different one of the eight headings as the sample for each trial (Figs. 2 and 3). This yielded different results than the match vs. near/far study, in this case, showing smaller responses to both the match and the opposite test stimuli, again, with the largest effects at the preferred heading.
Our two monkeys showed differences in the match vs. opposite study: monkey 125 showed a loss of selectivity seen as a stimulus direction-by-task condition interaction effect. In contrast, monkey 121 showed smaller responses to both the preferred and nonpreferred directions with a doubling of its behavioral RT to match test stimuli. The RT differences argue against task difficulty as the determinant of task effects—the seemingly greater difficulty of match trials not corresponding to differences in neuronal responses to match and opposite test stimuli. This view is supported by the same pattern of RT effects in the preferred stimulus 2AFC-DMS experiments, with larger responses to antipreferred stimuli in the sample and opposite conditions.
We consider that our monkeys used different perceptual strategies in the match vs. near/far and the match vs. opposite studies. The match vs. near/far study demands, in particular, the discrimination of the stimulus that should prompt a match behavioral response from the very similar near stimuli that should prompt a nonmatch behavioral response. In contrast, the match vs. opposite study demands only that the monkey discriminate the match from the very different opposite test stimulus—a change detection that could be done using any local motion segment at any selected part of the display.
We have previously seen that monkeys can use either global or local motion processing strategies to interpret optic flow (Page and Duffy 2008). When monkeys use the local planar motion in optic flow, we see smaller responses; when they use global pattern processing, we see larger responses. The use of a global motion strategy in the match vs. near/far study could lead to the larger far responses and smaller near responses based on dissimilarity and similarity effects. The use of local motion change detection in the match vs. opposite study could lead to smaller responses in both test conditions.
Monkey 121 showed the clearest evidence of a local motion change detection strategy in the match vs. opposite study. This is seen by the longer RTs to match test stimuli in which the monkey had to recognize the lack of a change in the local motion, whereas the faster RT opposite test stimuli required only that the monkey recognize a change in the local motion.
Local motion processing may favor multiplicative gain effects on optic flow response magnitude, as in the main effect of task condition of monkey 121 (Fig. 7A). In contrast, a global pattern motion strategy may favor more extensive competitive interactions between the different motion directions in nearby segments of an optic flow stimulus, resulting in a stronger tuning selectivity (as in the task condition of monkey 125)-by-direction interaction effect (Fig. 7A).
Fig. 7.
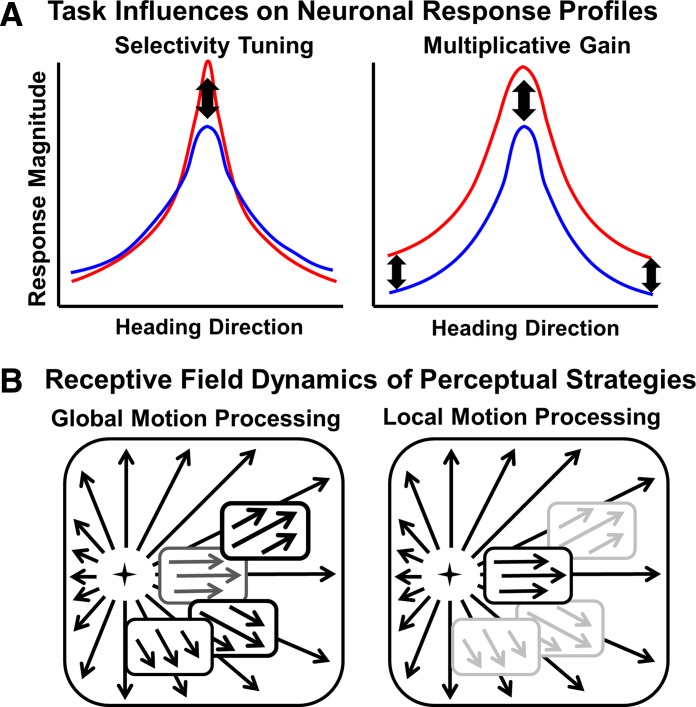
Hypothetical framework for task effects on the optic flow response profiles of dorsal medial superior temporal. A: response profiles depicting task effects on firing-rate response magnitude (ordinate) as a function of heading direction (abscissa) for task-effect response increments (red) vs. decrements (blue). Selectivity tuning effects (left) result in greater changes at the preferred heading, whereas multiplicative gain effects (right) result in a uniform change in relative response magnitude. B: hypothesis of receptive-field mechanisms (Yu et al. 2010) related to shifts in optic flow processing strategies (Page and Duffy 2008). The monkeys' use of a global motion processing strategy (left) balances input from a diverse array of spatially distributed receptive-field segments and may favor selectivity tuning effects of behavioral tasks. The monkeys' use of a local motion processing strategy (right) emphasizes responses to a selected receptive-field segment and may favor multiplicative gain effects of behavioral tasks.
The local motion strategy may be similar to that seen in MT neuronal responses to single-motion direction stimuli (McAdams and Maunsell 1999; Treue and Maunsell 1996), whereas the global pattern strategy may be similar to that seen with multiple motion direction stimuli that promote biased competition with selectivity tuning effects (Reynolds et al. 1999; Reynolds and Desimone 2003). We consider that the use of the many direction-selective segments in the global pattern of optic flow may promote competitive interactions in MSTd neurons.
The observation of multiplicative gain effects in some studies and tuning selectivity effects in others has been synthesized in the context of divisive normalization models, suggesting a unified mechanism for attentional response modulation (Ni et al. 2012; Reynolds and Heeger 2009). Our studies suggest that a comparable range of mechanisms may account for the effects of local and global perceptual strategies on task effects in the optic flow responsive neurons of MSTd. This implies that gain and selectivity mechanisms in MSTd change in response to stimulus conditions and perceptual strategies.
Task Effects on Direction Preferences
Our studies of task effects with the random selection of samples suggested that the number of test stimuli alters 2AFC-DMS task effects. We hypothesized that the number of sample stimuli might also do so. We tested this hypothesis by reducing the number of sample stimuli to two: the preferred and antipreferred headings. These studies yielded larger responses to antipreferred stimuli depending on the number of test stimuli: the preferred vs. opposite task showed less-robust effects than the preferred vs. five others (Fig. 4).
The increase in responses of the preferred paradigms to antipreferred stimuli led us to recognize the prevalence of bimodal response profiles in the eight direction match vs. opposite tasks (Fig. 5). Such effects have rarely been seen in previous studies of the optic flow heading selectivity of MSTd (Bremmer et al. 2010; Britten and Van Wezel 2002; Duffy and Wurtz 1991, 1995; Gu et al. 2007). We consider that response profile bimodality may be a consequence of the monkeys' prolonged experience in the task—the monkeys' learning that these tasks present only two sample stimuli. Repeated exposures to a limited set of familiar stimuli have previously been seen to alter IT cortical neuronal responses to shape stimuli (Li et al. 1993), and in prefrontal neurons, the learned anticipation of specific stimuli altered response properties (Boch and Goldberg 1989; Rainer and Miller 2002).
The learned anticipation of stimuli from a limited stimulus set might also contribute to the emergence of the direction selectivity, late in the delay-period activity, seen in our studies (Fig. 6). Late delay-period activity has previously been seen as long as 15 s after sample stimuli in DMS paradigms (Fuster and Alexander 1971; Fuster and Jervey 1981) with robust effects on subsequent test responses (Bisley et al. 2004; Gibson and Maunsell 1997; Lui and Pasternak 2011). Direction-selective, late delay-period activity appears to summate with stimulus-evoked activity in MSTd. We have previously seen diverse, idiosyncratic effects of response summation in MSTd neurons (Sato et al. 2010). Such response summation with delay-period activity may contribute both to the bimodal response profiles of the match vs. opposite paradigm and to the larger antipreferred responses in the preferred vs. other paradigm.
Direction-selective, late delay-period activity could be mediated by prefrontal storage of adaptive working memory signals (Shohamy and Adcock 2010), which is top-down projected to the dorsal extrastriate cortex to support delay-period activity (Fukushima et al. 2011; Ogawa and Komatsu 2010; Zaksas and Pasternak 2006). Alternatively, late delay-period activity could reflect top-down signals from the nearby lateral intraparietal cortex, where single neurons show the temporal integration of visual input to support behavioral decisions (Huk and Shadlen 2005; Roitman and Shadlen 2002; Rorie et al. 2010).
Thus we find that the optic flow preferences and selectivities of MSTd are affected by task contingencies. We speculate that this relies on the top-down shaping of direction-selective prestimulus activity that focuses responsiveness on upcoming stimuli. Such mechanisms could have the adverse effect of perceptual interference between preceding and ongoing stimuli (Kang et al. 2011), as well as benefits accrued by shaping response properties based on the prior probabilities derived from experience in recurring circumstances (Perrett et al. 2009).
GRANTS
Support for this work was provided by the National Eye Institute Grant R01-EY10287 and Office of Naval Research Grant N000141110525.
DISCLOSURES
No conflicts of interest, financial or otherwise, are declared by the authors.
AUTHOR CONTRIBUTIONS
Author contributions: N.S., W.K.P., and C.J.D. conception and design of research; N.S., W.K.P., and C.J.D. performed experiments; N.S., W.K.P., and C.J.D. analyzed data; N.S., W.K.P., and C.J.D. interpreted results of experiments; N.S., W.K.P., and C.J.D. prepared figures; N.S., W.K.P., and C.J.D. drafted manuscript; N.S., W.K.P., and C.J.D. edited and revised manuscript; N.S., W.K.P., and C.J.D. approved final version of manuscript.
ACKNOWLEDGMENTS
We gratefully acknowledge the scientific and computer programming contributions of William Vaughn and the animal care and training assistance of Sherry Estes.
REFERENCES
- Bisley JW, Zaksas D, Droll JA, Pasternak T. Activity of neurons in cortical area MT during a memory for motion task. J Neurophysiol 91: 286–300, 2004 [DOI] [PubMed] [Google Scholar]
- Boch RA, Goldberg ME. Participation of prefrontal neurons in the preparation of visually guided eye movements in the rhesus monkey. J Neurophysiol 61: 1064–1084, 1989 [DOI] [PubMed] [Google Scholar]
- Bremmer F, Kubischik M, Pekel M, Hoffmann KP, Lappe M. Visual selectivity for heading in monkey area MST. Exp Brain Res 200: 51–60, 2010 [DOI] [PubMed] [Google Scholar]
- Britten KH, Van Wezel RJ. Area MST and heading perception in macaque monkeys. Cereb Cortex 12: 692–701, 2002 [DOI] [PubMed] [Google Scholar]
- Crist CF, Yamasaki DS, Komatsu H, Wurtz RH. A grid system and a microsyringe for single cell recordings. J Neurosci Methods 26: 117–122, 1988 [DOI] [PubMed] [Google Scholar]
- Dubin MJ, Duffy CJ. Behavioral influences on cortical neuronal responses to optic flow. Cereb Cortex 17: 1722–1732, 2007 [DOI] [PubMed] [Google Scholar]
- Duffy CJ. MST neurons respond to optic flow and translational movement. J Neurophysiol 80: 1816–1827, 1998 [DOI] [PubMed] [Google Scholar]
- Duffy CJ, Wurtz RH. Medial superior temporal area neurons respond to speed patterns in optic flow. J Neurosci 17: 2839–2851, 1997 [DOI] [PMC free article] [PubMed] [Google Scholar]
- Duffy CJ, Wurtz RH. Response of monkey MST neurons to optic flow stimuli with shifted centers of motion. J Neurosci 15: 5192–5208, 1995 [DOI] [PMC free article] [PubMed] [Google Scholar]
- Duffy CJ, Wurtz RH. Sensitivity of MST neurons to optic flow stimuli. I. A continuum of response selectivity to large-field stimuli. J Neurophysiol 65: 1329–1345, 1991 [DOI] [PubMed] [Google Scholar]
- Egger SW, Engelhardt HR, Britten KH. Monkey steering responses reveal rapid visual-motor feedback. PLoS One 5: e11975, 2010 [DOI] [PMC free article] [PubMed] [Google Scholar]
- Froehler MT, Duffy CJ. Cortical neurons encoding path and place: where you go is where you are. Science 295: 2462–2465, 2002 [DOI] [PubMed] [Google Scholar]
- Fukushima J, Akao T, Shichinohe N, Kurkin S, Kaneko CR, Fukushima K. Neuronal activity in the caudal frontal eye fields of monkeys during memory-based smooth pursuit eye movements: comparison with the supplementary eye fields. Cereb Cortex 21: 1910–1924, 2011 [DOI] [PMC free article] [PubMed] [Google Scholar]
- Fuster JM, Alexander GE. Neuron activity related to short-term memory. Science 173: 652–654, 1971 [DOI] [PubMed] [Google Scholar]
- Fuster JM, Jervey JP. Inferotemporal neurons distinguish and retain behaviorally relevant features of visual stimuli. Science 212: 952–955, 1981 [DOI] [PubMed] [Google Scholar]
- Gibson JR, Maunsell JH. Sensory modality specificity of neural activity related to memory in visual cortex. J Neurophysiol 78: 1263–1275, 1997 [DOI] [PubMed] [Google Scholar]
- Gu Y, DeAngelis GC, Angelaki DE. A functional link between area MSTd and heading perception based on vestibular signals. Nat Neurosci 10: 1038–1047, 2007 [DOI] [PMC free article] [PubMed] [Google Scholar]
- Hays AV, Richmond BJ, Optican LM. A UNIX-based multiple process system for real-time data acquisition and control. WESCON Conf Proc 2: 1–10, 1982 [Google Scholar]
- Heuer HW, Britten KH. Optic flow signals in extrastriate area MST: comparison of perceptual and neuronal sensitivity. J Neurophysiol 91: 1314–1326, 2004 [DOI] [PubMed] [Google Scholar]
- Huk AC, Shadlen MN. Neural activity in macaque parietal cortex reflects temporal decision making. J Neurosci 25: 10420–10436, 2005 [DOI] [PMC free article] [PubMed] [Google Scholar]
- Judge SJ, Richmond BJ, Chu FC. Implantation of magnetic search coils for measurement of eye position: an improved method. Vision Res 20: 535–538, 1980 [DOI] [PubMed] [Google Scholar]
- Kang MS, Hong SW, Blake R, Woodman GF. Visual working memory contaminates perception. Psychon Bull Rev 18: 860–869, 2011 [DOI] [PMC free article] [PubMed] [Google Scholar]
- Kishore S, Hornick N, Sato N, Page WK, Duffy CJ. Driving strategy alters neuronal responses to self-movement: cortical mechanisms of distracted driving. Cereb Cortex 22: 201–208, 2011 [DOI] [PMC free article] [PubMed] [Google Scholar]
- Komatsu H, Wurtz RH. Relation of cortical areas MT and MST to pursuit eye movements. I. Localization and visual properties of neurons. J Neurophysiol 60: 580–603, 1988a [DOI] [PubMed] [Google Scholar]
- Komatsu H, Wurtz RH. Relation of cortical areas MT and MST to pursuit eye movements. III. Interaction with full-field visual stimulation. J Neurophysiol 60: 621–644, 1988b [DOI] [PubMed] [Google Scholar]
- Lappe M, Bremmer F, Pekel M, Thiele A, Hoffmann KP. Optic flow processing in monkey STS: a theoretical and experimental approach. J Neurosci 16: 6265–6285, 1996 [DOI] [PMC free article] [PubMed] [Google Scholar]
- Lehky SR, Tanaka K. Enhancement of object representations in primate perirhinal cortex during a visual working-memory task. J Neurophysiol 97: 1298–1310, 2007 [DOI] [PubMed] [Google Scholar]
- Li L, Miller EK, Desimone R. The representation of stimulus familiarity in anterior inferior temporal cortex. J Neurophysiol 69: 1918–1929, 1993 [DOI] [PubMed] [Google Scholar]
- Logan DJ, Duffy CJ, Logan DJ, Duffy CJ. Cortical area MSTd combines visual cues to represent 3-D self-movement. Cereb Cortex 16: 1494–1507, 2006 [DOI] [PubMed] [Google Scholar]
- Lui LL, Pasternak T. Representation of comparison signals in cortical area MT during a delayed direction discrimination task. J Neurophysiol 106: 1260–1273, 2011 [DOI] [PMC free article] [PubMed] [Google Scholar]
- Martinez Trujillo JC, Treue S. Feature-based attention increases the selectivity of population responses in primate visual cortex. Curr Biol 14: 744–751, 2004 [DOI] [PubMed] [Google Scholar]
- McAdams CJ, Maunsell JH. Effects of attention on orientation-tuning functions of single neurons in macaque cortical area V4. J Neurosci 19: 431–441, 1999 [DOI] [PMC free article] [PubMed] [Google Scholar]
- Merchant H, Battaglia-Mayer A, Georgopoulos AP. Effects of optic flow in motor cortex and area 7a. J Neurophysiol 86: 1937–1954, 2001 [DOI] [PubMed] [Google Scholar]
- Miller EK, Desimone R. Activity of neurons in anterior inferior temporal cortex during a short-term memory task. J Neurosci 13: 1460–1478, 1993 [DOI] [PMC free article] [PubMed] [Google Scholar]
- Nelissen K, Vanduffel W, Orban GA. Charting the lower superior temporal region, a new motion-sensitive region in monkey superior temporal sulcus. J Neurosci 26: 5929–5947, 2006 [DOI] [PMC free article] [PubMed] [Google Scholar]
- Ni AM, Ray S, Maunsell JH. Tuned normalization explains the size of attention modulations. Neuron 73: 803–813, 2012 [DOI] [PMC free article] [PubMed] [Google Scholar]
- Ogawa T, Komatsu H. Differential temporal storage capacity in the baseline activity of neurons in macaque frontal eye field and area V4. J Neurophysiol 103: 2433–2445, 2010 [DOI] [PubMed] [Google Scholar]
- Orban GA, Lagae L, Raiguel S, Xiao D, Maes H. The speed tuning of medial superior temporal (MST) cell responses to optic-flow components. Perception 24: 269–285, 1995 [DOI] [PubMed] [Google Scholar]
- Page WK, Duffy CJ. Cortical neuronal responses to optic flow are shaped by visual strategies for steering. Cereb Cortex 18: 727–739, 2008 [DOI] [PubMed] [Google Scholar]
- Perrett DI, Xiao D, Barraclough NE, Keysers C, Oram MW. Seeing the future: natural image sequences produce “anticipatory” neuronal activity and bias perceptual report. Q J Exp Psychol (Hove) 62: 2081–2104, 2009 [DOI] [PubMed] [Google Scholar]
- Rainer G, Miller EK. Timecourse of object-related neural activity in the primate prefrontal cortex during a short-term memory task. Eur J Neurosci 15: 1244–1254, 2002 [DOI] [PubMed] [Google Scholar]
- Reynolds JH, Chelazzi L, Desimone R. Competitive mechanisms subserve attention in macaque areas V2 and V4. J Neurosci 19: 1736–1753, 1999 [DOI] [PMC free article] [PubMed] [Google Scholar]
- Reynolds JH, Desimone R. Interacting roles of attention and visual salience in V4. Neuron 37: 853–863, 2003 [DOI] [PubMed] [Google Scholar]
- Reynolds JH, Heeger DJ. The normalization model of attention. Neuron 61: 168–185, 2009 [DOI] [PMC free article] [PubMed] [Google Scholar]
- Roitman JD, Shadlen MN. Response of neurons in the lateral intraparietal area during a combined visual discrimination reaction time task. J Neurosci 22: 9475–9489, 2002 [DOI] [PMC free article] [PubMed] [Google Scholar]
- Rorie AE, Gao J, McClelland JL, Newsome WT. Integration of sensory and reward information during perceptual decision-making in lateral intraparietal cortex (LIP) of the macaque monkey. PLoS One 5: e9308, 2010 [DOI] [PMC free article] [PubMed] [Google Scholar]
- Saito H, Yukie M, Tanaka K, Hikosaka K, Fukada Y, Iwai E. Integration of direction signals of image motion in the superior temporal sulcus of the macaque monkey. J Neurosci 6: 145–157, 1986 [DOI] [PMC free article] [PubMed] [Google Scholar]
- Sato N, Kishore S, Page WK, Duffy CJ. Cortical neurons combine visual cues about self-movement. Exp Brain Res 206: 283–297, 2010 [DOI] [PMC free article] [PubMed] [Google Scholar]
- Shohamy D, Adcock RA. Dopamine and adaptive memory. Trends Cogn Sci 14: 464–472, 2010 [DOI] [PubMed] [Google Scholar]
- Treue S, Maunsell JH. Attentional modulation of visual motion processing in cortical areas MT and MST. Nature 382: 539–541, 1996 [DOI] [PubMed] [Google Scholar]
- Yu CP, Page WK, Gaborski R, Duffy CJ. Receptive field dynamics underlying MST neuronal optic flow selectivity. J Neurophysiol 103: 2794–2807, 2010 [DOI] [PMC free article] [PubMed] [Google Scholar]
- Zaksas D, Pasternak T. Directional signals in the prefrontal cortex and in area MT during a working memory for visual motion task. J Neurosci 26: 11726–11742, 2006 [DOI] [PMC free article] [PubMed] [Google Scholar]