

Abstract
Primary human CoQ10 deficiencies are clinically heterogeneous diseases caused by mutations in PDSS2 and other genes required for CoQ10 biosynthesis. Our in vitro studies of PDSS2 mutant fibroblasts, with <20% CoQ10 of control cells, revealed reduced activity of CoQ10-dependent complex II+III and ATP synthesis, without amplification of reactive oxygen species (ROS), markers of oxidative damage, or antioxidant defenses. In contrast, COQ2 and ADCK3 mutant fibroblasts, with 30–50% CoQ10 of controls, showed milder bioenergetic defects but significantly increased ROS and oxidation of lipids and proteins. We hypothesized that absence of oxidative stress markers and cell death in PDSS2 mutant fibroblasts were due to the extreme severity of CoQ10 deficiency. Here, we have investigated in vivo effects of Pdss2 deficiency in affected and unaffected organs of CBA/Pdss2kd/kd mice at presymptomatic, phenotypic-onset, and end-stages of the disease. Although Pdss2 mutant mice manifest widespread CoQ9 deficiency and mitochondrial respiratory chain abnormalities, only affected organs show increased ROS production, oxidative stress, mitochondrial DNA depletion, and reduced citrate synthase activity, an index of mitochondrial mass. Our data indicate that kidney-specific loss of mitochondria triggered by oxidative stress may be the cause of renal failure in Pdss2kd/kd mice.—Quinzii, C. M., Garone, C., Emmanuele, V., Tadesse, S., Krishna, S., Dorado, B., Hirano, M. Tissue-specific oxidative stress and loss of mitochondria in CoQ-deficient Pdss2 mutant mice.
Keywords: ubiquinone, polyprenyl-diphosphate synthase, ATP, ROS
Coenzyme Q (CoQ), or ubiquinone, consists of a benzoquinone ring and a decaprenyl side chain. The benzoquinone ring is synthesized from tyrosine or phenylalanine, while the polyisoprenoid tail is assembled by polyprenyl-diphosphate synthase (PDSS). Polyprenyl-diphosphate:4-HB transferase (COQ2) catalyzes the formation of covalent linkage between the headgroup and the tail, followed by modification of the aromatic ring. Ten complementation groups of CoQ yeast mutants and mammalian homologues of the yeast coq genes have been identified via sequence homology (1).
Human CoQ10 deficiencies are clinically and genetically heterogeneous diseases. In 34 patients, pathogenic mutations in genes encoding proteins involved in the biosynthesis of CoQ10 have been identified (2). Mutations in decaprenyl diphosphate synthase subunit 2 (PDSS2), which encodes one of two subunits of PDSS, the first dedicated enzyme of the CoQ10 biosynthetic pathway, were initially reported in a male infant with nephropathy and Leigh syndrome (3). The child presented with neonatal pneumonia and hypotonia and subsequently developed seizures, progressive weakness, lactic acidosis, and low serum albumin with massive proteinuria due to nephrotic syndrome. At age 8 months, he died of refractory status epilepticus. In cultured skin fibroblasts from this patient, we observed severe CoQ10 deficiency (12–18% of normal) with markedly decreased ATP level and ATP/ADP ratio, but no signs of oxidative damage to proteins and lipids, and normal cell growth. In contrast, skin fibroblasts harboring mutations in COQ2 or ADCK3 and control skin fibroblasts treated with 4-nitrobenzoate (4NB), an inhibitor of COOQ2, had milder CoQ10 deficiency (30–50% of normal), moderate bioenergetic defects, and signs of oxidative stress (4–6). The absence of signs of oxidative stress and cell death in PDSS2 mutant fibroblasts may be explained by degree of CoQ10 deficiency, cell-specific effects, or specific consequences of PDSS2 deficiency.
To explore these possibilities in vivo, we have evaluated CoQ level, mitochondrial function, and oxidative stress in affected and unaffected tissues of early and late symptomatic mice harboring a homozygous kidney disease (kd) mutation in Pdss2 (Pdss2kd/kd mice). Although published work has demonstrated ultrastructural mitochondria abnormalities in kidney in B6/Pdss2kd/kd 7-wk-old mice (7), the mutant animals appear healthy until age 8 wk, when they develop nephropathy with proteinuria that progresses to lethal renal failure, the only clinical manifestation of the disease. Liver and heart show later and milder histological defect (8, 9). In addition, Ziegler et al. (10) noted cerebellar abnormalities in Pdss2kd/kd mice. The predominant kidney phenotype in these mice has been attributed to renal CoQ deficiency, producing respiratory chain deficiency, increased oxidative stress, or both (11); however, direct evidence of oxidative injury has been lacking. Here, we have observed that affected and unaffected organs of Pdss2kd/kd mice manifest variable severity and onset of CoQ deficiency and defects of mitochondrial respiratory chain enzyme activities. Notably, onset of the disease correlates with signs of increased oxidative stress in affected organs, suggesting a causal relationship.
MATERIALS AND METHODS
Animal care
CBA/Pdss2kd/kd mice were a kind gift of Dr. David Gasser (University of Pennsylvania, Philadelphia, PA, USA). CBA is the strain in which the spontaneous mutation designated kd originated (12). All experiments were performed according to a protocol approved by the Institutional Animal Care and Use Committee of the Columbia University Medical Center, and were consistent with the U.S. National Institutes of Health Guide for the Care and Use of Laboratory Animals. Mice were housed and bred according to international standard conditions, with a 12-h light-dark cycle.
Mice were euthanized by rapid carbon dioxide narcosis followed by cervical dislocation at presymptomatic stage (age 1 mo), onset of disease manifestations (4 mo), and end stage of the disease (6 mo) to assess CoQ9 level, activities of mitochondrial respiratory chain enzymes, adenine nucleotide levels, histology, oxidative stress, and mitochondrial DNA (mtDNA) content of brain, kidney, muscle (quadriceps femoris), and liver. Organs were removed and either frozen in the liquid phase of isopentane, precooled toward its freezing point (−160°C) with dry ice, or fixed in 10% neutral buffered formalin and embedded in paraffin using standard procedures. All the experiments were performed in ≥3 mice unless otherwise specified.
CoQ9 measurement
CoQ9 in kidney, brain, liver, and muscle was extracted in 1-propanol. The lipid component of the extract was separated by high-performance liquid chromatography (HPLC) on a reverse-phase Waters Symmetry C18 3.5 μm, 4.6 × 150 mm (Waters Corp., Milford, MA, USA), using a mobile phase consisting of methanol, ethanol, 2-propanol, acetic acid (500:470:15:15), and 50 mM sodium acetate at a flow rate of 0.8 ml/min. The electrochemical detector, ESA Coulochem II (ESA Inc., Chelmsford, MA, USA), was used with the following settings: guard cell (upstream of the injector) at +650 mV, conditioning cell at −650 mV (downstream of the column), followed by the analytical cell at +450 mV. CoQ concentration was estimated by comparison of the peak area with those of standard solutions of known concentration and expressed in micrograms per gram of tissue (3).
Mitochondrial respiratory chain complex activities
To measure activities of mitochondrial respiratory complexes, 40–70 mg of tissue was homogenized in CPT medium (0.5 M Tris-HCl and 0.15 M KCl, pH 7.5) and centrifuged at 2500 g for 20 min at 4°C to obtain 10% homogenates. Supernatant was used for protein determination and enzymatic assays. Complex I and III (I+III) activity was measured by observation of the reduction of cytochrome c (cyt c) at 550 nm. In brief, samples were incubated at 30°C in a medium containing 100 mM KH2PO4 (pH 7.5), 10 mM KCN, 2 mM NADH, and 1 mM cyt c. The increase of absorbance was observed for 1 min, and an additional 2 min after addition of rotenone (10 μg/ml). Complex I+III activity was calculated by subtracting activity in the presence of rotenone from total activity. The results were expressed in nanomoles of reduced cyt c per minute per gram of tissue.
Complex II and III (II+III) activity was measured by observation of the reduction of cyt c at 550 nm. Samples were incubated at 30°C in medium containing 100 mM KH2PO4 (pH 7.5), 30 mM succinate, 10 mM KCN, and 1 mM cyt c, and increase of absorbance was observed for 2 min. The results were expressed in nanomoles of reduced cyt c per minute per gram of tissue. Cyt c oxidase (COX or complex IV) activity was measured following the reduction of cyt c at 550 nm. Samples were incubated at 30°C in a medium containing 10 mM KH2PO4 (pH 7.0), and 1% reduced cyt c, and the reaction was followed for 3 min. The results were expressed in nanomoles of oxidized cyt c per minute per gram of tissue. Citrate synthase (CS) activity was measured following the reduction of 1 mM 5,5′-dithiobis(2-nitrobenzoic acid) in 1 M Tris-HCl (pH 8.1) at 412 nm (30°C) for 2 min in the presence of sample, 10 mM acetyl-CoA, and 10 mM oxalacetic acid (13). CS was expressed as nanomoles per minute per gram of tissue. The results of complexes I+III, II+III, and IV were normalized to CS activity. Because of the variability of CS activity, activities of respiratory chain enzymes were also normalized to proteins.
Adenine nucleotide levels
Adenine nucleotide concentrations were measured as described previously (14) with slight modifications. Briefly, mice were euthanized, and the tissues were rapidly extracted and frozen in isopentane precooled in dry ice. Then, 50 mg of tissue was homogenized in 500 μl of ice-cold 0.5 M perchloric acid and centrifuged at 16,000 g for 10 min at 4°C. Pellets were stored at −80°C for protein measurement, and supernatant was neutralized with 50 μl of 4M K2CO3 and centrifuged at 16,000 g for 10 min. Adenine nucleotides were measured in the supernatants in an Alliance HPLC (Waters) with an Alltima C18 NUC reverse-phase column (Alltech Associates, Deerfield, IL, USA). After stabilizing the column with the mobile phase, samples (50 μl) were injected into the HPLC system. The mobile phase consisted of 100 mM potassium phosphate, 1 mM tetrabutylammonium hydrogen sulfate, and 3% acetonitrile buffer at pH 7.0 at 1.2 ml/min flow rate. Standard curves for AMP, ADP, and ATP were constructed with 15, 30, and 60 μM of each nucleotide. Absorbance of the samples was measured with an UV detector at 254 nm wavelength, and the concentration of each nucleotide in the samples was calculated based on the peak area. Adenine nucleotide levels were expressed in nanomoles per milligram of protein (14).
Morphological studies
To visualize histological features and mitochondrial abnormalities, 6-μm-thick frozen sections of kidney, liver, muscle, and brain were cut in a cryostat, and hematoxylin and eosin (H&E), COX, succinate dehydrogenase (SDH), combined COX-SDH, and modified Gomori trichrome stains were performed (15). Sections were examined using an Olympus BX51 microscope (Olympus, Tokyo, Japan) with a computer-assisted image analysis system, and the images were scanned under uniform light conditions with QCapture software (QImaging, Surrey, BC, Canada).
Oxidative stress assessment
To evaluate ROS production, 1-, 4-, and 6-mo-old mutant and wild-type animals were injected intraperitoneally with 200 μl of phosphate-buffered saline (PBS) containing 1 μg/μl of dihydroethidine (ET; Molecular Probes, Eugene, OR, USA) and 1% DMSO and euthanized after 15 min. Red fluorescence generated by the 2-electron oxidation product, ethidium (E+), indicates intracellular superoxide formation. Although E+ reflects increased ROS within cells, ET can also cross-react with other cellular components, such as cytochromes; therefore, ET fluorescence is considered to be a qualitative rather than a quantitative indicator of intracellular and/or extracellular O2− (16, 17).
Using 5-μm-thick frozen sections of each tissue, 3 fields in each section were analyzed. Fluorescence was detected with an Olympus BX51 microscope with a tetramethylrhodamine isothiocyanate (TRITC) filter and scanned with the Slidebook 4.1 computer-assisted image analysis system (Olympus).
Oxidative damage in kidney was also assessed by immunohistochemistry, using an anti-nitrotyrosine antibody (SC55256-R; Santa Cruz Biotechnology, Inc., Santa Cruz, CA, USA), and a rabbit anti-4 hydroxynonenal (4-HNE) antiserum (HNE11-S; Alpha Diagnostic International. Inc., San Antonio, TX, USA), marker of lipid perodixation (LPO). LPO was also assessed with the Bioxytech LPO-568 assay kit (Oxis International, Foster City, CA, USA), to determine both malondialdehyde (MDA) and 4-hydroxyalkenals (4HDAs), according to the manufacturer's instructions. Concentrations of LPO were normalized to mg prot. Expression of WT1 protein, a podocyte marker, was assessed using rabbit anti-WT1 antibody clone C-19 (SC-192; Santa Cruz Biotechnology).
Kidney samples from 1-mo-old (2 mutants analyzed), 4-mo-old (1 mutant analyzed), and 6-mo-old (3 mutants analyzed) mice were fixed in 10% neutral buffered formalin and embedded in paraffin using standard procedures. Sections (3 μm) were used for immunohistochemical studies. Briefly, paraffin-embedded kidney slides were deparaffinized, rehydrated, and rinsed in PBS. To block endogenous peroxidase activity, sections were incubated in 3% hydrogen peroxide in methanol. Slides were then placed in 0.1 M sodium citrate buffer (pH 6.0) and heated in a microwave oven for 15 min, for antigen retrieval. The sections were incubated with donkey serum (D9663; Sigma-Aldrich, St. Louis, MO, USA) for 1 h at room temperature, and then with rabbit polyclonal anti-nitrotyrosine antibody (1:50), rabbit polyclonal anti-WT1 antibody clone C-19 (1:50), or rabbit anti-4-HNE antiserum (1:1000) overnight at 4°C. Sections were subsequently rinsed in PBS, and incubated with anti-rabbit IgG, biotinylated species-specific whole antibody (GE Healthcare Life Sciences, Pittsburgh, PA, USA) for 60 min at room temperature. Immunoreactivity was detected by avidin–biotin complex (ABC) with DAB substrate (Vector Laboratories, Burlingame, CA, USA). The glomerular basement membrane was visualized with periodic acid Schiff (PAS) reaction, without nuclear counterstain. 4-HNE slides were not counterstained. Slides were examined by light microscopy using an Olympus BX51 microscope, and images were captured with a QImaging Retiga EXi digital camera, using QCapture 2.68.6 software.
mtDNA quantification
Mouse mtDNA was quantitated by real-time PCR using an ABI PRISM 7000 sequence detection system (Applied Biosystems, Foster City, CA, USA), using primers and probes for murine COX I gene (mtDNA) and mouse glyceraldehyde-3-phosphate dehydrogenase (nuclear DNA) (18).
Statistical analysis
Data are expressed as means ± sd of ≥3 experiments/group. Unpaired t test with Welch correction was used to compare groups. A value of P < 0.05 was considered to be statistically significant.
RESULTS
CoQ9 levels
Pdss2kd/kd mice (1 mo old) showed decreased levels of CoQ9 in brain (20% of the mean of age-matched controls), kidney (28%), liver (62%), and muscle (35%) (Fig. 1 and Supplemental Fig. S1). In 4-mo-old mutant animals as well, levels of CoQ9 were reduced in brain (16%), kidney (21%), and muscle (25%) compared to wild-type littermates. In contrast, liver of Pdss2kd/kd mice had increased CoQ9 (157% of control animals; Fig. 1 and Supplemental Fig. S1). In 6-mo-old mutant animals, all organs studied, brain (28%), kidney (14%), liver (68%), and muscle (20%), showed significant deficiency of CoQ9 (Fig. 1 and Supplemental Fig. S1).
Figure 1.

CoQ9 level in brain (A), kidney (B), liver (C), and muscle (D) of 1-, 4- and 6-mo-old Pdss2kd/kd mice; 5 mutants (MUT) vs. 5 wild type (WT). Values are expressed as mean ± sd concentration (nmol/mg protein). *P ≤ 0.05; **P ≤ 0.01; ***P ≤ 0.001.
Respiratory chain enzyme activities
Biochemical activities of mitochondrial respiratory chain enzymes are summarized in Tables 1–4. In 4- and 6-mo-old Pdss2kd/kd animals, biochemical activities of CoQ-dependent complex I+III, normalized to CS activity (a marker of mitochondrial mass), was significantly reduced in kidney (Table 1). In 6-mo-old mutant mice, complex I+III also showed significant decrease in muscle (Table 4) and a trend toward decrease in liver (Table 3). In contrast, in liver of 4-mo-old Pdss2kd/kd animals, complex I+III activity normalized to CS activity or protein was increased (Table 3).
Table 1.
Mitochondrial respiratory chain enzyme activities in kidney
| Age and genotype | I+III | II+III | COX | CS | I+III/CS | II+III/CS | COX/CS |
|---|---|---|---|---|---|---|---|
| 1 mo | |||||||
| WT | 7.20 ± 1.01 | 0.92 ± 0.40 | 1.73 ± 0.88 | 322.00 ± 80.43 | 35.00 ± 10 | 65.00 ± 21.98 | 22.50 ± 12.58 |
| MUT | 7.00 ± 2.12 | 0.76 ± 0.151 | 2.66 ± 1.10 | 294.40 ± 62.66 | 33.33 ± 15.27 | 38.00 ± 5.04* | 32.00 ± 14.83 |
| 4 mo | |||||||
| WT | 7.05 ± 2.00 | 1.13 ± 0.54 | 3.42 ± 1.59 | 243.00 ± 24.00 | 43.66 ± 17.21 | 32.42 ± 24.98 | 51.66 ± 7.52 |
| MUT | 5.56 ± 1.59 | 0.99 ± 0.35 | 2.91 ± 1.14 | 242.00 ± 43.00 | 30.42 ± 14.81* | 28.00 ± 10.26 | 56.66 ± 24.21 |
| 6 mo | |||||||
| WT | 4.2.2 ± 1.25 | 1.63 ± 0.52 | 3.32 ± 0.29 | 265.00 ± 67.00 | 200.00 ± 12.66 | 50.00 ± 27.57 | 72.00 ± 30.33 |
| MUT | 1.88 ± 0.14* | 1.45 ± 0.07 | 2.70 ± 1.3 | 183.00 ± 15.00* | 97.50 ± 5.00*** | 47.50 ± 5.00 | 62.50 ± 23.62 |
Values are expressed as mean ± sd nanomoles per minute per gram of tissue, normalized to milligrams of protein or to CS activity. I+III, complex I+III; II+III, complex II+III; COX, cytochrome c oxidase; CS, citrate synthase; WT, wild-type; MUT, mutant.
P ≤ 0.05;
P ≤ 0.001.
Table 2.
Mitochondrial respiratory chain enzyme activities in brain
| Age and genotype | I+III | II+III | COX | CS | I+III/CS | II+III/CS | COX/CS |
|---|---|---|---|---|---|---|---|
| 1 mo | |||||||
| WT | 15.56 ± 10.58 | 1.54 ± 0.87 | 3.95 ± 3.19 | 160.00 ± 11.54 | 37.50 ± 5.00 | 52.00 ± 4.47 | 42.50 ± 15 |
| MUT | 9.06 ± 3.18 | 1.86 ± 0.35 | 3.17 ± 0.29 | 288.00 ± 58.90 | 34.00 ± 13.41 | 40.00 ± 7.00* | 37.5 ± 12.58 |
| 4 mo | |||||||
| WT | 31.17 ± 3.57 | 3.39 ± 0.87 | 15.20 ± 3.92 | 380.00 ± 130.00 | 64.00 ± 45.00 | 66.00 ± 29.66 | 162.00 ± 105.92 |
| MUT | 27.34 ± 3.17 | 3.14 ± 0.41 | 15.08 ± 1.36 | 338.00 ± 128.00 | 81.42 ± 28.53 | 65.71 ± 22.99 | 207.14 ± 83.80 |
| 6 mo | |||||||
| WT | 18.00 ± 4.47 | 2.52 ± 0.74 | 15.14 ± 4.00 | 305.00 ± 84.00 | 58.33 ± 19.40 | 55.00 ± 5.77 | 166.67 ± 51.63 |
| MUT | 13.73 ± 1.76 | 2.00 ± 0.22 | 12.23 ± 1.31 | 243.00 ± 39.00 | 55.00 ± 5.77 | 55.00 ± 5.77 | 200.00 ± 81.64 |
Values are expressed as mean ± sd nanomoles per minute per gram of tissue, normalized to milligrams of protein or to CS activity. I+III, complex I+III; II+III, complex II+III; COX, cytochrome c oxidase; CS, citrate synthase; WT, wild-type; MUT, mutant.
P ≤ 0.05.
Table 3.
Mitochondrial respiratory chain enzyme activities in liver
| Age and genotype | I+III | II+III | COX | CS | I+III/CS | II+III/CS | COX/CS |
|---|---|---|---|---|---|---|---|
| 1 mo | |||||||
| WT | 1.94 ± 0.17 | 0.48 ± 0.28 | 4.46 ± 1.82 | 112.50 ± 17.08 | 21.72 ± 16.02 | 80.00 ± 8.17 | 128.00 ± 34.80 |
| MUT | 1.80 ± 0.69 | 0.27 ± 0.15 | 3.16 ± 0.78 | 121.07 ± 22.36 | 14.48 ± 4.29 | 37.50 ± 4.48*** | 106.20 ± 28.37 |
| 4 mo | |||||||
| WT | 1.95 ± 1.20 | 0.80 ± 0.24 | 1.56 ± 0.56 | 173.57 ± 16.60 | 20.00 ± 12.64 | 51.67 ± 18.35 | 160.00 ± 89.44 |
| MUT | 3.88 ± 1.56* | 0.54 ± 0.14 | 4.14 ± 1.58* | 232.57 ± 34.82** | 38.00 ± 13.03* | 38.57 ± 10.69 | 157.14 ± 53.45 |
| 6 mo | |||||||
| WT | 8.52 ± 3.61 | 1.01 ± 0.33 | 4.48 ± 1.78 | 185.33 ± 43.01 | 80.00 ± 34.64 | 52.00 ± 16.43 | 200.00 ± 81.65 |
| MUT | 5.79 ± 0.82 | 0.65 ± 0.10 | 7.18 ± 3.25 | 182.97 ± 16.13 | 35.00 ± 23.80 | 40.00 ± 5.00 | 250.00 ± 57.73 |
Values are expressed as mean ± sd nanomoles per minute per gram of tissue, normalized to milligrams of protein or to CS activity. I+III, complex I+III; II+III, complex II+III; COX, cytochrome c oxidase; CS, citrate synthase; WT, wild-type; MUT, mutant.
P ≤ 0.05;
P ≤ 0.01;
P ≤ 0.001.
Table 4.
Mitochondrial respiratory chain enzyme activities in muscle
| Age and genotype | I+III | II+III | COX | CS | I+III/CS | II+III/CS | COX/CS |
|---|---|---|---|---|---|---|---|
| 1 mo | |||||||
| WT | 4.25 ± 2.47 | 1.20 ± 0.89 | 2.00 ± 1.88 | 474.00 ± 318.48 | 8.50 ± 8.54 | 9.67 ± 0.58 | 20.40 ± 18.02 |
| MUT | 3.68 ± 2.76 | 0.76 ± 0.29 | 1.08 ± 1.20 | 576.00 ± 219.61 | 7.75 ± 8.54 | 11.25 ± 5.85 | 11.20 ± 8.52 |
| 4 mo | |||||||
| WT | 12.86 ± 8.99 | 1.00 ± 0.14 | 2.55 ± 1.79 | 214.61 ± 80.16 | 22.50 ± 12.58 | 18.00 ± 8.00 | 40.00 ± 38.47 |
| MUT | 5.74 ± 2.50 | 0.82 ± 0.21 | 3.50 ± 1.45 | 271.60 ± 46.33 | 18.33 ± 7.53 | 20.00 ± 5.77 | 54.29 ± 19.88 |
| 6 mo | |||||||
| WT | 8.80 ± 1.90 | 0.95 ± 0.48 | 5.10 ± 1.45 | 260.11 ± 77.47 | 36.67 ± 10.33 | 23.33 ± 5.16 | 85.00 ± 27.39 |
| MUT | 3.88 ± 1.79* | 0.73 ± 0.17 | 6.58 ± 5.12 | 292.26 ± 64.59 | 13.75 ± 7.50* | 15.00 ± 5.77* | 82.50 ± 46.46 |
Values are expressed as mean ± sd nanomoles per minute per gram of tissue, normalized to milligrams of protein or to CS activity. I+III, complex I+III; II+III, complex II+III; COX, cytochrome c oxidase; CS, citrate synthase; WT, wild-type; MUT, mutant.
P ≤ 0.05.
Complex II+III activity normalized to CS was significantly reduced in kidney, brain, and liver and was slightly increased in muscle of 1-mo-old Pdss2kd/kd animals compared with controls (Tables 1–3). Complex II+III activity normalized to proteins also showed trends toward decreases in kidney, liver, and muscle of 4-mo-old Pdss2kd/kd animals (Tables 1, 3, and 4). In 6-mo-old Pdss2kd/kd mice, complex II+III activity normalized to CS was significantly reduced in muscle (Table 4) and showed a trend toward decrease in liver (Table 3).
Activities of COX and CS relative to total protein were normal in most tissues of Pdss2kd/kd animals compared with controls; only liver of 4-mo-old Pdss2kd/kd animals showed increased activities (Table 3). In contrast, CS activity was decreased in kidney of 6-mo-old Pdss2kd/kd animals (Table 1).
mtDNA quantification
In 1-mo-old mutant mice, levels of mtDNA normalized to nuclear DNA in all tissues tested (kidney, brain, liver, and muscle) were comparable to levels in control animals (Fig. 2). In 4-mo-old mutant mice, levels of mtDNA were significantly decreased in kidney (19%), but increased in brain (128%), and liver (120%) relative to wild-type animals (Fig. 2). In 6-mo-old mutant mice, levels of mtDNA were significantly reduced in kidney (26%) and liver (71%) compared with wild-type animals (Fig. 2). Changes in mtDNA were disproportionately reduced relative to changes in mitochondrial mass as assessed by CS activity.
Figure 2.

MtDNA levels normalized to GADPH (nuclear DNA) in brain (A), kidney (B), liver (C), and muscle (D) of 1-, 4-, and 6-mo-old animals; 3 mutant (MUT) vs. 3 wild type (WT). Values are expressed as mean ± sd percentage of control. *P ≤ 0.05; **P ≤ 0.01.
Adenine nucleotide levels
In 1-mo-old mutant mice, ATP concentration and ATP/ADP ratio trended downwards in liver, and muscle, and trended upwards in brain (Fig. 3). In 4-mo-old mutant animals, ATP concentration and ATP/ADP ratio were significantly decreased in kidney, slightly decreased in muscle, and slightly increased in brain and liver (Fig. 3). In 6-mo-old animals, ATP levels and ATP/ADP ratio were significantly decreased in kidney and brain but were increased in liver and muscle (Fig. 3).
Figure 3.

ATP level (left panels) and ATP/ADP ratio (right panels) in brain (A), kidney (B), liver (C), and muscle (D) of 1-, 4-, and 6-mo-old animals; 3 mutant (MUT) vs. 3 wild type (WT). Values are expressed as mean ± sd concentration (nmol/mg protein). *P ≤ 0.05; **P ≤ 0.01.
Morphology
H&E-stained kidney of 1- and 4-mo-old Pdss2kd/kd mice showed no abnormalities (Fig. 4A, C, E, G), while 6 mo-old Pdss2kd/kd mice showed the previously described tubulo-interstitial nephritis and collapsing glomerulopathy that were absent in wild-type and heterozygous mutant littermates (Fig. 5A, E). COX and SDH staining of kidney were normal at all ages (data not shown).
Figure 4.

Renal histology of 1-mo-old (A–D) and 4-mo-old (E–H) wild-type (WT) and mutant (MUT) animals. A, C, E, G) H&E staining of paraffin-embedded kidney tissue, showing no differences between mutant (A, E) and wild-type (C, G) animals. B, D, F, H) Red fluorescence in kidney of mutant (B, F) and wild-type (D, H) mice intraperitoneally injected with dihydroethidine, showing increased signal in the mutant mice.
Figure 5.

Renal histology of 6-mo-old wild-type (WT) and mutant (MUT) animals. A, E) H&E staining of paraffin-embedded kidney, showing interstitial nephritis and collapsing glomerulopathy in mutant (A) but not wild-type (E) tissue. B, F) WT-1 immunostaining, demonstrating reduced expression in mutant (B) compared to wild-type (F) animals. C, G) Oxidative damage assessed using anti-nitrotyrosine antibody in a representative glomerulus of mutant (C) and wild-type (G) kidney. D, H) Lipid peroxidation assessed using anti-4-HNE antiserum in a representative glomerulus of mutant (D) and wild-type (H) kidney.
In addition to severe nephropathy, 4- and 6-mo-old mice showed variable muscle abnormalities, including central nuclei and fiber-type grouping (3/5 of 4-mo-old mutants) and necrotic fibers (2/4 of 6-mo-old mutants) (Fig. 6A, D). Although biochemical activity of COX was reduced in muscle, COX and SDH histochemical reactions were normal in muscle of 1-, 4-, and, 6-mo-old mutant mice (data not shown). Morphology of liver (Fig. 7A, D), and brain was preserved (data not shown) and COX and SDH histochemistry revealed no abnormalities in both tissues (data not shown).
Figure 6.

Skeletal muscle histology. A, D) H&E staining in 6-mo old mutant (MUT; A) and wild-type (WT; D) animals, showing signs of myopathy. B, C, E, F) ET staining in 4-mo old (B, E) and 6-mo-old (C, F) mutant (B, C) and wild-type (E, F) animals, showing increased signal in 4-mo-old mutants (B).
Figure 7.
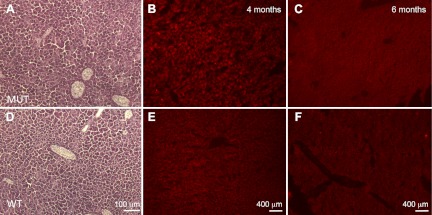
Liver histology. A, D) H&E staining in 6-mo old mutant (MUT; A) and wild-type (WT; D) animals, showing normal liver architecture. B, C, E, F) ET staining in 4-mo old (B, E) and 6-mo-old (C, F) mutant (B, C) and wild-type (E, F) animals, showing no significantly increased signal in mutant hepatocytes (B, C).
Oxidative stress assessment
After intraperitoneal injection of ET, kidney of 1-mo-old Pdss2kd/kd mice showed markedly increased fluorescence, indicating elevated ROS production compared to wild-type kidney (mutant 310.2±103.9 vs. wild-type 191.3±30.4; Fig. 4B, D), while comparable levels of fluorescence were observed in other tissues of mutant and wild-type animals. Pdss2kd/kd mice (4 mo old) compared with wild-type mice showed increased ROS production in kidney (mutant 77.1±52 vs. wild-type 47.2±36.6; Fig. 4F, H) and muscle (35.5±4.6 vs. 28.2±6; Fig. 6B, E). However, liver of 4-mo-old Pdss2kd/kd mice did not show increased ROS (40±5 vs. 53.7±17), as well as muscle and liver of 6-mo-old mutant mice (muscle: 8.75±4.7 vs. 8.6±0.7; liver: 34.3±6.6 vs. 33.3±9.7) (Figs. 6C, F and 7B, C, E, F). Kidney of 6-mo-old Pdss2kd/kd animals showed tissue loss and lower fluorescence relative to kidney of wild-type littermates (28.4±3.6 vs. 56.6±12; data not shown). Brain did not show increased ET staining in 1-, 4-, and 6-mo-old mutant and wild-type mice (data not shown).
Markers of oxidative damage in kidney
Immunostaining with anti-WT1 antibody showed normal numbers of podocytes in kidney of 4-mo-old Pdss2kd/kd and wild-type animals (data not shown), while reduced WT1 expression indicated podocyte damage in the most affected 6-mo-old animals (Fig. 5B, F). Anti-nitrotyrosine and anti-4HNE immunostainings, markers of oxidative stress, were increased in sclerotic glomeruli, dilated tubuli, microcystic formations, and in some of the otherwise morphologically normal proximal and distal tubuli adjacent to the affected areas of kidney in 6-mo-old mutant animals compared to wild type, indicating oxidative damage in the glomeruli of mutant mice (Fig. 5C, D, G, H). The severity of the pathology varied among the mutant animals at 6 mo. Anti-nitrotyrosine and anti-4HNE immunostaining were comparable in 1- and 4-mo-old mutant and wild-type mice (data not shown). Assessment of lipid peroxidation by colorimetric assay in kidney and liver homogenates did not show any differences between 1-, 4-, and 6-mo-old mutant and wild-type animals (Supplemental Tables S1 and S2).
DISCUSSION
Primary CoQ10 deficiencies in humans are due to mutations in genes required for the biosynthesis of CoQ10 and typically present as infantile multisystemic disorders, which include encephalonephropathy (typically steroid-resistant nephrotic syndrome) and deficiency of CoQ10 in muscle and skin fibroblasts (2). In addition, steroid-resistant nephrotic syndrome has been observed in isolation in patients with mutations in COQ2 and in association with hearing loss in 13 reported patients with COQ6 mutations (19, 20). In contrast to human patients, Pdss2 kd/kd mice manifest only nephrotic syndrome, due to glomerular podocyte pathology (9). Like human patients with CoQ10 deficiency, these mutant mice have partial CoQ deficiency because complete block of biosynthesis is presumably incompatible with life, as indicated by embryonic lethality of Pdss2-knockout animals and Clk-1/Coq7-knockout mice [null for the ortholog of COQ7, the hydroxylase that converts demethoxybiquinone (DMQ) into 5-hydroxyubiquinone; refs. 9, 21–23).
In agreement with the diverse clinical presentations associated with a variety of molecular defects in CoQ biosynthesis, in vitro studies have demonstrated heterogeneous pathogenic mechanisms, including oxidative stress in CoQ-deficient human and yeast cells (4, 5, 24–29). This study of Pdss2kd/kd mice has directly demonstrated for the first time that, despite widespread CoQ9 deficiency and respiratory chain enzyme abnormalities, only affected organs showed signs of increased oxidative stress. In particular, we observed increased ROS production in kidney of 1- and 4-mo-old Pdss2kd/kd animals and oxidative stress damage in the kidney of 6-mo-old mutant mice. The oxidative damage is focal and mainly affects glomeruli, thereby accounting for the absence of increased lipid peroxidation in whole-kidney homogenates of Pdss2kd/kd mice observed by us and by others (8, 30). A potential target of ROS is mtDNA, which is supported by our observation of depletion of mtDNA in kidney of 4- and 6-mo-old Pdss2kd/kd mice. Further evidence of oxidative stress was the observation of increased ROS and mild histopathology in muscle of 4-mo-old mutant animals.
These observations lead us to hypothesize that kidney-specific loss of damaged mitochondria—as shown by decreased CS activity—causes renal failure in Pdss2kd/kd mice. Evidence of enhanced mitophagy in kidney and, to a lesser extent, in liver of mutant mice and in cell culture models of human CoQ10 deficiency have also been reported; however, it is unclear whether this process is pathogenic or protective (9). The important role of podocyte dysfunction in the pathogenesis of the disease in Pdss2kd/kd mutant mice is supported by our data showing loss of WT1 antibody (podocyte-specific) immunoreactivity in 6-mo-old mutant mice (end stage of disease). Supporting the notion that podocyte pathology initiates kidney disease in CoQ deficiency are observations of Peng et al. (9) that podocyte-specific Pdss2 knockout (Podocin/cre, Pdss2loxP/loxP) mice manifest renal disease that was not observed in conditional Pdss2 knockout of renal tubular epithelium, monocytes, or hepatocytes. Moreover, loss of podocyte integrity and accumulation of protein markers of oxidative stress seem to play important roles in the pathogenesis of multiple genetic and acquired forms of glomerular diseases and end-stage kidney disease (31).
Therapeutic studies of Pdss2 mutant mice have also indirectly supported the pathogenic role of oxidative stress in CoQ-deficient tissues. Although Falk et al. (30) did not find evidence of oxidative stress in Pdss2kd/kd and in liver conditional-knockout mutant mice, they hypothesized that the therapeutic mechanism of action of probucol and CoQ10 is likely to be via antioxidant effects, because both agents failed to improve mitochondrial respiratory capacity (11, 30).
Interestingly, embryonic stem cells from Clk-1/Coq7-knockout mice have revealed mild reductions of oxygen consumption and complex I+III activity, suggesting that severe impairment of mitochondrial respiration is not the primary cause of the in vivo embryonic lethality in homozygous mutant mice (21). Instead, as observed in kidney of Pdss2kd/kd mice, Coq7-deficient mouse embryos demonstrated ultrastructural evidence of mitophagy, enlarged mitochondria with vesicular cristae, and enlarged lysosomes filled with disrupted membranes (22), suggesting that other forms of damage to mitochondria, such as oxidative stress, cause embryonic lethality in Coq7-knockout animals.
Unexpectedly, we observed increased activities of respiratory chain enzymes in clinically unaffected organs, especially liver, at early stages of CoQ9 deficiency. These results, together with observations of Falk et al. (30) demonstrating altered PPAR pathway in Pdss2kd/kd mouse liver, suggest that CoQ deficiency and consequent respiratory chain defects trigger compensatory mechanisms, including enhanced mitochondrial biogenesis with concomitant increased mitochondrial activity, as demonstrated in other animal models of mitochondrial disease (18, 32). Because in vitro studies of CoQ10 deficient human cells have shown that severe impairment of the respiratory chain can be less detrimental than mild respiratory chain dysfunction, we hypothesize that compensatory mechanisms may have deleterious effects by provoking late-onset increased ROS production, which damages organs, such as liver and muscle. In contrast, murine brain with severe CoQ9 deficiency did not show evidence of increased ROS production and was not clinically or functionally affected. We observed increased ROS in kidney of 1-mo-old animals; the early onset of the pathogenic process in kidney of Pdss2kd/kd mice likely accounts for the severe renal manifestations compared with other organs. The kidney damage in young Pdss2kd/kd mice might be triggered by the early onset of CoQ9 deficiency in kidney relative to other organs, as suggested by Saiki et al. (11). Alternatively, renal susceptibility may be due to lack of compensatory mechanisms, extreme sensitivity to oxidative damage, or both. Supporting the notion that the nephropathology is due to heightened vulnerability is our observation that other organs, such as brain and muscle, in 1 mo-old Pdss2kd/kd mice have reduced CoQ9 levels but show little or no histochemical or biochemical defects. Because we measured CoQ9 in whole-tissue homogenates, we cannot exclude other factors that might potentially influence tissue specificity of the disease, such as levels of CoQ9 within mitochondria, COQ9/COQ10 ratio, or α-tocopherol levels (33).
In summary, our data provide the first direct evidence of increased ROS production in the affected organs in an animal model of CoQ deficiency and confirm our prior observations in cultured fibroblasts that severe CoQ deficiency is associated with marked bioenergetic defects without significant oxidative stress, whereas intermediate CoQ deficiency causes moderate bioenergetic defects but marked increase in ROS production and oxidative stress. Thus, tissue-specific oxidative stress appears to play a critical role in the pathogenesis of CoQ deficiency, independently of the primary molecular defect, and compensatory up-regulation of mitochondrial biogenesis may contribute to the phenotype.
Supplementary Material
Acknowledgments
The authors appreciate the kind gift of CBA-Pdss2kd/J from Dr. David Gasser (University of Pennsylvania, Philadelphia, PA, USA) and helpful advice from Drs. Vernice Jackson-Lewis, Vivette D. D'Agati, and Luis Lopez Garcia.
The project described was supported by grants 1R01HD057543 (M.H.) and K23HD065871 (C.M.Q.) from the Eunice Kennedy Shriver National Institute of Child Health and Human Development (NICHD). M.H. is supported by U.S. National Institutes of Health grants R01HD056103 and 1RC1NS070232, by a Muscular Dystrophy Association grant, and by the Marriott Mitochondrial Disorder Clinical Research Fund (MMDCRF).
This article includes supplemental data. Please visit http://www.fasebj.org to obtain this information.
- 4HDA
- 4-hydroxyalkenal
- 4-HNE
- 4-hydroxynonenal
- 4-NB
- 4-nitrobenzoate
- CS
- citrate synthase
- COOQ2
- polyprenyl-diphosphate:4-HB transferase
- CoQ
- coenzyme Q
- COX
- cytochrome c oxidase
- cyt c
- cytochrome c
- ET
- dihydroethidine
- H&E
- hematoxylin and eosin
- HPLC
- high-performance liquid chromatography
- LPO
- lipid peroxidation
- MDA
- malondialdehyde
- mtDNA
- mitochondrial DNA
- PBS
- phosphate-buffered saline
- PDSS
- polyprenyl-diphosphate synthase
- PDSS2
- decaprenyl diphosphate synthase subunit 2
- SDH
- succinate dehydrogenase.
REFERENCES
- 1. Tran U. C., Clarke C. F. (2007) Endogenous synthesis of coenzyme Q in eukaryotes. Mitochondrion 7(Suppl.), S62–S71 [DOI] [PMC free article] [PubMed] [Google Scholar]
- 2. Emmanuele V., López L. C., Berardo A., Naini A., Tadesse S., Wen B., D'Agostino E., Solomon M., DiMauro S., Quinzii C., Hirano M. (2012) Heterogeneity of coenzyme Q10 deficiency: patient study and literature review. Arch. Neurol. 69, 978–983 [DOI] [PMC free article] [PubMed] [Google Scholar]
- 3. Lopez L. C., Schuelke M., Quinzii C. M., Kanki T., Rodenburg R. J., Naini A., DiMauro S., Hirano M. (2006) Leigh syndrome with nephropathy and CoQ10 deficiency due to decaprenyl diphosphate synthase subunit 2 (PDSS2) mutations. Am. J. Hum. Genet. 79, 1125–1129 [DOI] [PMC free article] [PubMed] [Google Scholar]
- 4. Quinzii C. M., Lopez L. C., Von-Moltke J., Naini A., Krishna S., Schuelke M., Salviati L., Navas P., DiMauro S., Hirano M. (2008) Respiratory chain dysfunction and oxidative stress correlate with severity of primary CoQ10 deficiency. FASEB J. 22, 1874–1885 [DOI] [PMC free article] [PubMed] [Google Scholar]
- 5. Quinzii C. M., Lopez L. C., Gilkerson R. W., Dorado B., Coku J., Naini A. B., Lagier-Tourenne C., Schuelke M., Salviati L., Carrozzo R., Santorelli F., Rahman S., Tazir M., Koenig M., DiMauro S., Hirano M. (2010) Reactive oxygen species, oxidative stress, and cell death correlate with level of CoQ10 deficiency. FASEB J. 24, 3733–3743 [DOI] [PMC free article] [PubMed] [Google Scholar]
- 6. Quinzii C. M., Tadesse S., Naini A., Hirano M. (2012) Effects of inhibiting CoQ(10) biosynthesis with 4-nitrobenzoate in human fibroblasts. PLoS One 7, e30606. [DOI] [PMC free article] [PubMed] [Google Scholar]
- 7. Hallman T. M., Peng M., Meade R., Hancock W. W., Madaio M. P., Gasser D. L. (2006) The mitochondrial and kidney disease phenotypes of kd/kd mice under germfree conditions. J. Autoimmun. 26, 1–6 [DOI] [PMC free article] [PubMed] [Google Scholar]
- 8. Peng M., Jarett L., Meade R., Madaio M. P., Hancock W. W., George A. L., Jr., Neilson E. G., Gasser D. L. (2004) Mutant prenyltransferase-like mitochondrial protein (PLMP) and mitochondrial abnormalities in kd/kd mice. Kidney Int. 66, 20–28 [DOI] [PMC free article] [PubMed] [Google Scholar]
- 9. Peng M., Falk M. J., Haase V. H., King R., Polyak E., Selak M., Yudkoff M., Hancock W. W., Meade R., Saiki R., Lunceford A. L., Clarke C. F., Gasser D. L. (2008) Primary coenzyme Q deficiency in Pdss2 mutant mice causes isolated renal disease. PLoS Genet. 4, e1000061. [DOI] [PMC free article] [PubMed] [Google Scholar]
- 10. Ziegler C. G., Peng M., Falk M. J., Polyak E., Tsika E., Ischiropoulos H., Bakalar D., Blendy J. A., Gasser D. L. (2012) Parkinson's disease-like neuromuscular defects occur in prenyl diphosphate synthase subunit 2 (Pdss2) mutant mice. Mitochondrion 12, 248–257 [DOI] [PMC free article] [PubMed] [Google Scholar]
- 11. Saiki R., Lunceford A. L., Shi Y., Marbois B., King R., Pachuski J., Kawamukai M., Gasser D. L., Clarke C. F. (2008) Coenzyme Q10 supplementation rescues renal disease in Pdss2kd/kd mice with mutations in prenyl diphosphate synthase subunit 2. Am. J. Physiol. Renal Physiol. 295, F1535–F1544 [DOI] [PMC free article] [PubMed] [Google Scholar]
- 12. Lyon M. F., Hulse E. V. (1971) An inherited kidney disease of mice resembling human nephronophthisis. J. Med. Genet. 8, 41–48 [DOI] [PMC free article] [PubMed] [Google Scholar]
- 13. DiMauro S., Serveidei S., Zeviani M., DiRocco M., De Vivo D. C., DiDonato S., Uziel G., Berry K., Hoganson G., Johnsen S. D., Johnson P. C. (1987) Cytochrome c oxidase deficiency in Leigh syndrome. Ann. Neurol. 22, 498–506 [DOI] [PubMed] [Google Scholar]
- 14. Manfredi G., Yang L., Gajewski C. D., Mattiazzi M. (2002) Measurements of ATP in mammalian cells. Methods 26, 317–326 [DOI] [PubMed] [Google Scholar]
- 15. Tanji K., Bonilla E. (2008) Light microscopic methods to visualize mitochondria on tissue sections. Methods 46, 274–280 [DOI] [PubMed] [Google Scholar]
- 16. Wu D. C., Teismann P., Tieu K., Vila M., Jackson-Lewis V., Ischiropoulos H., Przedborski S. (2003) NADPH oxidase mediates oxidative stress in the 1-methyl-4-phenyl-1,2,3,6-tetrahydropyridine model of Parkinson's disease. Proc. Natl. Acad. Sci. U. S. A. 100, 6145–6150 [DOI] [PMC free article] [PubMed] [Google Scholar]
- 17. Kalyanaraman B., Darley-Usmar V., Davies K. J., Dennery P. A., Forman H. J., Grisham M. B., Mann G. E., Moore K., Roberts L. J., 2nd, Ischiropoulos H. (2012) Measuring reactive oxygen and nitrogen species with fluorescent probes: challenges and limitations. Free Radic. Biol. Med. 52, 1–6 [DOI] [PMC free article] [PubMed] [Google Scholar]
- 18. Dorado B., Area E., Akman H. O., Hirano M. (2011) Onset and organ specificity of Tk2 deficiency depends on Tk1 down-regulation and transcriptional compensation. Hum. Mol. Genet. 20, 155–164 [DOI] [PMC free article] [PubMed] [Google Scholar]
- 19. Diomedi-Camassei F., Di Giandomenico S., Santorelli F. M., Caridi G., Piemonte F., Montini G., Ghiggeri G. M., Murer L., Barisoni L., Pastore A., Muda A. O., Valente M. L., Bertini E., Emma F. (2007) COQ2 nephropathy: a newly described inherited mitochondriopathy with primary renal involvement. J. Am. Soc. Nephrol. 18, 2773–2780 [DOI] [PubMed] [Google Scholar]
- 20. Heeringa S. F., Chernin G., Chaki M., Zhou W., Sloan A. J., Ji Z., Xie L. X., Salviati L., Hurd T. W., Vega-Warner V., Killen P. D., Raphael Y., Ashraf S., Ovunc B., Schoeb D. S., McLaughlin H. M., Airik R., Vlangos C. N., Gbadegesin R., Hinkes B., Saisawat P., Trevisson E., Doimo M., Casarin A., Pertegato V., Giorgi G., Prokisch H., Rotig A., Nurnberg G., Becker C., Wang S., Ozaltin F., Topaloglu R., Bakkaloglu A., Bakkaloglu S. A., Muller D., Beissert A., Mir S., Berdeli A., Varpizen S., Zenker M., Matejas V., Santos-Ocana C., Navas P., Kusakabe T., Kispert A., Akman S., Soliman N. A., Krick S., Mundel P., Reiser J., Nurnberg P., Clarke C. F., Wiggins R. C., Faul C., Hildebrandt F. (2011) COQ6 mutations in human patients produce nephrotic syndrome with sensorineural deafness. J. Clin. Invest. 121, 2013–2024 [DOI] [PMC free article] [PubMed] [Google Scholar]
- 21. Levavasseur F., Miyadera H., Sirois J., Tremblay M. L., Kita K., Shoubridge E., Hekimi S. (2001) Ubiquinone is necessary for mouse embryonic development but is not essential for mitochondrial respiration. J. Biol. Chem. 276, 46160–46164 [DOI] [PubMed] [Google Scholar]
- 22. Nakai D., Shimizu T., Nojiri H., Uchiyama S., Koike H., Takahashi M., Hirokawa K., Shirasawa T. (2004) coq7/clk-1 regulates mitochondrial respiration and the generation of reactive oxygen species via coenzyme Q. Aging Cell 3, 273–281 [DOI] [PubMed] [Google Scholar]
- 23. Stenmark P., Grunler J., Mattsson J., Sindelar P. J., Nordlund P., Berthold D. A. (2001) A new member of the family of di-iron carboxylate proteins. Coq7 (clk-1), a membrane-bound hydroxylase involved in ubiquinone biosynthesis. J. Biol. Chem. 276, 33297–33300 [DOI] [PubMed] [Google Scholar]
- 24. Geromel V., Kadhom N., Ceballos-Picot I., Chretien D., Munnich A., Rötig A., Rustin P. (2001) Human cultured skin fibroblasts survive profound inherited ubiquinone depletion. Free Radic. Res. 35, 11–21 [DOI] [PubMed] [Google Scholar]
- 25. Geromel V., Rotig A., Munnich A., Rustin P. (2002) Coenzyme Q10 depletion is comparatively less detrimental to human cultured skin fibroblasts than respiratory chain complex deficiencies. Free Radic. Res. 36, 375–379 [DOI] [PubMed] [Google Scholar]
- 26. Lopez L. C., Quinzii C. M., Area E., Naini A., Rahman S., Schuelke M., Salviati L., Dimauro S., Hirano M. (2010) Treatment of CoQ(10) deficient fibroblasts with ubiquinone, CoQ analogs, and vitamin C: time- and compound-dependent effects. PLoS One 5, e11897. [DOI] [PMC free article] [PubMed] [Google Scholar]
- 27. Lopez-Martin J. M., Salviati L., Trevisson E., Montini G., DiMauro S., Quinzii C., Hirano M., Rodriguez-Hernandez A., Cordero M. D., Sanchez-Alcazar J. A., Santos-Ocana C., Navas P. (2007) Missense mutation of the COQ2 gene causes defects of bioenergetics and de novo pyrimidine synthesis. Hum. Mol. Genet. 16, 1091–1097 [DOI] [PMC free article] [PubMed] [Google Scholar]
- 28. Rodriguéz-Hernandez A., Cordero M. D., Salviati L., Artuch R., Pineda M., Briones P., Gómez Izquierdo L., Cotán D., Navas P., Sánchez-Alcázar J. A. (2009) Coenzyme Q deficiency triggers mitochondrial degradation by mitophagy. Autophagy 5, 19–32 [DOI] [PubMed] [Google Scholar]
- 29. Larsen P. L., Clarke C. F. (2002) Extension of life-span in Caenorhabditis elegans by a diet lacking coenzyme Q. Science 295, 120–123 [DOI] [PubMed] [Google Scholar]
- 30. Falk M. J., Polyak E., Zhang Z., Peng M., King R., Maltzman J. S., Okwuego E., Horyn O., Nakamaru-Ogiso E., Ostrovsky J., Xie L. X., Chen J. Y., Marbois B., Nissim I., Clarke C. F., Gasser D. L. (2011) Probucol ameliorates renal and metabolic sequelae of primary CoQ deficiency in Pdss2 mutant mice. EMBO Mol. Med. 3, 410–427 [DOI] [PMC free article] [PubMed] [Google Scholar]
- 31. Liu Y. (2009) Advanced oxidation protein products: a causative link between oxidative stress and podocyte depletion. Kidney Int. 76, 1125–1127 [DOI] [PubMed] [Google Scholar]
- 32. Viscomi C., Spinazzola A., Maggioni M., Fernandez-Vizarra E., Massa V., Pagano C., Vettor R., Mora M., Zeviani M. (2009) Early-onset liver mtDNA depletion and late-onset proteinuric nephropathy in Mpv17 knockout mice. Hum. Mol. Genet. 18, 12–26 [DOI] [PMC free article] [PubMed] [Google Scholar]
- 33. Sohal R. S., Forster M. J. (2007) Coenzyme Q, oxidative stress and aging. Mitochondrion 7(Suppl.), S103–S111 [DOI] [PMC free article] [PubMed] [Google Scholar]
Associated Data
This section collects any data citations, data availability statements, or supplementary materials included in this article.