

Abstract
μ-Opioid receptor (MOR) level is directly related to the function of opioid drugs, such as morphine and fentanyl. Although agonist treatment generally does not affect transcription of mor, previous studies suggest that morphine can affect the translation efficiency of MOR transcript via microRNAs (miRNAs). On the basis of miRNA microarray analyses of the hippocampal total RNA isolated from mice chronically treated with μ-opioid agonists, we found a miRNA (miR-339-3p) that was consistently and specifically increased by morphine (2-fold) and by fentanyl (3.8-fold). miR-339-3p bound to the MOR 3′-UTR and specifically suppressed reporter activity. Suppression was blunted by adding miR-339-3p inhibitor or mutating the miR-339-3p target site. In cells endogenously expressing MOR, miR-339-3p inhibited the production of MOR protein by destabilizing MOR mRNA. Up-regulation of miR-339-3p by fentanyl (EC50=0.75 nM) resulted from an increase in primary miRNA transcript. Mapping of the miR-339-3p primary RNA and its promoter revealed that the primary miR-339-3p was embedded in a noncoding 3′-UTR region of an unknown host gene and was coregulated by the host promoter. The identified promoter was activated by opioid agonist treatment (10 nM fentanyl or 10 μM morphine), a specific effect blocked by the opioid antagonist naloxone (10 μM). Taken together, these results suggest that miR-339-3p may serve as a negative feedback modulator of MOR signals by regulating intracellular MOR biosynthesis.—Wu, Q., Hwang, C. K., Zheng, H., Wagley, Y., Lin, H.-Y., Kim, D. K., Law, P.-Y., Loh, H. H., Wei, L.-N. MicroRNA 339 downregulates mu opioid receptor at the post-transcriptional level in response to opioid treatment.
Keywords: fentanyl, morphine, promoter, UTR
Opioid drugs, such as morphine and fentanyl, are commonly used to treat pain. The pharmacological effects of opioids are mediated through opioid receptors. Among the three major types of opioid receptors (μ, δ, and κ), the μ-opioid receptor (MOR) plays a key role in mediating both the clinical effects of opioids and their undesirable side effects, such as the development of opioid tolerance and opioid dependence after chronic treatment (1). Thus, it is important to understand the molecular mechanisms of MOR regulation. At the molecular level, tolerance mainly occurs via three well-described phenomena: desensitization, when the activated receptor is phosphorylated by a G-protein-coupled receptor kinase and associates with β-arrestin, which facilitates the uncoupling of the receptor–G-protein complex; internalization, when the receptor translocates from the membrane to the cytosol via clathrin-coated pits and dynamin; and down-regulation, manifested by an overall decrease in receptor numbers (2). In a classical model, down-regulation results primarily from either lysosomal or proteosomal degradation of the receptor following sequestration and phosphorylation, and accumulating evidence has demonstrated the roles of several factors, including protein kinase C (PKC; ref. 3), MAPK (4), and Ca2+/calmodulin-dependent protein kinase (5). However, a direct link between receptor biosynthesis and down-regulation remains unresolved.
The down-regulation of MOR results from increased receptor degradation or decreased receptor synthesis (6). MOR expression is regulated transcriptionally (7), post-transcriptionally (8), and epigenetically (9, 10). Emerging studies have begun to explore post-transcriptional regulation as a molecular mechanism for MOR down-regulation. Our group has previously reported that long-term morphine exposure induces expression of microRNA (miRNA)-23b (miR-23b), which binds to the 3′-untranslated region (3′-UTR) of MOR mRNA and represses MOR translation (11, 12). This suggests a pathway that transduces the agonist-activated receptor signal to intracellular receptor synthesis through small RNA regulators. Another group has recently published similar findings for let-7 miRNA and further demonstrated that decreasing endogenous brain let-7 levels can attenuate opioid antinociceptive tolerance in mice (13). Nonetheless, how opioid signaling regulates the expression of these miRNAs remains unknown.
In general, MOR mRNA is uniquely distributed in the brain and correlates with its protein expression patterns, as shown by autoradiography and immunohistochemical studies (14, 15). Some brain regions, however, have higher levels of mRNA and fewer μ-opioid binding sites or vice versa (14). This discrepancy was also observed in antagonist-treated brain regions (16). Although there are many possible explanations, including different sensitivities of the detection methods, RNA transport, and existence of MOR isoforms (17), it is also possible that MOR in the brain is regulated post-transcriptionally by RNA binding factors or microRNAs.
miRNAs are short noncoding RNAs that regulate gene expression post-transcriptionally and sequence specifically. miRNAs are found in almost all bioorganisms and affect both the stability and translation of mRNAs. miRNAs are predicted to target ≥30% of protein-coding genes (18) and are involved in almost all cellular functions and regulate gene expression mainly by binding to the 3′-UTRs of targeted mRNAs.
On the other hand, the expression of miRNA itself is subject to transcriptional and post-transcriptional regulations. In the canonical miRNA maturation pathway, miRNA gene is usually transcribed by RNA polymerase II, producing primary miRNA (pri-miRNA). The pri-miRNA is cleaved by Drosha to generate precursor miRNA (pre-miRNA; refs. 19–21). Pre-miRNA is transported from the nucleus to the cytoplasm by Exportin5 (22) and is further processed by DICER to produce mature miRNA (23). Expression of miRNAs can undergo pronounced changes in response to stress from pathological stimuli, allowing them to serve as fine tuners of gene expression (18).
Our laboratory previously performed a miRNA microarray to analyze the global changes of endogenous miRNA induced by opioid agonists in the MOR-expressing mouse brain regions (24). In this study, we investigated a miRNA, miR-339-3p, which was up-regulated by agonist treatment and has a putative binding site in the MOR 3′-UTR. We also focused on identifying the opioid signaling pathway that regulates the miR-339-3p in response to agonist treatment.
MATERIALS AND METHODS
Reagents
Ly294002, PD98059, 4-amino-5-(4-chlorophenyl)-7-(t-butyl)pyrazolo[3,4-d]pyrimidine (PP2), bisindolymaleimide I (GF109203X), and 1-[6-[((17β)-3-methoxyestra-1,3,5[10]-trien-17-yl)amino]hexyl]-1H-pyrrole-2,5-dione (U73122) were purchased from EMD Biosciences (Gibbstown, NJ, USA). KT5720 was purchased from Cell Signaling Technology (Beverly, MA, USA). Pertussis toxin (PTX) was purchased from Sigma (St. Louis, MO, USA).
Cell culture and plasmid construction
Mouse neuroblastoma Neuro2A (N2A) cells and human embryonic kidney (HEK) 293T cells were maintained in Advanced DMEM (Invitrogen, Carlsbad, CA, USA) with 5% heat-inactivated FBS at 37°C in an atmosphere of 10% and 5% CO2, respectively. N2A cells expressing hemagglutinin (HA)-tagged mouse MOR protein (25) were maintained in the same medium supplemented with 0.02% geneticin (G418). Transfections were performed using Lipofectamine 2000 (Invitrogen), as described previously (11).
To clone a precursor of miR-339 in an expression vector, we designed polymerase chain reaction (PCR) primers, pSuper339-S and pSuper339-AS (see Table 1), based on mouse miR-339 genomic sequences obtained from the U.S. National Center for Biotechnology Information (NCBI) database (NC_000071.5; −strand; location 139,843,604 to 139,847,699 bp in mouse chromosome 5). The DNA fragment of miR-339 precursor was generated by using 1 μg of each of the forward and reverse primers (pSuper339-S and pSuper339-AS) for nontemplate PCR at 95°C for 20 s, 37°C for 20 s, 68°C for 10 s, for 15 cycles. The resulting PCR fragment was digested by BglII/XhoI restriction enzymes and inserted into the corresponding BglII/XhoI sites of pSuper plasmid (a gift from Dr. Yan Zeng, University of Minnesota, Minneapolis, MN, USA), designated pSuper-339 plasmid. Plasmid pSuper-224 was generated following the same protocol using a different PCR primer set, pSuper224-S and pSuper224-AS (Table 1). pMUTR and pSuper-23b were constructed as described previously (11). The mutated construct, pMUTR339-mut (miR-339-3p target site mutated), was generated by mutating the seed match sequence (5′-GAGGCGCT-3′; see Fig. 1B) of miR-339-3p target site in pMUTR to 5′-ACTAGATC-3′ using QuikChange site-directed mutagenesis kit (Stratagene, La Jolla, CA, USA).
Table 1.
Primers used in this study
| Name | Primer, 5′ → 3′ | Notes |
|---|---|---|
| pri-339-S | TGACTGCAGAAGGACCTGTG | |
| pri-339-AS | ATGTCACTTAAGCCCCATGC | |
| pSuper224-S | AGCAGATCTGGGCTTTTAAGTCACTAGTGGTTCCGTTTAGTAGATGGTTTGTGCATT | BglII site underlined |
| pSuper224-AS | GACCTCGAGGGGCTTTGTAGTCACTAGGGCACCATTTTGAAACAATGCACAAACCATC | XhoI site underlined |
| pSuper339-S | AGCAGATCTACGGGGTGGCCACTATCCCTGTCCTCCAGGAGCTCACGTATGCCTGCCTGTGAGCGC | BglII site underlined |
| pSuper339-AS | GACCTCGAGGTGGACAGTGCAGGGGTGGACACCGGCT CTGTCGCCGAGGCGCTCACAGGCAGG | XhoI site underlined |
| mi339PmXba-S | AAACTAGCGGCCGCCTGTCAGGGTTTGTGGGAGGCGCTGGTT | Seed match in italic |
| mi339PmXba-AS | CTAGAACCAGCGCCTCCCACAAACCCTGACAGGCGGCCGCTAGTTT | NotI site underlined |
| mi339mPmXba-S | AAACTAGCGGCCGCCTGTCAGGGTTTGTGGGAtcactgGGTT | Mutation site in lowercase |
| mi339mPmXba-AS | CTAGAACCcagtgaTCCCACAAACCCTGACAGGCGGCCGCTAGTTT | Mutation site in lowercase |
| 339g-S | GGTGTCTAACTTAGTGTTTCTAA | |
| 339g-AS | CTGAGCACCCTGGTCTGCAGGCA | |
| 339p-S1a | CCGGCTAGcCTGATGGAAGCAGCTT | NheI underlined |
| 339p-AS1a | ACGACCTCGaGTGGCTACAGAGCGA | XhoI underlined |
| 339p-S2a | GCCTGCTCCgCTAGCCTGGGTTTT | NheI underlined |
| 339p-AS2a | CTGGGTAAGTGACTCtCgAGCAATCC | XhoI underlined |
| 339p-S3a | GTGAGcTAGCAGTGGGAGAGGTTA | NheI underlined |
| 339p-AS3a | CACCCCcTCGAGCTCTGCACAGCT | XhoI underlined |
S and AS in the primer name indicate sense and antisense primers, respectively.
Mismatch sites are in lowercase to generate new restriction enzyme sites for promoter cloning.
Figure 1.
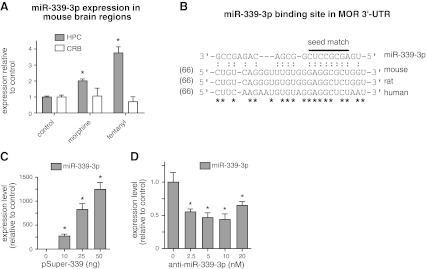
Induction of miR-339-3p by morphine and fentanyl in mouse brain. A) Increased expression of miR-339-3p in mouse hippocampus (HPC) treated with morphine or fentanyl and analyzed by microarray experiments. Drugs were administered at a rate of 1 μl/h for 3 d. Mice were treated with saline (control), 12 μg/h morphine, or 0.31 μg/h fentanyl. Each group involved 4 mice. Data were analyzed by 1-way ANOVA with post hoc Dunnett's test for comparisons. Values presented are compared to control values. B) Target site of miR-339-3p in the MOR 3′-UTR was conserved in mouse, rat, and human. Seed match (indicated by overbar) has more conserved sequences in those species. Numbers in parentheses indicate nucleotide distance downstream of MOR stop codon. Colon (:) indicates possible ribonucleotide binding between MOR 3′-UTR and miR-339-3p. C) pSuper-339 containing miR-339-3p was transfected into N2A-MOR cells, and expression of miR-339-3p was analyzed by real-time qRT-PCR. D) Anti-miR-339-3p decreased endogenous miR-339-3p expression. Anti-miR-339-3p was transfected into N2A-MOR cells and analyzed by real-time qRT-PCR. Graphs indicate the averages from ≥3 representative experiments. Asterisks in graphs indicate statistically significant findings. Error bars = se. *P < 0.05 vs. control.
To generate a plasmid containing the miR-339-3p target site fused to the 3′ end of a luciferase reporter, we used the dual luciferase pmirGLO vector (Promega, Madison, WI, USA). Oligonucleotides mi339PmXba-S and mi339PmXba-AS (Table 1) were annealed, and the resulting fragment was cloned into the PmeI/XbaI sites of pmirGLO, to generate pmirGLO339-wt containing the wild-type (wt) miR-339-3p target site. To mutate the miR-339-3p target site, annealed oligonucleotides mi339mPmXba-S and mi339mPmXba-AS (Table 1) were cloned into the same sites of pmirGLO, designated pmirGLO339-mut. All plasmids were confirmed by DNA sequencing and restriction enzyme analysis.
For miR-339-3p promoter cloning, full-length miR-339 genomic DNA (∼3.9 kb) was generated by PfuTurbo polymerase (Stratagene) using mouse genomic DNA (from C57BL6/129 strain) and primers 339g-S and 339g-AS (Table 1). Using the full-length genomic DNA as a PCR template, 3 DNA fragments (P1, P2, and P3; see Fig. 7B) were amplified by PCR using primers for P1 (339p-S1 and 339p-AS1; ∼1.2 kb), P2 (339p-S2 and 339p-AS2; ∼600 bp), and P3 (339p-S3 and 339p-AS3; ∼0.58 kb). The three PCR fragments were digested with NheI/XhoI and cloned into the same NheI/XhoI sites of pGL3 basic (Promega). All promoter plasmid constructs were confirmed by DNA sequencing, and the inserted DNA sequences were identical to the genomic DNA sequences originated from mouse strain C57BL/6.
Figure 7.
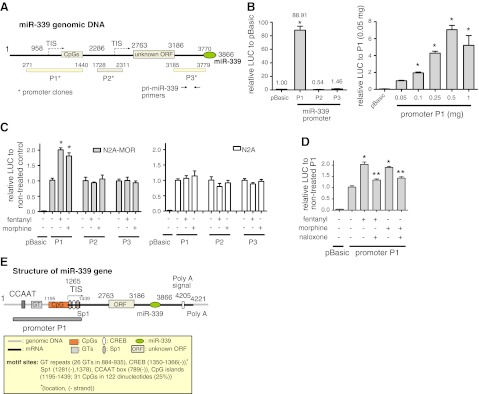
miR-339 promoter analysis. A) miR-339 region of the mouse genome based on mouse genomic sequences from the NCBI database. P1, P2, and P3 indicate the locations of DNA fragments used for miR-339 promoter analysis. Unknown ORF encodes a hypothetical protein of unknown function found from a RIKEN full-length enriched library (AK019591.1). Dotted arrows under TIS indicate putative TISs generated by promoter search programs. B) Left panel: N2A cells were transfected with 0.5 μg cloned promoter plasmids P1, P2, or P3. Cells were harvested 48 h after transfection, lysed, and assayed for luciferase activity. Results for promoter activity are given as luciferase activity normalized against cotransfected pCH110 β-galactosidase activity. Data are the means of 3 independent experiments; n ≥ 3. Error bars = se. *P < 0.05 vs. vector control (pBasic, 0.5 μg). Right panel: varying amounts of promoter P1 plasmid were transfected into N2A cells, and promoter activity was analyzed as above. Graphed values were obtained from each value relative to luciferase activity of P1 (0.05 μg). C) Fentanyl increased P1 promoter activity. N2A (right panel) and N2A-MOR (left panel) cells were transfected with 0.5 μg promoter plasmids P1, P2, or P3. At 48 h after transfection, cells were treated with 10 nM fentanyl or10 μM morphine for 4 h. Luciferase activity was analyzed as above; n ≥ 3. *P < 0.05 vs. vector control; 1-way ANOVA. D) Promoter P1 plasmid (0.5 μg) was transfected into N2A-MOR cells pretreated with 10 μM naloxone (for indicated samples) 1 h before being treated with 10 nM fentanyl or 10 μM morphine for 4 h, followed by analysis of the promoter activity as above. Vector plasmid pBasic was included as a negative control. *P<0.05 vs. nontreated P1, **P<0.05 vs. fentanyl- or morphine-treated P1 control; 2-way ANOVA. E) miR-339 gene structure based on analysis of several gene databases. Numbers in parentheses are locations of the motifs; − indicates the motif in an antisense direction.
Transfection and luciferase reporter assay
Transfection of promoter plasmids was performed with Lipofectamine 2000 (Invitrogen), according to the manufacturer's instructions. Cells were plated 24 h before transfection in 12-well plates for luciferase assay, as described previously (26, 27). Cells were transfected with 0.2 μg of a luciferase-containing plasmid, with treatments of fentanyl or morphine as detailed below and in the figure legends.
For the dual luciferase reporter assay, cells were plated at 0.5 × 10⁵ cells/well in 24-well plates 24 h before transfection; 0.5 ng Renilla luciferase plasmid pCMV-Rluc was included for normalization. Firefly luciferase and Renilla luciferase activities were determined by luminometer (Berthold, Oak Ridge, TN, USA) using dual-luciferase reporter assay systems (Promega), according to the manufacturer's protocol. Anti-miR-339 (AM13061) and negative control miRNA (AM17010) were purchased from Applied Biosystems (Austin, TX, USA).
For transfection in neuronal differentiated cells, embryonal carcinoma P19 cells were maintained in α-MEM with 7.5% FCS and 2.5% FBS, as described previously (28, 29). After treatment with retinoic acids, cells grown in suspension were transfected with plasmids or small RNAs using Lipofectamine 2000 reagent, as described previously (30) and according to the manufacturer's instructions. Briefly, 48 h after transfection, cells were plated at 2 × 10⁵ cells/well in 4-well chamber slides (Lab-Tek II, Nalge Nunc, Rochester, NY, USA) and subjected to immunocytochemistry. For flow cytometric analysis, cells were plated at 6 × 10⁶ cells/dish in 10-cm tissue culture dishes; cells were harvested at 4 d after plating (AP4d) and analyzed by flow cytometry. To assay RNA stability, cells were plated at 5 × 10⁵ cells/well in 12-well plates; at AP4d, the neuronal differentiated cells were treated with actinomycin-D (Act-D, 5 μg/ml) for 1 to 12 h. Analysis of mRNA decay profiles (with half-life) was performed as described previously (31, 32). Relative mRNA level of MOR mRNA was measured by real-time quantitative reverse transcription-PCR (qRT-PCR) using MOR primers MOR-E3-S and MOR-E4-AS (9).
Real-time quantitative PCR (qPCR) and qRT-PCR
RNA was isolated from transfected cells using TRI reagent (Molecular Research Center, Cincinnati, OH, USA) and treated with Turbo DNase I (2 U/μg RNA, Applied Biosystems). Reverse transcription-PCR (RT-PCR) was performed using a OneStep RT-PCR kit (Qiagen, Valencia, CA, USA) and the following primers: pri-339-S and pri-339-AS (Table 1) for pri-miR-339, mouse β-actin primers (29). PCR conditions were 30 cycles (for pri-miR-339) or 20 cycles (for β-actin) of 94°C for 1 min, 55°C for 1 min, and 72°C for 1 min, followed by 72°C for 10 min. PCR products were electrophoresed in 2% agarose gels, quantified by ImageQuant 5.2 (Amersham Biosciences, Piscataway, NJ, USA), and verified by DNA sequence analysis.
For real-time qPCR, miRNA-enriched RNA was extracted and reverse transcribed. One-tenth of the reverse transcription mix (40 ng RNA) was used for real-time qPCR (11). The miRNA primer sets for miR-339-3p and snoRNA234 (an internal control) (Applied Biosystems) were used for reverse transcription and qPCR. Real-time qPCR and qRT-PCR were performed on an iCycler (Bio-Rad Laboratories, Oakland, CA, USA) using either an iQ Supermix Kit (Bio-Rad) for miR-339-3p and snoRNA234 or a Quantitect SYBR Green RT-PCR kit (Qiagen) for pri-miR339 and β-actin. The relative expression levels of miR-339-3p normalized to those of snoRNA234 were calculated using the Gene Expression Macro (Bio-Rad), and the levels of pri-miR339 were calculated against those of β-actin. The specificity of qRT-PCR primers was determined using a melt curve after the amplification to show that only a single species of qPCR product was amplified from the reaction. The RT-PCR and real-time qRT-PCR experiments were repeated ≥3 times.
Immunocytochemistry and image data analysis
Cells were grown on Lab-Tek II 4-well chamber slides (Nalge Nunc), fixed with 4% paraformaldehyde in PBS for 10 min at room temperature, and permeabilized with 0.1% Triton X-100 for 10 min at room temperature. MOR was visualized by incubating cells with rabbit anti-MOR antibody and Alexa Fluor 488-coupled secondary antibody (Invitrogen). Polyclonal MOR antibody was generated from rabbit using GST-fused MOR protein containing aa 340–398 of the MOR C-terminus. Images were acquired with the ×40 objective of a Leica DMIRE2 fluorescence microscope (Leica Microsystems, Wetzlar, Germany) connected to a BD CARVII confocal imager (BD Biosciences, San Jose, CA, USA) and a Hamamatsu EM CCD camera (Hamamatsu Photonics, Hamamatsu, Japan).
MetaMorph software (Molecular Devices, Sunnyvale, CA, USA) was used for image analysis. In each sample, ≥3 rectangular regions were analyzed after subtracting the background intensity using basic filters in MetaMorph to calculate the average fluorescence intensities. The results were captured and recorded in an Excel spreadsheet (Microsoft, Redmond, WA, USA) by MetaMorph to generate quantitative results in graphical form.
Flow cytometry
Flow cytometry using neuronal differentiated and transfected P19 cells was performed as described previously (33, 34). Cells were harvested in PBS, and ∼5 × 10⁵ cells were used for each staining reaction. Cells were washed 3 times in fluorescence-activated cell sorter (FACS) buffer (0.1% horse serum in PBS), fixed in 4% paraformaldehyde in PBS for 30 min at room temperature, washed twice with FACS buffer, and permeabilized in PBS buffer containing 5% FBS, 0.2% Triton X-100, and 0.5% glycine on ice for 30 min. Cells were then incubated with primary antibody in 1% BSA and 0.5% Triton X-100, washed in FACS buffer, and stained with Alexa Fluor 488-conjugated secondary antibody (Invitrogen) in PBS containing 1% BSA for 45 min at room temperature. Flow cytometric analyses were performed using a FACScalibur (BD Biosciences) equipped with two lasers for excitation at 488 and 635 nm (Flow Cytometry facility at the Masonic Cancer Center, University of Minnesota). In each sample, ≥10,000 cells were analyzed. Data were collected and analyzed with FlowJo 7.6.5 software for Microsoft (Tree Star, Ashland, OR, USA).
Statistical analysis
All numerical values are presented as means ± se. All statistical analyses were conducted using Prism 5.0 (GraphPad, San Diego, CA, USA). Comparisons of different groups were carried out by 1-way ANOVA with Dunnett's post hoc test for comparing values to control or 2-way ANOVA with Bonferroni's post hoc analysis for multiple comparisons. Values of P < 0.05 are statistically significant.
RESULTS
Prolonged fentanyl or morphine treatment increases miR-339-3p in MOR-expressing mouse hippocampus
Our laboratory has previously performed miRNA microarray analyses using the cerebellum (CRB) and hippocampus (HPC) from adult mice treated with opioid agonists, i.e., morphine (12 μg/h) or fentanyl (0.31 μg/h), for 3 d (24). In the HPC, where MOR is abundant, prolonged treatment with fentanyl induced a 3.8-fold increase of miR-339-3p, while morphine treatment showed a similar, albeit less, effect (2-fold, Fig. 1A). In the CRB, where MOR is absent, miR-339-3p was unchanged in response to both agonists, indicating a specific effect through MOR.
We performed in silico analysis using RegRNA (35) and found a predicted miR-339-3p binding site on the mouse MOR 3′-UTR (66–93 bp downstream of the stop codon). Notably, the miR-339-3p-binding site is conserved among species (mouse, human, and rat) with 70% homology in the full binding sequence (19 bp matches in 27 bp, marked with asterisks in Fig. 1B) and near-identical homology (1 mismatch out of 8 nt) in the “seed” matching site that is essential for sequence-specific miRNA binding (36).
The miR-339 precursor sequence was cloned into a pSuper plasmid (pSuper-339). In the neuroblastoma cell line N2A-MOR expressing clonal MOR, pSuper-339 induced a dose-dependent increase of miR-339-3p expression, as verified by real-time qRT-PCR (Fig. 1C). pSuper-339 transfection efficiently induced ∼300- to 1200-fold increase in mature miR-339-3p expression. On the other hand, 10 nM anti-miR-339-3p, a miRNA-339-3p inhibitor, knocked down 55% of the endogenous miR-339-3p in N2A-MOR cells (Fig. 1D).
miR-339-3p inhibits MOR 3′-UTR activity by binding to its target sequence
To investigate the mechanism of miR-339-3p's effect on MOR expression, we cotransfected HEK293T cells with pSuper-339 and a construct (pMUTR; ref. 11) containing the full-length 3′-UTR of the MOR gene. HEK293T cells, which have no endogenous MOR expression, were used to assess the reporter activity to avoid interference from endogenous μ-opioid proteins. pSuper-339 inhibited the reporter activity of pMUTR in a dose-dependent manner, and it did not inhibit the reporter activity of pMUTR339-mut (mutated target site of miR-339-3p; Fig. 2B) but rather increased the activity slightly (Fig. 2A). Anti-miR339-3p (10 nM) fully reversed the suppression of miR-339-3p on pMUTR (Fig. 2A). To verify whether miR-339-3p suppresses MOR 3′-UTR through a specific binding to the putative miRNA target site (Fig. 1B), we cloned the target site into the pmirGLO dual-luciferase miRNA target expression vector driven by the human phosphoglycerate kinase promoter (pPGK), which provides mild translation expression (Fig. 2D). Transfection of miR-339-3p expression plasmid pSuper-339 (100 ng) caused a ∼40% decrease in pmirGLO339 luciferase activity (Fig. 2C). Mutation of the miR-339-3p binding site completely abrogated the inhibitory effect induced by miR-339-3p (Fig. 2C). These results suggest a sequence-specific interaction between miR-339-3p and its binding site in the MOR 3′-UTR.
Figure 2.
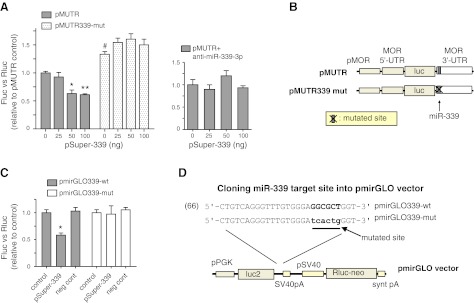
Regulation of MOR by miR-339-3p through MOR 3′-UTR. A) pMUTR and pMUTR339-mut were cotransfected with varying amounts of pSuper-339 into HEK293T cells. At 24 h after transfection, firefly luciferase activity was assessed and normalized to Renilla luciferase activity. In the second graph, 10 nM anti-miR-339-3p was added to the transfection of pMUTR. Control: 0 ng of pSuper-339. Graphs indicate the averages from ≥3 representative experiments. Error bars = se. *P < 0.05, **P < 0.01 vs. control; #P < 0.05 vs. pMUTR; 2-way ANOVA. B) Reporter constructs pMUTR and pMUTR339-mut. pMOR indicates MOR promoter. Arrow indicates binding site of miR-339-3p; X indicates the mutated target site. C) The miR-339-3p target site of the MOR 3′-UTR is functional for the effect of miR-339-3p. Luciferase/Renilla ratio results for HEK293T cells cotransfected with 100 ng pSuper vector (control), 100 ng pSuper-339, or 20 nM miR negative control (neg cont; anti-miR; Applied Biosystems) together with pmirGLO339-wt (wild type, shaded bars) or pmirGLO339-mut (mutant, white bars) for 24 h. Renilla expression from the pmirGLO vector was used for Luc/Renilla ratio quantification. Results are presented as a fold difference relative to wild-type control cells transfected with pSuper vector and pmirGLO339-wt. Graphs indicate the averages from ≥3 representative experiments. Error bars = se. *P < 0.05 vs. control; 2-way ANOVA. D) miR-339-3p target site in pmirGLO. MOR 3′-UTR fragments that were cloned into pmirGLO are illustrated above. Seed match for wild type is in bold; mutated sequences of the seed match are in lowercase letters.
miR-339-3p suppresses MOR expression by promoting mRNA decay
Gene silencing can occur via degradation of mRNA or suppression of protein translation. To determine how MOR down-regulation is mediated by miR-339-3p, we first performed a mRNA stability assay using neuronal differentiated P19 cells (Fig. 3). We previously reported that when embryonal carcinoma P19 cells were differentiated into neuron-like cells, endogenous MOR transcript was increased dramatically (29, 37). When pSuper-339 was transfected into these cells, the half-life of MOR mRNA dropped to 3.7 h compared to control (9.2 h; Fig. 3, left panel), whereas the half-lives in vector-only (8.2 h) and unrelated miRNA plasmid pSuper-224 (8.3 h) controls were only decreased slightly compared to control (not statistically different). Cotransfection of miR-339-3p inhibitor partially reversed MOR mRNA decay mediated by miR-339-3p to half-life 5.2 h, whereas cotransfection with negative control RNA did not affect miR-339-3p-mediated MOR mRNA decay, but it did cause further destabilization of MOR mRNA (2.8 h), possibly a nonspecific effect from miRNA transfection. When the miR-339-3p inhibitor was transfected alone, the MOR decay was reduced almost to the control level (8.9 h). These indicate that miR-339-3p decreases MOR mRNA stability, which can partially be reversed by miR-339-3p inhibitor. We did not observe any statistical differences in the absence of Act-D treatment among the different transfectants (data not shown).
Figure 3.
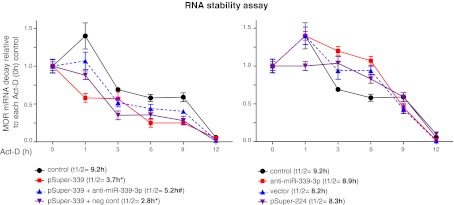
Overexpression of miR-339-3p caused a decrease in MOR mRNA stability. Indicated plasmids and RNAs were cotransfected into neuronal differentiated P19 cells (AP4d) and treated with the RNA synthesis inhibitor Act-D for the indicated times or 0 h (no-treated control). Total RNA was isolated and analyzed decay ratios of MOR mRNA by real-time qRT-PCR. Values are relative to each Act-D (0 h) control after β-actin normalization (n≥3). t1/2, half-life of mRNA. *P < 0.05 vs. control; #P < 0.05 vs. pSuper-339 alone; 2-way ANOVA.
Endogenous MOR expression is suppressed by miR-339-3p
We next attempted to determine the direct effect of miR-339-3p on endogenous MOR. Using flow cytometry, we confirmed that MOR protein expression was increased in neuronal differentiated P19 cells compared with undifferentiated P19 cells (Fig. 4A). Whereas 32.3% of the sorted cells were MOR+/MAP-2+ (microtubule-associated protein 2, a neuronal cell marker), only 2.26% were MOR−/MAP-2+, suggesting that most of the P19 cells that differentiated into MAP-2-expressing neurons were MOR+. MOR+/MAP-2− cells made up to 38% of the population, indicating that the remaining differentiated cell types, such as glial or neuron cells, may also express the MOR protein in the differentiated state. We transfected miR-339-3p expression plasmid (pSuper-339) and its inhibitor RNA (anti-miR-339-3p) into the neuronal differentiated cells to analyze the effect of miR-339-3p on endogenous MOR (Fig. 4B). MOR expression decreased from 27.1% (control AP4d sample) to 16.2% in miR-339-3p-transfected AP4d cells, and the miR-339-3p-mediated reduction was abolished (back to 23.5%) when miR-339-3p inhibitor was cotransfected, indicating the specificity of the miR-339-3p-mediated reduction. Transfection of vector alone had little effect on MOR expression.
Figure 4.

miR-339-3p decreased MOR protein level in neuron cells analyzed by flow cytometry. A) MOR expression was increased in neuronal differentiated P19 cells compared with undifferentiated P19 cells. Antibodies to MAP-2 (MAB3418; Millipore) and MOR were used in 2-color flow cytometry. Numbers in each section indicate percentages of cells detected by the antibodies. B) pSuper (vector), pSuper-339, and pSuper-339 + anti-miR-339-3p were transfected separately into the differentiated cells. First histogram (control) indicates a transfection reagent control without any DNA transfected. Because cells were permeabilized during incubation with primary antibody, both intracellular and cell surface MOR protein was detected. Percentages are relative to the same sample of control IgG used in flow cytometry. Bottom graph represents each green fluorescence signal for MOR expression summarized from the above four histograms after thrice-repeated experiments. Error bars = se. *P < 0.05 vs. control.
We also used immunocytochemistry to determine MOR expression in cells overexpressing miR-339-3p (Fig. 5). Transfection of cells with pSuper-339 significantly decreased the amount of fluorescently labeled MOR protein on both the neurites and cell body of neuronal differentiated P19 cells compared with untransfected control cells (Fig. 5, bottom panel, bars b and e vs. a). Overall fluorescence in these samples was reduced to 74% of the control sample. Introduction of miR-339-3p inhibitor, anti-miR-339-3p, into the cells restored the MOR fluorescent signal to the level of the control sample (100%; Fig. 5d). Cells transfected with vector (Fig. 5g), negative control (Fig. 5f), or pSuper-224 (Fig. 5h) showed no difference in their green fluorescence compared to control cells. Together with the RNA stability assay, these experiments demonstrated that miR-339-3p reduces the target gene MOR at the protein level by destabilizing MOR mRNA.
Figure 5.

Overexpression of miR-339-3p caused a decrease in MOR expression in neuron-like cells analyzed by immunocytochemistry. Top panels: neuronal differentiated cells were untransfected (control; a) or transfected with pSuper-339 (b), anti-miR-339-3p (c), pSuper-339 + anti-miR-339-3p (d), pSuper-339 + negative control (neg cont; e), negative control (f), vector (g), or pSuper-224 (h). MOR protein was visualized with anti-MOR and Alexa Fluor 488 (green), and nuclei were stained with propidium idodide (PI, red). Red arrows indicate large nuclei that are likely those of glial cells differentiated from P19 cells. Much smaller nuclei/cell bodies, marked by green arrows and stained in green with anti-MOR, likely belong to neuronal cells. Bottom panel: graph indicates average fluorescence intensities. *P < 0.05 vs. control.
Fentanyl increases the miR-339-3p expression
From miRNA microarray analysis, we observed that miR-339-3p was induced by opioid agonist treatment. We further validated this result in a mouse cell line previously generated in the laboratory, N2A-MOR (25), which closely approximates the opioid signaling pathway in vivo. The cloned MOR behaves like native receptor in terms of its desensitization and down-regulation following opioid exposure (25). Although the stably transfected MOR plasmid does not include the miR-339-3p target site in the MOR 3′-UTR (because it has only 30 bp of MOR 3′-UTR), the N2A-MOR cell line is suitable for evaluating miR-339-3p regulation by MOR agonists, because it maintains the canonical opioid pathway activated by agonists. We treated N2A-MOR cells with 10 nM fentanyl and determined miR-339-3p expression levels by real-time qRT-PCR (Fig. 6A, left panel). miR-339-3p levels rose quickly after treatment (1 h), peaked at 4 h, and remained elevated throughout the 24-h treatment period, compared with nontreated controls. We then treated cells with varying concentrations of fentanyl for 4 h. We observed up-regulation of miR-339-3p from a minimum 1 nM to 10 nM at its peak (Fig. 6A, middle panel). Morphine also increased the expression of miR-339-3p in a dose-dependent manner (Fig. 6A, right panel) but the induction (∼2-fold at 10 μM) was lower than that seen with fentanyl (∼4-fold at 10 nM), consistent with in vivo data from the miRNA microarray. To further confirm the involvement of MOR in miR-339-3p induction, we examined the effect of PTX, which uncouples the receptor from the Gαi/o and thus blunts the receptor's signals. Pretreatment of N2A-MOR cells with PTX abolished the fentanyl-induced increase of miR-339-3p (Supplemental Fig. S1A).
Figure 6.
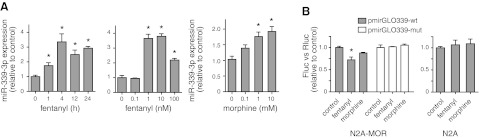
Expression of miR-339-3p was increased by MOR agonists. A) miRNA-enriched RNA was extracted from N2A-MOR cells and used in real-time qPCR. Left panel: treatment of N2A-MOR cells with 10 nM fentanyl. Control: 0 h; miR-339-3p/snoRNA-234. Middle panel: treatment of N2A-MOR cells with varying concentrations of fentanyl for 4 h (EC50=0.75 nM). Right panel: treatment of N2A-MOR cells with varying concentrations of morphine for 24 h (EC50=0.19 μM). B) pmirGLO339-wt or pmirGLO339-mut was transfected into N2A-MOR cells. At 24 h after transfection, cells were treated with 10 nM fentanyl or 10 μM morphine for 4 h, and luciferase activity was analyzed as described in Fig. 2. Transfection of pmirGLO339-wt into N2A was included as a control. One-way ANOVA with post hoc Dunnett's test was performed by comparing each sample to the control sample. Graphs show the averages of triplicate measures from ≥3 independent experiments; n ≥ 3. Error bars = se. *P < 0.05 vs. control.
To determine which downstream signaling pathways are essential for the miR-339-3p induction as a result of MOR activation, we examined several signaling mediators associated with opioid-mediated downstream pathways (38). We used real-time qRT-PCR to measure the miR-339-3p expression in presence of selective inhibitors (Supplemental Fig. S1B). miR-339-3p expression was reduced by 75% in the presence of the protein kinase A (PKA) inhibitor KT or the phospholipase C (PLC) inhibitor U73. Pretreatments with the PKC inhibitor bisindolymaleimide I [GF109203X, (GF)], the p42/44 MAP kinase inhibitor PD, and the Src-family tyrosine kinase inhibitor PP2 reduced fentanyl stimulation 35 to 50% compared with the control, whereas the PI3-kinase inhibitor LY had no effect. These results indicate that fentanyl positively regulates miR-339-3p transcription primarily by activating the PKA and PLC pathways. Pathways involving PKC, p42/44 MAPK, and Src kinases also seem to be involved in the stimulation, but to lesser extents, and pathways involving PI3-kinase are not involved with this up-regulation.
Next, we tested whether mutating the miR-339-3p binding site would directly abolish fentanyl's effect. In N2A-MOR cells transfected with wild-type pmirGLO339 or mutant pmirGLO339 (containing a mutant miR-339-3p binding site), fentanyl treatment decreased the reporter activity of only wild-type plasmid (pmirGLO339-wt; Fig. 6B). However, when native N2A cells, which are devoid of opioid receptors (39), were transfected with pmirGLO339-wt, fentanyl was not able to change the reporter activity (Fig. 6B), confirming a role of MOR protein in the fentanyl-induced up-regulation of miR-339-3p. Taken together, our results suggest a signaling pathway in which fentanyl treatment leads to increased endogenous miR-339-3p expression through MOR, resulting in suppression of reporter activity through specific binding between miR-339-3p and the MOR 3′-UTR.
Fentanyl up-regulates pri-miR-339 expression
In miRNA biosynthesis, the miRNA gene is usually transcribed by RNA polymerase II, producing pri-miRNA. The pri-miRNA is cleaved by Drosha to generate pre-miRNA (19–21). Pre-miRNA is transported from the nucleus to the cytoplasm by Exportin5 (22) and further processed by DICER to produce mature miRNA (23). miRNA biosynthesis can be regulated at different levels. To determine how fentanyl activates miR-339-3p expression, we treated N2A-MOR cells with fentanyl and analyzed pri-miR-339 levels by RT-PCR or real-time qRT-PCR (Supplemental Fig. S2). Both experiments showed an ∼2-fold increase of pri-miR-339 with 10 nM fentanyl treatment compared with untreated controls, suggesting that fentanyl increases miR-339-3p expression at the transcriptional level.
Fentanyl regulates the miR-339 promoter
Because the biosynthesis and regulation of pri-miRNA occur in the nucleus, we sought to clone the miR-339 promoter and assess transcriptional changes, as shown in pri-miR-339 levels. We obtained mouse miR-339 genomic sequences from the NCBI database (see Materials and Methods and Fig. 7A). Pri-miRNA transcripts are transcribed either from intergenic or intragenic (intronic) regions in the genome (40, 41). Therefore, pri-miRNA can be transcribed by independent or host promoters (42), respectively. To determine whether pri-miR-339 is under the control of its own independent promoter, a DNA fragment (P3) that immediately precedes the pri-miR-339 sequence was generated and cloned into a luciferase reporter plasmid (pGL3-Basic, marked as pBasic). We also performed an in silico promoter search (43) with the genomic information of pri-miR-339. Three putative promoter sites were predicted: nt 923–973 (transcription initiation site [TIS] at nt 958), nt 1151–1401 without TIS prediction, and nt 2251–2301 (TIS at nt 2286). By cloning each predicted promoter region into a luciferase reporter pBasic, we generated three promoter clones, P1, P2, and P3, to cover all putative promoters (Fig. 7A). We analyzed the luciferase activity of the constructs driven by the three putative promoters in N2A cells (Fig. 7B). Only P1 showed promoter activity (∼89-fold) compared to the no-promoter control vector, pBasic (Fig. 7B, left panel). P2 and P3 showed low activities comparable to pBasic. Similar results were obtained in HEK293T cells (also MOR−), with only P1 demonstrating strong promoter activity (data not shown). Increasing the amount of P1 plasmid stimulated the reporter activity in a dose-dependent manner (Fig. 7B, right panel). These results suggest that the P1 region contains the bona fide promoter for miR-339.
We then tested whether the increase of pri-miR-339 seen with fentanyl treatment was caused by an increase in promoter activity. The miR-339 promoter P1 was transfected into N2A-MOR and N2A cells (Fig. 7C). Fentanyl treatment increased the reporter activity of P1 for ∼2-fold in N2A-MOR cells but had no effect in N2A cells, suggesting that the effect of fentanyl on the miR-339 promoter is mediated through MOR. Morphine treatment had similar effects on the cells, but at a slightly lower level (∼1.8-fold). As expected, P2 and P3 plasmids, used as controls, did not respond to fentanyl or morphine treatment in either cell type. Cotreatment of the cells with a MOR antagonist, naloxone, largely reversed the elevation of reporter activity induced by both fentanyl and morphine (1.3-fold compared with 2-fold increase from control; Fig. 7D).
In silico analysis of the miR-339 gene structure
After analyzing the miR-339 promoter, we revisited several gene databases to gain further information about the miR-339 gene. We found a cDNA clone from an adult male testis cDNA (strain C57BL/6J) RIKEN full-length enriched library (GenBank: AK019591.1, clone 4930432F04) that overlapped with miR-339 genomic DNA (Fig. 7E). To map the miR-339 gene structure, we used the NCBI mouse genome database (NT_039316.7, chromosome 5, strain C57BL/6J, MGSCv37). Transcription of the miR-339 region starts at the TIS at nt 1265, and the resulting mRNA ends at the poly(A) cleavage site at nt 4221. The poly(A) site is located 355 extra bases downstream of the known miR-339 gene (nt 3866). It has a poly(A) signal (AATAAA) 12-17 bp upstream of the poly(A) site, which is a common feature of mammalian mRNA. The open reading frame (ORF) encodes a hypothetical protein of unknown function. To search for promoter regulatory elements in the region of promoter P1 that might regulate miR-339-3p expression, we used several Web-based tools, including AliBaba2.1 (http://www.gene-regulation.com/pub/programs/alibaba2/index.html), PROMO (44), NSITE (45), and CpG Site Finder (http://linux1.softberry.com/cgi-bin/programs/promoter/cpgfinder.pl). A number of promoter regulatory elements were predicted; commonly predicted elements are shown in Fig. 7E. They include Sp1, CREB, CpG island (CpGs), GT repeats, and CCAAT. Our studies of the miR-339 promoter indicate that primary mRNA containing both the host ORF and the miR-339 region is transcribed under the control of promoter P1, and P1 is regulated by the opioid agonists fentanyl and morphine in the nucleus, resulting in a subsequent increase of mature miR-339-3p.
DISCUSSION
In our previous reports, we identified a long 3′-UTR (∼10-kb) of the MOR that suppresses translation of receptor mRNA (46). We also found a trans-acting miRNA, miR-23b, which interacts with the cis-acting element K box in the MOR 3′-UTR. This interaction inhibited the association of MOR mRNA with polysomes, thereby suppressing MOR translation (11). In mouse neuronal N2A-MOR cells, morphine treatment inhibits the polysome-mRNA association of MOR through miR-23b, resulting in reduced translation efficiency (12). These studies provide a new perspective on opioid receptor regulation, in which miRNA acts as a mediator to transduce extracellular signaling to intracellular receptor gene expression.
One disadvantage of studying miRNAs based on in silico prediction is that the current software relies heavily on sequence complementarity and miRNA:mRNA structure without considering endogenous expression levels and region-specific expression of miRNAs. For example, we did not observe a significant elevation of miR-23b levels in primary cell culture or brain regions treated with morphine; it is possible that the changes in miR-23b levels in individual neurons were obscured in the heterogeneous primary cultures and brain regions. In this study, therefore, we employed miRNA microarray analysis to search for miRNAs that are endogenously involved in opioid receptor regulation. We chose miRNAs that showed significant changes in response to opioid agonist treatment in the mouse hippocampus, which is essential for opioid receptor functioning.
Over the past decade, studies have shown that miRNAs are important regulators of gene expression, and miRNAs have been implicated in a wide variety of biological activities, such as development, differentiation, and pathogenesis. Expression of miRNAs can undergo pronounced changes in response to stress from pathological stimuli, thus allowing them to serve as fine tuners of gene expression (18). An increasing number of studies has begun to address the regulatory events that modulate miRNA activity and to define the biological role of miRNA in tissue maintenance and stress response. miRNA genes are classified as intragenic or intergenic, according to their locations in the genome. Intragenic miRNAs (intronic and exonic) are generally believed to be regulated by the promoters of the genes in which they reside (47), although some have their own promoters (48). The nature of miRNAs in the intergenic parts of the genome is largely unknown, although RNA polymerase II appears to be involved (41). Intergenic miRNA genes contain their own promoters and regulatory units (41, 49–51) and can be regulated independently from the neighboring genes.
In this study, we reported a miRNA, miR-339-3p that is endogenously regulated in the MOR-abundant mouse brain region in response to opioid agonists. Using reporter assay and biochemical analysis, we confirmed a functional interaction between miR-339-3p and MOR 3′-UTR through opioid signaling pathways activated by fentanyl and morphine; this interaction results in a decrease in MOR protein level. Furthermore, we successfully cloned and empirically validated the pri-miR-339 promoter and dissected the genomic structure of miR-339.
Fentanyl and morphine are both opioid analgesics that act mainly on MOR. Fentanyl is up to 100 times more potent than morphine and is currently the most widely used synthetic opioid in clinical practice for relieving pain, especially in cancer patients requiring severe chronic pain management. Compared to morphine, although fentanyl is more likely to cause addiction, dependence, and severe respiratory depression (52, 53), it produces fewer instances of tolerance (54) and milder nausea and itching (55). The increased potency of fentanyl is largely due to its high affinity for the receptor, lipophilicity, and efficient transport across the blood-brain barrier into the central nervous system (55). In addition, different MOR agonists function through selective ligand-directed signaling pathways (56), as reviewed by Law et al. (38). Our data suggested a new perspective into differential function of fentanyl and morphine, which might involve modulating miRNA expression. Fentanyl induced a higher elevation of miR-339-3p expression than morphine, both in vivo and in vitro, resulting in more efficient inhibition on the MOR 3′-UTR. Our data on miR-339 promoter suggest a stronger promoter activation by fentanyl to be one of the contributing factors to an increase of mature miR-339-3p levels.
Emerging evidence shows that miRNAs are actively involved in opioid receptor regulation. In addition to miR-23b, which we identified as a regulator of mouse MOR 3′-UTR, another miRNA, let-7, has been reported, which regulates the human MOR gene. let-7 suppresses the MOR gene by interacting with its target site in the human MOR 3′-UTR (13). Morphine treatment significantly increases let-7 expression in vitro and in vivo, and more importantly, knocking down brain let-7 by injection of anti-let-7 partially attenuates opioid antinociceptive tolerance in mice (13). Chronic morphine treatment did not change overall MOR transcript levels, but it decreased polysome-mRNA association in a let-7-dependent manner by translocating and sequestering MOR mRNA to P-bodies, leading to translation repression. Since MOR 3′-UTR has been shown to be regulated by miR-23b and let-7, we compared their independent and combinational effects with miR-339-3p, as shown in Supplemental Fig. S3. The two miRNAs, let-7 and miR-23b, which both act on translation repression, reduced the MOR 3′-UTR activities by 30% and 55%, respectively. The miR-339-3p, which induces mRNA destabilization, showed a 40% reduction of pMUTR activity. The combinatory transfection of miR-339-3p together with let-7 and miR-23b caused a total 73% decrease of pMUTR activity. We speculate an additive effect through multiple miRNAs acting on different steps of protein synthesis of MOR, although the details of such combinatory effects remain to be explored.
Primary miR-339, an intragenic miRNA, resides in the 3′-UTR (noncoding region) of a host gene. As shown in Fig. 7E, the host gene contains a number of general features of mammalian mRNAs [TIS, poly(A) signal, and poly(A) cleavage site] and a promoter (CpG site, GT repeat, and CCAAT motif). More importantly, the identified promoter region (P1) is active. The miR-339 promoter contains 26 GT tandem repeats [(GT)26]. Slipped strand mispairing (SSM), a mutation process that occurs during DNA replication, is commonly observed in the microsatellite tandem repeats. SSM error rates depend on the number of tandem repeats (57), which varies among species, strains, and even in disease states. Thus, microsatellite repeats are often used as genetic markers, and their mutations are associated with numerous neurological diseases. It will be interesting to determine whether the number of repeats in the miR-339 promoter varies or if the repeats are a frequent site of SSM errors; changes in the repeats may regulate the host gene and the miRNA.
Another well-known element in promoter P1 is the CpG island, a genomic region that contains a high frequency of CpG sites. CpGs are targets for DNA methylation, a chemical modification of cytosine (C) that is heritable during cell division and one of the most well-characterized epigenetic mechanisms. There are 31 CpGs (25% of all dinucleotides) in 122 dinucleotides (nt 1195–1439) of the miR-339 gene that can be characterized as CpG islands (58, 59). DNA methylation, associated with transcriptional repression, compacts histone structures and restricts the access of trans-acting factors to promoter regions. The target gene of miR-339-3p, MOR, is also regulated by CpG methylation (10, 29); it will be interesting to investigate whether miR-339-3p and MOR are counter- or coregulated by DNA methylation.
Here, we report a third miRNA involved in opioid receptor regulation. Our investigation of miR-339-3p led to three important observations. First, miR-339-3p is an endogenous factor involved in opioid signaling. Second, opioid agonists elevated miR-339-3p expression levels through its promoter and pri-miRNA transcripts. Finally, the consistent differences between fentanyl and morphine in their ability to modulate miR-339-3p expression can provide new clues to the molecular mechanisms underlying their pharmacological properties. It is possible that the 10-kb 3′-UTR of MOR harbors a complex combination of regulatory motifs that bind to a variety of regulators, including miRNAs. We found a number of different microRNA target sites in the 3′-UTR of the mouse MOR gene. It is plausible that the extensive length of the MOR 3′-UTR and a variety of MOR splicing isoforms (60, 61) contribute to the complexity of the post-transcriptional regulation of the MOR gene, for example, coregulation by multiple miRNAs. Post-transcriptional regulation plays an important role in the molecular mechanisms underlying the opioid action observed in animals and humans. Therefore, our findings not only expand our understanding of the role of miRNA in opioid receptor regulation, but also provide a new perspective on the agonist-selective signaling pathways involved in opioid tolerance. The mapping of miR339's promoter region also enables further investigation of the lesser-known miRNA biosynthesis regulation in response to opioid treatment.
Supplementary Material
Acknowledgments
The authors thank Dr. Tracy Kuhlman and Mr. Bradley J. Stish for editorial assistance with the manuscript.
This work was supported by the U.S. National Institutes of Health, National Institute of Drug Abuse (grants DA000564, DA001583, DA011806, DA011190, and DA013926); and by the A&F Stark Fund of the Minnesota Medical Foundation.
The authors declare no conflicts of interest.
This article includes supplemental data. Please visit http://www.fasebj.org to obtain this information.
- Act-D
- actinomycin-D
- AP4d
- 4 d after plating
- CRB
- cerebellum
- FACS
- fluorescence-activated cell sorter
- HEK
- human embryonic kidney
- HPC
- hippocampus
- MAP-2
- microtubule-associated protein 2
- miRNA
- microRNA
- miR
- microRNA
- MOR
- μ-opioid receptor
- N2A
- Neuro2A
- PCR
- polymerase chain reaction
- PKA
- protein kinase A
- PKC
- protein kinase C
- PLC
- phospholipase C
- PP2
- 4-amino-5-(4-chlorophenyl)-7-(t-butyl)pyrazolo[3,4-d]pyrimidine
- pre-miRNA
- precursor miRNA
- pri-miRNA
- primary miRNA
- PTX
- pertussis toxin
- qPCR
- quantitative polymerase chain reaction
- qRT-PCR
- quantitative reverse transcription–polymerase chain reaction
- RT-PCR
- reverse transcription–polymerase chain reaction
- SSM
- slipped strand mispairing
- TIS
- transcription initiation site
- UTR
- untranslated region
REFERENCES
- 1. Law P. Y., Loh H. H., Wei L. N. (2004) Insights into the receptor transcription and signaling: implications in opioid tolerance and dependence. Neuropharmacology 47(Suppl. 1), 300–311 [DOI] [PubMed] [Google Scholar]
- 2. Binyaminy B., Gafni M., Shapira M., Sarne Y. (2008) Agonist-specific down regulation of mu-opioid receptors: different cellular pathways are activated by different opioid agonists. Life Sci. 82, 831–839 [DOI] [PubMed] [Google Scholar]
- 3. Kramer H. K., Simon E. J. (1999) Role of protein kinase C (PKC) in agonist-induced mu-opioid receptor down-regulation: II. Activation and involvement of the alpha, epsilon, and zeta isoforms of PKC. J. Neurochem. 72, 594–604 [DOI] [PubMed] [Google Scholar]
- 4. Schmidt H., Schulz S., Klutzny M., Koch T., Handel M., Hollt V. (2000) Involvement of mitogen-activated protein kinase in agonist-induced phosphorylation of the mu-opioid receptor in HEK 293 cells. J. Neurochem. 74, 414–422 [DOI] [PubMed] [Google Scholar]
- 5. Koch T., Kroslak T., Mayer P., Raulf E., Hollt V. (1997) Site mutation in the rat mu-opioid receptor demonstrates the involvement of calcium/calmodulin-dependent protein kinase II in agonist-mediated desensitization. J. Neurochem. 69, 1767–1770 [DOI] [PubMed] [Google Scholar]
- 6. Afify E. A. (2002) Turnover of mu-opioid receptors in neuroblastoma cells. Brain Res. Mol. Brain Res. 106, 83–87 [DOI] [PubMed] [Google Scholar]
- 7. Wei L. N., Loh H. H. (2011) Transcriptional and epigenetic regulation of opioid receptor genes: present and future. Annu. Rev. Pharmacol. Toxicol. 51, 75–97 [DOI] [PMC free article] [PubMed] [Google Scholar]
- 8. Kim C. S., Hwang C. K., Song K. Y., Choi H. S., Kim do K., Law P. Y., Wei L. N., Loh H. H. (2008) Novel function of neuron-restrictive silencer factor (NRSF) for posttranscriptional regulation. Biochim. Biophys. Acta 1783, 1835–1846 [DOI] [PubMed] [Google Scholar]
- 9. Hwang C. K., Kim C. S., Kim do K., Law P. Y., Wei L. N., Loh H. H. (2010) Up-regulation of the mu-opioid receptor gene is mediated through chromatin remodeling and transcriptional factors in differentiated neuronal cells. Mol. Pharmacol. 78, 58–68 [DOI] [PMC free article] [PubMed] [Google Scholar]
- 10. Hwang C. K., Song K. Y., Kim C. S., Choi H. S., Guo X. H., Law P. Y., Wei L. N., Loh H. H. (2009) Epigenetic programming of mu opioid receptor gene in mouse brain is regulated by MeCP2 and Brg1 chromatin remodeling factor. J. Cell. Mol. Med. 13, 3591–3615 [DOI] [PMC free article] [PubMed] [Google Scholar]
- 11. Wu Q., Law P. Y., Wei L. N., Loh H. H. (2008) Post-transcriptional regulation of mouse mu opioid receptor (MOR1) via its 3′ untranslated region: a role for microRNA23b. FASEB J. 22, 4085–4095 [DOI] [PMC free article] [PubMed] [Google Scholar]
- 12. Wu Q., Zhang L., Law P. Y., Wei L. N., Loh H. H. (2009) Long-term morphine treatment decreases the association of mu-opioid receptor (MOR1) mRNA with polysomes through miRNA23b. Mol. Pharmacol. 75, 744–750 [DOI] [PMC free article] [PubMed] [Google Scholar]
- 13. He Y., Yang C., Kirkmire C. M., Wang Z. J. (2010) Regulation of opioid tolerance by let-7 family microRNA targeting the mu opioid receptor. J. Neurosci. 30, 10251–10258 [DOI] [PMC free article] [PubMed] [Google Scholar]
- 14. Mansour A., Fox C. A., Akil H., Watson S. J. (1995) Opioid-receptor mRNA expression in the rat CNS: anatomical and functional implications. Trends Neurosci. 18, 22–29 [DOI] [PubMed] [Google Scholar]
- 15. Brodsky M., Elliott K., Hynansky A., Jenab S., Inturrisi C. E. (1995) Quantitation of mu-opioid receptor (MOR-1) mRNA in selected regions of the rat CNS. Neuroreport 6, 725–729 [DOI] [PubMed] [Google Scholar]
- 16. Unterwald E. M., Rubenfeld J. M., Imai Y., Wang J. B., Uhl G. R., Kreek M. J. (1995) Chronic opioid antagonist administration upregulates mu opioid receptor binding without altering mu opioid receptor mRNA levels. Brain Res. Mol. Brain Res. 33, 351–355 [DOI] [PubMed] [Google Scholar]
- 17. Pan Y. X., Xu J., Mahurter L., Bolan E., Xu M., Pasternak G. W. (2001) Generation of the mu opioid receptor (MOR-1) protein by three new splice variants of the Oprm gene. Proc. Natl. Acad. Sci. U. S. A. 98, 14084–14089 [DOI] [PMC free article] [PubMed] [Google Scholar]
- 18. Van Rooij E. (2011) The art of microRNA research. Circ. Res. 108, 219–234 [DOI] [PubMed] [Google Scholar]
- 19. Denli A. M., Tops B. B., Plasterk R. H., Ketting R. F., Hannon G. J. (2004) Processing of primary microRNAs by the microprocessor complex. Nature 432, 231–235 [DOI] [PubMed] [Google Scholar]
- 20. Gregory R. I., Yan K. P., Amuthan G., Chendrimada T., Doratotaj B., Cooch N., Shiekhattar R. (2004) The microprocessor complex mediates the genesis of microRNAs. Nature 432, 235–240 [DOI] [PubMed] [Google Scholar]
- 21. Lee Y., Ahn C., Han J., Choi H., Kim J., Yim J., Lee J., Provost P., Radmark O., Kim S., Kim V. N. (2003) The nuclear RNase III Drosha initiates microRNA processing. Nature 425, 415–419 [DOI] [PubMed] [Google Scholar]
- 22. Yi R., Qin Y., Macara I. G., Cullen B. R. (2003) Exportin-5 mediates the nuclear export of pre-microRNAs and short hairpin RNAs. Genes Dev. 17, 3011–3016 [DOI] [PMC free article] [PubMed] [Google Scholar]
- 23. Chendrimada T. P., Gregory R. I., Kumaraswamy E., Norman J., Cooch N., Nishikura K., Shiekhattar R. (2005) TRBP recruits the Dicer complex to Ago2 for microRNA processing and gene silencing. Nature 436, 740–744 [DOI] [PMC free article] [PubMed] [Google Scholar]
- 24. Zheng H., Zeng Y., Zhang X., Chu J., Loh H. H., Law P. Y. (2010) mu-Opioid receptor agonists differentially regulate the expression of miR-190 and NeuroD. Mol. Pharmacol. 77, 102–109 [DOI] [PMC free article] [PubMed] [Google Scholar]
- 25. Chakrabarti S., Law P. Y., Loh H. H. (1995) Neuroblastoma Neuro2A cells stably expressing a cloned mu-opioid receptor: a specific cellular model to study acute and chronic effects of morphine. Brain Res. Mol. Brain Res. 30, 269–278 [DOI] [PubMed] [Google Scholar]
- 26. Hwang C. K., Kim C. S., Choi H. S., McKercher S. R., Loh H. H. (2004) Transcriptional regulation of mouse mu opioid receptor gene by PU. 1. J. Biol. Chem. 279, 19764–19774 [DOI] [PubMed] [Google Scholar]
- 27. Hwang C. K., Law P. Y., Wei L. N., Loh H. H. (2011) Regulation of the transcription of G protein-coupled receptor genes. In: Methods for the Discovery and Characterization of G Protein-Coupled Receptors (Stevens C. W., ed) Vol. 60, Humana Press, Clifton, NJ, USA [Google Scholar]
- 28. McBurney M. W., Reuhl K. R., Ally A. I., Nasipuri S., Bell J. C., Craig J. (1988) Differentiation and maturation of embryonal carcinoma-derived neurons in cell culture. J. Neurosci. 8, 1063–1073 [DOI] [PMC free article] [PubMed] [Google Scholar]
- 29. Hwang C. K., Song K. Y., Kim C. S., Choi H. S., Guo X. H., Law P. Y., Wei L. N., Loh H. H. (2007) Evidence of endogenous mu opioid receptor regulation by epigenetic control of the promoters. Mol. Cell. Biol. 27, 4720–4736 [DOI] [PMC free article] [PubMed] [Google Scholar]
- 30. Jalali A., Bassuk A. G., Kan L., Israsena N., Mukhopadhyay A., McGuire T., Kessler J. A. (2011) HeyL promotes neuronal differentiation of neural progenitor cells. J. Neurosci. Res. 89, 299–309 [DOI] [PMC free article] [PubMed] [Google Scholar]
- 31. Wang Y., Liu C. L., Storey J. D., Tibshirani R. J., Herschlag D., Brown P. O. (2002) Precision and functional specificity in mRNA decay. Proc. Natl. Acad. Sci. U. S. A. 99, 5860–5865 [DOI] [PMC free article] [PubMed] [Google Scholar]
- 32. Ross J. (1995) mRNA stability in mammalian cells. Microbiol. Rev. 59, 423–450 [DOI] [PMC free article] [PubMed] [Google Scholar]
- 33. Wagley Y., Yoo Y. C., Seo H. G., Rhee M. H., Kim T. H., Kang K. W., Nah S. Y., Oh J. W. (2007) The IL-6/sIL-6R treatment of a malignant melanoma cell line enhances susceptibility to TNF-α-induced apoptosis. Biochem. Biophys. Res. Commun. 354, 985–991 [DOI] [PubMed] [Google Scholar]
- 34. Karaji A. G., Khansari N., Ansary B., Dehpour A. (2005) Detection of opioid receptors on murine lymphocytes by indirect immunofluorescence: mature normal and tumor bearing mice lymphocytes. Int. Immunopharmacol. 5, 1019–1027 [DOI] [PubMed] [Google Scholar]
- 35. Huang H. Y., Chien C. H., Jen K. H., Huang H. D. (2006) RegRNA: an integrated web server for identifying regulatory RNA motifs and elements. Nucleic Acids Res. 34, W429–W434 [DOI] [PMC free article] [PubMed] [Google Scholar]
- 36. Lewis B. P., Burge C. B., Bartel D. P. (2005) Conserved seed pairing, often flanked by adenosines, indicates that thousands of human genes are microRNA targets. Cell 120, 15–20 [DOI] [PubMed] [Google Scholar]
- 37. Chen H. C., Wei L. N., Loh H. H. (1999) Expression of mu-, kappa- and delta-opioid receptors in P19 mouse embryonal carcinoma cells. Neuroscience 92, 1143–1155 [DOI] [PubMed] [Google Scholar]
- 38. Law P.-Y. (2011) Opioid receptor signal transduction mechanisms. In: The Opiate Receptors (Pasternak G. W., ed) Vol. 23, pp. 195238, Springer Science+Business Media, New York [Google Scholar]
- 39. Im H. J., Smirnov D., Yuhi T., Raghavan S., Olsson J. E., Muscat G. E., Koopman P., Loh H. H. (2001) Transcriptional modulation of mouse mu-opioid receptor distal promoter activity by Sox18. Mol. Pharmacol. 59, 1486–1496 [DOI] [PubMed] [Google Scholar]
- 40. Cai X., Hagedorn C. H., Cullen B. R. (2004) Human microRNAs are processed from capped, polyadenylated transcripts that can also function as mRNAs. RNA 10, 1957–1966 [DOI] [PMC free article] [PubMed] [Google Scholar]
- 41. Lee Y., Kim M., Han J., Yeom K. H., Lee S., Baek S. H., Kim V. N. (2004) MicroRNA genes are transcribed by RNA polymerase II. EMBO J. 23, 4051–4060 [DOI] [PMC free article] [PubMed] [Google Scholar]
- 42. Monteys A. M., Spengler R. M., Wan J., Tecedor L., Lennox K. A., Xing Y., Davidson B. L. (2010) Structure and activity of putative intronic miRNA promoters. RNA 16, 495–505 [DOI] [PMC free article] [PubMed] [Google Scholar]
- 43. Reese M. G. (2001) Application of a time-delay neural network to promoter annotation in the Drosophila melanogaster genome. Comput. Chem. 26, 51–56 [DOI] [PubMed] [Google Scholar]
- 44. Messeguer X., Escudero R., Farre D., Nunez O., Martinez J., Alba M. M. (2002) PROMO: detection of known transcription regulatory elements using species-tailored searches. Bioinformatics 18, 333–334 [DOI] [PubMed] [Google Scholar]
- 45. Solovyev V. V., Shahmuradov I. A., Salamov A. A. (2010) Identification of promoter regions and regulatory sites. Methods Mol. Biol. 674, 57–83 [DOI] [PubMed] [Google Scholar]
- 46. Wu Q., Hwang C. K., Yao S., Law P. Y., Loh H. H., Wei L. N. (2005) A major species of mouse mu-opioid receptor mRNA and its promoter-dependent functional polyadenylation signal. Mol. Pharmacol. 68, 279–285 [DOI] [PubMed] [Google Scholar]
- 47. Taganov K. D., Boldin M. P., Chang K. J., Baltimore D. (2006) NF-κB-dependent induction of microRNA miR-146, an inhibitor targeted to signaling proteins of innate immune responses. Proc. Natl. Acad. Sci. U. S. A. 103, 12481–12486 [DOI] [PMC free article] [PubMed] [Google Scholar]
- 48. Xiong H., Qian J., He T., Li F. (2009) Independent transcription of miR-281 in the intron of ODA in Drosophila melanogaster. Biochem. Biophys. Res. Commun. 378, 883–889 [DOI] [PubMed] [Google Scholar]
- 49. Lau N. C., Lim L. P., Weinstein E. G., Bartel D. P. (2001) An abundant class of tiny RNAs with probable regulatory roles in Caenorhabditis elegans. Science 294, 858–862 [DOI] [PubMed] [Google Scholar]
- 50. Lagos-Quintana M., Rauhut R., Lendeckel W., Tuschl T. (2001) Identification of novel genes coding for small expressed RNAs. Science 294, 853–858 [DOI] [PubMed] [Google Scholar]
- 51. Lee R. C., Ambros V. (2001) An extensive class of small RNAs in Caenorhabditis elegans. Science 294, 862–864 [DOI] [PubMed] [Google Scholar]
- 52. Jeal W., Benfield P. (1997) Transdermal fentanyl. A review of its pharmacological properties and therapeutic efficacy in pain control. Drugs 53, 109–138 [DOI] [PubMed] [Google Scholar]
- 53. Pergolizzi J., Boger R. H., Budd K., Dahan A., Erdine S., Hans G., Kress H. G., Langford R., Likar R., Raffa R. B., Sacerdote P. (2008) Opioids and the management of chronic severe pain in the elderly: consensus statement of an International Expert Panel with focus on the six clinically most often used World Health Organization Step III opioids (buprenorphine, fentanyl, hydromorphone, methadone, morphine, oxycodone). Pain Pract. 8, 287–313 [DOI] [PubMed] [Google Scholar]
- 54. Duttaroy A., Yoburn B. C. (1995) The effect of intrinsic efficacy on opioid tolerance. Anesthesiology 82, 1226–1236 [DOI] [PubMed] [Google Scholar]
- 55. Mayes S., Ferrone M. (2006) Fentanyl HCl patient-controlled iontophoretic transdermal system for the management of acute postoperative pain. Ann. Pharmacother. 40, 2178–2186 [DOI] [PubMed] [Google Scholar]
- 56. Zheng H., Zeng Y., Chu J., Kam A. Y., Loh H. H., Law P. Y. (2010) Modulations of NeuroD activity contribute to the differential effects of morphine and fentanyl on dendritic spine stability. J. Neurosci. 30, 8102–8110 [DOI] [PMC free article] [PubMed] [Google Scholar]
- 57. Kelkar Y. D., Strubczewski N., Hile S. E., Chiaromonte F., Eckert K. A., Makova K. D. (2010) What is a microsatellite: a computational and experimental definition based upon repeat mutational behavior at A/T and GT/AC repeats. Genome Biol. Evol. 2, 620–635 [DOI] [PMC free article] [PubMed] [Google Scholar]
- 58. Wu H., Caffo B., Jaffee H. A., Irizarry R. A., Feinberg A. P. (2010) Redefining CpG islands using hidden Markov models. Biostatistics 11, 499–514 [DOI] [PMC free article] [PubMed] [Google Scholar]
- 59. Akan P., Deloukas P. (2008) DNA sequence and structural properties as predictors of human and mouse promoters. Gene 410, 165–176 [DOI] [PMC free article] [PubMed] [Google Scholar]
- 60. Kim D. K., Hwang C. K., Wagley Y., Law P. Y., Wei L. N., Loh H. H. (2011) p38 mitogen-activated protein kinase and PI3-kinase are involved in up-regulation of mu opioid receptor transcription induced by cycloheximide. J. Neurochem. 116, 1077–1087 [DOI] [PMC free article] [PubMed] [Google Scholar]
- 61. Pan Y. X. (2002) Identification and characterization of a novel promoter of the mouse mu opioid receptor gene (Oprm) that generates eight splice variants. Gene 295, 97–108 [DOI] [PubMed] [Google Scholar]
Associated Data
This section collects any data citations, data availability statements, or supplementary materials included in this article.