

Abstract
How amphetamine affects the neuroglia in living brains is not well understood. In an effort to elucidate this effect, we investigated neuroglia in response to amphetamine exposure using antisense (AS) or sense (S) phosphorothioate-modified oligodeoxynucleotide (sODN) sequences that correspond to glial fibrillary acidic protein (GFAP) mRNA (AS-gfap or S-gfap, respectively) expression. The control is a random-sequence sODN (Ran). Using cyanine 5.5-superparamagnetic iron oxide nanoparticle (Cy5.5-SPION) labeling and fluorescent microscopy, we demonstrated that living neural progenitor cells (PC-12.1), as well as the cells in fresh brain slices and intact brains of male C57BL6 mice, exhibited universal uptake of all of the sODNs but rapidly excluded all sODN-Ran and most S-gfap. Moreover, transmission electron microscopy revealed electron-dense nanoparticles only in the neuroglia of normal or transgenic mice [B6;DBA-Tg(Fos-tTA, Fos-EGFP*)1MmayTg(tetO-lacZ,tTA*)1Mmay/J] that had been administered AS-gfap or Cy5.5-SPION-gfap. Subtraction R2* maps from mice with acute and chronic amphetamine exposure demonstrated, validated by postmortem immunohistochemistry, a reduction in striatal neuroglia, with gliogenesis in the subventricular zone and the somatosensory cortex in vivo. The sensitivity of our unique gene transcript targeted MRI was illustrated by a positive linear correlation (r2=1.0) between in vivo MRI signal changes and GFAP mRNA copy numbers determined by ex vivo quantitative RT-PCR. The study provides direct evidence for targeting neuroglia by antisense DNA-based SPION-gfap that enables in vivo MRI of inaccessible tissue with PCR sensitivity. The results enable us to conclude that amphetamine induces toxicity to neuroglia in vivo, which may cause remodeling or reconnectivity of neuroglia.—Liu, C. H., Yang, J., Ren, J. Q., Liu, C.-M., You, Z., Liu, P. K. MRI reveals differential effects of amphetamine exposure on neuroglia in vivo.
Keywords: drug delivery, molecular MR imaging, nanomedicine, gliogenesis
Drug abuse is a major public health problem with a wide range of negative health, economic, and social consequences. One of the most commonly abused types of drugs is amphetamine, a psychostimulant sometimes used as a performance enhancer to increase alertness and focus and which may induce anxiety and psychosis (1). Patients with a history of heart disease or hypertension and users of monoamine oxidase inhibitors may experience life-threatening complications if exposed to amphetamine. The effects of amphetamine use or abuse on brain development may last for many years, and chronic amphetamine exposure in animals and humans is known to cause hyperthermia and apoptosis (2–4), as well as leakage of the blood-brain barrier (BBB; ref. 5). However, the effect of amphetamine on neuroglia is not well understood, and somewhat controversial. Although there is research evidence that chronic amphetamine exposure activates striatal gliosis (6) and overproduction of cytokines from microglia (7), autopsy results from human methamphetamine users have not supported those observations (8). We chose to investigate the effect of amphetamine exposure on the neuroglia, as these cells play critical roles in modulating injury repair, neuronal migration, and axonal growth during nervous system development, and in facilitating neurotransmitter transport, BBB integrity, blood flow regulation, metabolic balance, iron homeostasis, and immune response. Neuroglial function is also known to be a factor in learning processes, stress responses, and mental health, as well as in the development of drug addiction, cancer, psychiatric, and neurological disorders, and neurodegenerative diseases (9–12).
Neuroglia uniquely express glial fibrillary acidic protein (GFAP), a key protein-based biomarker of gliosis and gliogenesis, in response to amphetamine exposure, cerebral ischemia, and traumatic brain injury, and in the pathological development of glioma, retinopathy of diabetes, and Alzheimer's disease (13, 14). Considering the limitations of current studies seeking to delineate therapeutic response by using neuroglia in culture, the ability to detect glial pathology in vivo would allow us to understand glial reaction to chemical exposure and to realize the potential of this important biomarker to improve understanding of brain diseases, and, in turn, enable early diagnosis and optimal clinical intervention. Because GFAP antigen is longer lasting than its mRNA, assay techniques based on GFAP antigen do not necessarily reflect amphetamine toxicity in humans. We sought to use small antisense DNA for GFAP mRNA.
Small, nuclease-resistant DNA, i.e., phosphorothioate-modified oligodeoxynucleoide (sODN), or peptide-modified ODN (pODN) with a sequence complementary to endogenous mRNA, has been shown to effectively transfect neural cells to report gene transcript activity in living brains (15–17). However, as many investigators have reported, factors such as membrane permeability, retention, and off-target effects present significant hurdles in these approaches (18, 19). On the basis of our previous work (20), as well as the results published by others, we have customized MR contrast probes that contain conjugates of sODN and superparamagnetic iron oxide nanoparticles (SPIONs; a T2 MR susceptibility contrast agent coated with dextran, ∼30 nm i.d.) to label specific gene transcripts in vivo (21).
Recent developments in MR hardware and acquisition methodology, as well as contrast agents, have enabled high-resolution anatomical, functional, and molecular brain imaging in living subjects. A relatively safe technology, MRI has an excellent depth of penetration (22). Nanoparticle-enhanced MRI is highly sensitive and has been used in preclinical and clinical disease models to track neural cells in vivo following stem cell therapy (23–25). MRI measures the relaxation time of proton spins in tissue water when an external magnetic field (B0) is applied; the presence of a contrast agent in the tissue alters the longitudinal (T1) and transverse (T2) relaxation times, or rate of relaxivity (R1 or R2, respectively), and the resulting MR image shows the difference of these parameters. Shimming prior to data acquisition in a 9.4-T MR system can temporarily reduce the potential contribution of noise from static B0 inhomogeneity.
Given that neuroglia specifically express GFAP and its mRNA, neurons serve as a naturally occurring GFAP-null- or GFAP-knockout-equivalent cell strain in normal conditions. We showed here that accurate base pairing enables specific hybridization between sODN and mRNA, and hence creates a window for real-time imaging of the changes in intracellular mRNA or in cell populations that express the unique mRNA. Furthermore, we applied this technology to provide direct evidence to show that GFAP mRNA tagging with an MR contrast agent can report glial populations in vivo that reflect autopsy reports of amphetamine users.
MATERIALS AND METHODS
Animals and housing
All of the procedures used in this study were approved by the Massachusetts General Hospital Subcommittee on Research Animal Care, the institutional animal welfare committee, in accordance with the Public Health Service Guide for the Care and Use of Laboratory Animals. Adult C57BL6 male mice (Taconic Farm, Germantown, NY, USA) or transgenic mice [B6;DBA-Tg(Fos-tTA, Fos-EGFP*)1MmayTg(tetO-lacZ,tTA*)1Mmay/J; Jackson Laboratories, Bar Harbor, ME, USA], 2 to 3 mo of age (23±2 g body weight), were kept in cages with sawdust bedding, in a room with controlled light cycles (12-h light-dark). All animals had free access to water and were fed standard laboratory chow. Mice were trained, operated on, and tested in a randomized manner; an observer performed the behavioral testing in a blinded procedure.
Nomenclature of MR probes
For consistency with standard nomenclature, which specifies the use of capital letters for proteins, we use lowercase letters to denote mRNA-targeted probes (SPION-gfap) and uppercase letters to denote potential antigen-targeted probes, which we will develop and present at a later time. All sODNs are antisense in orientation, unless otherwise specified. We use the term SPION-Ran to denote probes with a random (scrambled) sequence. Intracellular antisense sODN remains intact for ≥8 h (20, 31).
Preparation of SPION-sODN
We functionalized and linked fresh SPION (Molday Ion, CL-30Q02-2; BioPhysics Assay Laboratory, Worcester, MA, USA) to NeutrAvidin (NA) using Schiff-base reaction to form SPION-NA with a stoichiometric ratio of 0.5 or 10 mg NA/20 mg SPION. We synthesized a 5′-biotin-labeled sODN of antisense (AS)-gfap (5′-gtctccgctccatcctgccc-3′-biotin) that targets GFAP mRNA of the mouse (26). The sequence for ODN of sense (S)-gfap was 5′-gggcaggatggagcggagac-3′-biotin. The biotinylated sODNs of AS-gfap and SPION-NA were conjugated via NA-biotin linkage, forming SPION-gfap. As in our previously published studies, we used an intracerebroventricular (i.c.v.) injection procedure to deliver the probe to the brain in the live mice (27).
Delivery and experimental design
After administering general anesthesia (2% halothane in pure oxygen, 800 ml/min free breathing) to each mouse, we delivered SPION-gfap or other control SPION-sODNs (1 μg Fe or 3 pmol sODN per mouse of 25 g) via an i.c.v. route, using a stereotactic guide (L: −1 mm; P: 0.3 mm; D: −3/5 mm, bregma). In addition to autoshimming before each scan to reduce signal inhomogeneity resulting from B0, we used the following design for each MR acquisition, in order to determine whether the 9.4-T MR system itself contributed significantly to variation in MRI data acquired on different dates. On each MRI acquisition day, we included a control group along with the experimental (amphetamine-treated) mice. We delivered SPION-gfap to ≥4 but ≤8 mice, with 2 mice reserved as controls (without amphetamine). We acquired ≥5 brain slices (0.5 mm each) from each mouse as described previously (21). Comparing the data from mice in the control group to assess potential variation, we found that the average and sd for each region of interest (ROI) in the 5 brain slices were not statistically significantly different (t test, P>0.05). Furthermore, the means ± se of the two controls were not statistically different from those of previous control groups that received similar treatment on different days. By analyzing the accumulated data from control mice scanned on different days, as well as from different litters, we can examine within- and between-litter differences, as well as spikes of inhomogeneity related to B0. To determine the overall number of mice required for each experiment (to achieve P=80%; α=0.05%), we performed power analysis using the means ± se from the experimental group and the control group scanned each day. By using power analysis to calculate sample size, we are able to minimize type II error. Once we completed MRI scans on the minimum number of mice, we performed statistical analysis (see below).
Transfection of sODN to pheochromocytoma-12.1 (PC-12.1) cells
The ability to transfect cells grown in culture would demonstrate the homogenous or inhomogeneous distribution of ODN to all cells, with equal chance for retention. Our previous studies that aimed to demonstrate transfection in primary neuronal cultures for sODN uptake were not conclusive, partially due to the instability of gene expression in primary neural cultures. Therefore, we modified our methods to examine cultures of rat PC-12.1 cells, multipotent neural crest cells (28) that express GFAP mRNA. The PC-12.1 cells, which we purchased from a commercial source (American Type Culture Collection, Manassas, VA, USA), were seeded overnight (100 cells each) in 3 ml of F-12 medium (ATCC) with 2.5% FCS and 15% horse serum (Gibco, Grand Island, NY, USA) in a glass-bottom dish without polylysine coating (MatTek Corp., Ashland, MA, USA); they were incubated at 37°C, in humidified air with 5% CO2 for ≥2 d. We transfected sODNs [cyanine 3 (Cy3)-AS-gfap, Cy5-S-gfap or fluorescein isothiocyanate (FITC)-Ran in 3 μl saline without liposomes] to PC-12.1 to a final concentration of 10–30 nM, and returned the dish to the incubator for 3 h. We terminated transfection by changing the culture medium twice with fresh prewarmed medium and transferred the dish to a miniature incubator chamber (model INU-UK-F1; Tokai Hit Inc., Shizuoka, Japan) on the stage of an upright microscope (Olympus, Lebanon, NH, USA). We acquired live-cell images of sODN uptake and retention at different time points, for up to 24 h, using automatic time-lapse photography with constant exposure time and image gain (CellSense Imaging Software; Olympus). Representative cell images were cropped and processed using Adobe Photoshop CS2 (Adobe Systems, San Jose, CA, USA); the intensities of images were not altered.
Transfection of sODN to ex vivo brain tissue
Brain slices (60 μm) from C57BL6 mice were prepared using a vibratome (VF200; Precisionary Instruments, San Jose, CA, USA) and incubated in an uncoated glass-bottom dish (MatTek) in artificial cerebrospinal fluid or F-12 medium containing 10% horse serum at 37°C, in humidified air with 5% CO2. We added sODNs (10 nM), Cy5.5-labeled SPION or SPION-gfap (0.5 μg Fe/dish, without liposomes) to brain slices in the miniature incubator system (Tokai Hit). After 30 min, we washed the culture medium twice to stop transfection (see above). Time 0 marks the time sODNs or MR probes were washed from the cells, and we acquired live-cell imaging for sODN uptake and retention before and after changing the culture medium.
MRI acquisition procedure and image signal determinations
All MRI in vivo acquisitions were performed using a 9.4-T horizontal scanner (Bruker-Avance System; Bruker BioSpin Corp., Billerica, MA, USA). High field strengths of ≥9.4 T provide excellent signal-to-noise and MRI resolution for in vivo imaging of live small animals. With proper shimming to fine-tune each acquisition, as well as preexclusion of data from mice that show variant baseline MRI, an increase in the transverse relaxation rate of proton spins (ΔR2*) has been shown to be proportional to vascular iron concentration (29). However, high-field MRI is also very susceptible to field inhomogeneity, and acquisition of T2*-weighted images, such as those we acquired in this study, requires special attention, as described here. The mice were anesthetized with 2% halothane in oxygen during scanning at 9.4 T. The protocols that we used for MRI acquisition, R2* map construction, and data analysis have been described in detail previously (30, 31). Briefly, we acquired a series of gradient echo images of ≥5 brain slices from each mouse, with incremental echo spacing (TE) to compute R2* maps (TR=500 ms, TE=3, 4, 6, 8, 10 ms, 200×200×500 μm3 resolution, flip angle of 30°, image averaging of 2). To obtain maximum field strength homogeneity inside the gradient for signal sensitivity and reproducibility, we performed automatic or manual shimming before scanning each mouse. We acquired MRI before (baseline) and 6 h after SPION delivery.
Data processing for MR image alignment, R2* map calculation, and ROI analysis
The series of gradient echo images with constant TR and incremental TE values were first aligned to template images using the JIP fMRI Analysis Toolkit [available from the U.S. National Institutes of Health (NIH) Neuroimaging Informatics Tools and Resources Clearinghouse (NITRC) website, http://www.nitrc.org/projects/jip]. Briefly, the images were automatically and manually aligned using 12 degrees of freedom: 3 each for rotation, translation, inflation, and skew. We fine-tuned the image alignment by visual comparison to the template images, focusing on obvious landmarks, such as the corpus callosum and outlines of the ventricles, and then constructed R2* maps from the aligned images by pixelwise linear fitting of M = Mo × exp (−TE/T2*); R2* in each pixel was computed from the T2* value (R2* = 1/T2* ms × 1000, s−1). As part of the ROI analysis, we extracted mean R2* values from the brain regions contralateral to the punctured hemisphere, according to The Mouse Brain in Stereotactic Coordinates (32) and using the MRVision image analysis software package (MRVision, Winchester, MA, USA). The mean ± se R2* values of each ROI were calculated in each group and compared to prescan R2* (baseline) values using a t test (P≤0.05). We used a post hoc power analysis to compute the sample size required, in order to avoid type II error (P=80% at α=0.05). ΔR2* values were computed with reference to baseline R2* and were calculated as percentage increase maps: (A8 − A1)/A1 × 100%.
Contrast-to-noise ratio (CNR)
CNR is defined as the ratio of the difference between two image signals to the square root of the standard deviation of the background noise. For our purposes, R2* maps from preinfusion, or baseline, brains showing endogenous iron levels serve as the background, and their sd values are the noise to R2* maps of brains containing SPION-sODN. Therefore, we defined the CNR representative of SPION-gfap uptake in each ROI, and at any given time point, as the change in contrast, i.e., ΔR2* (R2*SPION-sODN − R2*baseline) divided by noise (sd−1/2 of R2* within the same ROI in baseline brains).
MR microscopy ex vivo
We acquired ex vivo MRI data using a 14-T vertical bore MRI scanner (Bruker Avance System). Brain samples were prepared and imaged using the procedure we have described in our previously published studies (30). Briefly, we delivered SPION-gfap to mice under general anesthesia, then perfused and collected the brains 1 d after i.c.v. delivery (27). We immersed the whole mouse brain in a 1-cm NMR tube filled with FC-40 solution, which nulls the background signal. We acquired 3-dimensional high-resolution T2*-weighted images to delineate brain structures and visualize SPION, which causes a reduction in the MR signal. The total scan time was ∼12 h (FLASH sequence, TR/TE=50/18 ms, 50×50×100 μm3, flip angle of 20°, image averaging of 24).
Transfection and uptake in vivo
We infused Cy5-AS-gfap (120 pmol/kg, i.c.v.) to the lateral ventricle of the brain in normal mice (n=3) or transgenic mice [B6;DBA-Tg(Fos-tTA,Fos-EGFP*)1Mmay Tg(tetO-lacZ,tTA*)1Mmay/J, a GFP-producing strain under the c-Fos-promoter; n=2] or FITC-AS-gfap to normal mice (n=4). At 6 h after delivery, we collected mouse brain samples, then flash-froze them in n-butanol on a flotation disk (aluminum, 2×2 inch) above liquid nitrogen. To examine the samples for sODN uptake, we sectioned the tissue samples in 20-μm sections using a cryostat sectioner. Following a 15-min postfix with freshly prepared ice-cold 4% paraformaldehyde (PFA) in PBS, we rinsed the tissue samples in saline and distilled water. Sections were stained for glia; we used propidium iodide to stain for nuclear DNA in tissue samples obtained from transgenic mice, and rhodamine (Rhd)-labeled rabbit antibody against GFAP protein in tissue obtained from normal mice. We examined the fluorescence from FITC-AS-gfap (max emission 525 nm, green), Cy5-AS-gfap (max emission 662 nm, violet), or propidium iodide (max absorbance 546 nm, red) using an Olympus fluorescent microscope with compatible filters.
Transmission electron microscopy (TEM)
We delivered SPION-gfap (40 μg/kg, i.c.v.) and prepared the mice for TEM examination 4 h later. A 1-mm cube of brain tissue was excised under a dissection microscope, then incubated in freshly prepared, ice-cold fixative of 2% PFA and 2.5% glutaraldehyde in 0.1 M phosphate buffer (pH 7.4, 4°C, overnight). The sample was rinsed in 0.1 M phosphate buffer at room temperature. Each sample was coded with a number, and all of the samples were transferred to the Histology Core Facility of the Systems Biology Division at Massachusetts General Hospital for TEM sample preparation and image acquisition (33). The samples were prepared according to procedures in the literature (34). Data acquisition was coded in a blinded procedure, and the coded photographs were delivered to and decoded by the senior principal investigator.
Gene transcript copy number by RT-PCR ex vivo
We extracted the total RNA from the brain tissue of each mouse using RNeasy lipid tissue mini kit (Qiagen, Valencia, CA, USA); all buffers were supplied in the kit. For RT-PCR, we obtained total RNA from striatal or hippocampal tissue from 3 groups of mice that were administered saline (SAL; control, n=4) or amphetamine, in 1 dose (A1, n=4) or in 8 doses (1 amphetamine dose every other day, A8, n=5). The total RNA from each mouse was reverse-transcribed using oligo (dT)25 and the SuperScript III first-strand synthesis system (Invitrogen Life Technologies, Carlsbad, CA, USA). The initial RNA concentration in each sample was determined by OD260 and then converted to the total amount of RNA. Preparation of striatal tissue from one side of each mouse brain yielded 2.8 ± 0.9 μg total RNA in 40 μl of solution. From each sample, we used 280 ng, or 4 μl, total RNA to synthesize cDNA in 20 μl of total volume of buffer solution; 1 μl of this solution was used for PCR. Because gfap mRNA is relatively abundant, we used 40 PCR cycles. The mRNA copy number by PCR was performed using a TaqMan probe-based assay (Applied Biosystems, Foster City, CA, USA) for GFAP (assay ID: Mm01253034_m1). We used β-actin (assay ID: Mm02619580_g1) as the internal control. We carried out relative quantification of the mRNA using standard SDS software, which is based on ΔΔCt models (35). Using exported raw data from the SDS software, including fluorescent reading vs. cycle numbers, we determined the absolute mRNA copy number in the tissue using a computer algorithm developed by Smith et al. (36); this algorithm is publicly accessible from the NIH website (http://www.niehs.nih.gov/research/resources/software/pcranalyzer).
Histology and immunohistochemistry
Immediately following MR acquisition, the mice were transcardially perfused with freshly prepared and pH-adjusted 0.1 M phosphate buffer (PB; 10 ml) followed by 4% PFA (50 ml) in 0.1 M PB (0.1 M Na2HPO4/NaH2PO4, pH 7.4) (27, 30, 37). We removed and postfixed the brains in 4% PFA for 2 h, and then placed them in 0.1 M PB (pH 7.4) and 0.05% NaN3 at 4°C. Coronal sections (40 μm) were cut in a cryostat and kept in PB (pH 7.5) with 0.05% NaN3 at 4°C. Free-floating sections were rinsed in PBS (0.1 M PB and 0.9% NaCl, pH 7.4). Sections were incubated for 30 min in 3% goat serum and 0.3% Triton X-100 in PBS and then incubated overnight in GFAP antibodies (1:1500 dilutions) at 4°C. The next day, sections were washed 3 times in PBS, and then incubated for 2 h at room temperature with 1:200 goat anti-rabbit IgG (Vector Laboratories, Burlingame, CA, USA). Incubation for 1 h in room-temperature avidin-biotin-peroxidase complex (ABC) solution (Vector Laboratories) followed, and sections were then washed 3 times with PBS (10 min/wash) and developed for 7 min with 2 mg/ml 3,3′-diaminobenzidine tetrahydrochloride (DAB; Sigma, St. Louis, MO, USA). The secondary IgG can be labeled with Rhd or Cy3 for direct detection.
Statistical analysis and goodness of fit of assay results
We assessed gene expression by comparing SPION retention with the gene copy number for each paradigm, using GraphPad Prism IV software (GraphPad, La Jolla, CA, USA) to analyze the data. We computed the means ± se from the 5-slice averages of all mice in each group, and compared the statistical significance of the experimental and control groups using a t test (1-tail, type II, or equal variant). A value of P < 0.05 was statistically significant.
RESULTS
Preferential retention of transfected sODN-gfap
We first transfected rat PC-12.1 progenitor cells with antisense sODN to gfap mRNA (Cy3-AS-gfap) and acquired images at the termination of transfection (h 0) using time-lapse imaging for 21 h. Figure 1A shows that PC-12.1 cells took up antisense Cy3-AS-gfap and retained it for ≥2 h with only a slight reduction in intensity in the nucleus or cytoplasm. The signal lasted for several hours (not shown). Because sODN with sense sequence has been widely used as a control in knockdown strategies or in situ hybridization, we compared the uptake and retention of S-gfap corresponding to gfap mRNA (Cy5-S-gfap, labeled with Cy5) to that of a random sequence (FITC-Ran); at the same time and in the same dish, we tested a control with antisense sequence to histone deacetylase-5 (HDAC5) mRNA (Cy3-AS-hdac5). Figure 1B shows that PC-12.1 cells took up all sODNs during transfection, although the intensity of Cy5-S-gfap and antisense Cy3-AS-hdac5 was stronger in the nucleus than in the cytoplasm. We observed that FITC-Ran was no longer detectable at 20 min, but that Cy5-S-gfap remained in PC12.1 cells, with strong nuclear intensity (Fig. 1C). We also found that PC-12.1 cells excluded most of the Cy5-S-gfap at 70 min (not shown). We then compared the retention of these three sODNs in fresh brain slices from C57BL6 mice, and observed the same results: neural cells took up all three sODNs during transfection (Fig. 2A), but excluded FITC-Ran within 5 min after transfection (Fig. 2B), and the same cells excluded most, but not all, Cy5-S-gfap within 10 min (Fig. 2C, arrows).
Figure 1.

A) Rat PC-12.1 neural progenitor cells, in F12 medium with 10% horse serum in a dish with a polylysine-free (noncoated) glass surface, retained antisense Cy3-AS-gfap in the nucleus (solid arrows) and cytoplasm (dashed arrows) for ≥2 h after transfection. B) We compared retention of 3 sODNs: sense sequence to gfap mRNA (Cy5-S-gfap, labeled with Cy-5); an 18-mer with a randomized sequence, no intracellular target (FITC-Ran); and a control antisense to histone deacetylase 5 (HDAC5) mRNA (Cy3-AS-hdac5; used to avoid the presence of a target for Cy5-S-gfap had Cy3-AS-gfap been used). PC-12.1 cells retained all sODN during transfection. C) FITC-Ran was excluded or degraded immediately at 20 min (C) after medium wash; Cy5-S-gfap was retained in the cells for in both the nucleus and cytoplasm for ≥70 min (not shown).
Figure 2.

Fresh living brain slices with thickness of 60 μm were harvested and incubated in F12 medium with 10% horse serum in a dish with a polylysine-free (noncoated) glass surface. A) We transfected 3 sODNs (each at 10 nM) as in Fig. 1. All sODNs were retained in neural cells (dashed arrows). After 30 min, sODN was removed by washing twice in sODN-free medium, and then the tissue was incubated in fresh medium (time 0). B, C) Photographs show different time points, 5 min (B) and 10 min (C) after sODN removal by washing in fresh medium. Solid arrows point to neural cells that exhibited slow exclusion or degradation of Cy5-S-gfap. A fast exclusion or degradation of FITC-Ran in these cells suggests the cells are viable. Scale bars = 12.5 μm.
Neural cells very selectively retain sODN-gfap in vivo
To demonstrate that neuroglial selectivity for SPION-gfap depends on the retention of AS-gfap, we aimed to identify which cell types would retain AS-gfap. We transfected Cy5-AS-gfap (3 pmol sODN per mouse, i.c.v.) to transgenic mice [B6;DBA-Tg(Fos-tTA, Fos-EGFP*)1MmayTg(tetO-lacZ,tTA*)1Mmay/J] that produce GFP in c-Fos-expressing neural cells, allowing a 4- to 8-h period for uptake after i.c.v. administration. We found that Cy5-AS-gfap (Fig. 3A1, purple pseudocolor) was retained in neural cells smaller than 5 μm (Fig. 3, dashed arrows), and some of those cells expressed c-Fos-derived GFP. Most important, we observed no Cy5-AS-gfap in GFP-producing cells larger than 5 μm (Fig. 3A1, A2; circles). To validate the specificity of retention of AS-gfap, we compared the uptake of SPION-gfap and SPION-NA. Specifically, we conjugated Rhd-AS-gfap-biotin to Cy-5.5-SPION-NA and transfected fresh brain slices by adding Cy5.5-SPION-gfap or Cy5.5-SPION-NA directly to the culture medium for 30 min. We observed that neural cells took up Cy5.5-SPION-gfap (Supplemental Fig S1A) and Cy5.5-SPION-NA (Supplemental Fig S1B) in such a way that all cells exhibited intense labeling. After repeated washings at the end of 30 min transfection, we found that neural cells excluded Cy5.5-SPION-NA within 10 min after transfection, and retained Cy5.5-SPION-gfap for ≥90 min (boxed area, Supplemental Fig. S1A). We did not observe cells labeled with Rhd-AS-gfap during this period of time (not shown), indicating that Rhd-AS-gfap was conjugated to SPION. These findings, therefore, demonstrated that SPION-gfap remained linked for ≥90 min. To confirm that the smaller cells that retained SPION-gfap are neuroglia, we applied Rhd-IgGxGFAP to identify GFAP+ cells in tissue samples ex vivo (27, 30, 37). Figure 3B1–B3 shows the localization of Cy5.5-SPION-gfap in GFAP+ cells <5 μm in diameter. No neural cells >5 μm in diameter were identified as GFAP+ in Fig. 3C (dashed arrows).
Figure 3.
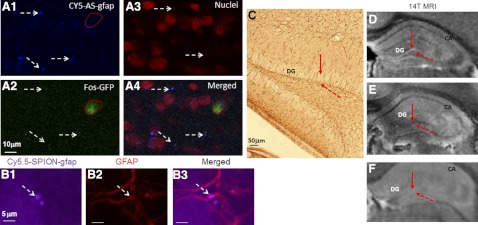
We transfected Cy5-AS-gfap (5 pmol/mouse, i.c.v.; n=2) to live transgenic (B6;DBA-Tg(Fos-tTA, Fos-EGFP*)1MmayTg(tetO-lacZ,tTA*)1Mmay/J) mice that produce GFP in neural cells expressing cFos. Because GFP induction requires c-Fos antigen, we administered amphetamine (4 mg/kg, i.p.) 3 h after Cy5-AS-gfap delivery to induce c-Fos antigen, and prepared brain samples 1 h later. Cy5-AS-gfap is shown as pseudocolor purple (A1); propidium iodide (red; A3) stains the nuclei (confocal microscopy). Neural cells with small nuclei (<5 μm; dashed arrows) take up Cy5-AS-gfap (A1–A4) and Cy5.5-SPION-gfap (B1–B3), express GFAP antigen (B, C), and retain SPION-gfap (D). The neuronal formation of the dentate gyrus (DG) shows neither GFAP antigen (C, solid arrow) nor signal reduction associated with SPION-gfap (D, solid arrow); however, signal reduction as the result of SPION-cfos retention is observed in the DG (E). No enhanced image contrast is observed in mice without SPION-sODN infusion (F). The cornu ammonis (CA) formation contains mixed neurons and neuroglia, and signal reduction appears for both SPION-gfap (D) and SPION-cfos (E) in MRI. All animals (n=2 each, A1–F) received 40 μg Fe/kg, 120 pmol sODN/kg, or saline (2 μl) by i.c.v. route.)
Signal specificity for ex vivo MR microscopy by sODN-gfap or SPION-gfap
To further validate SPION-gfap in the neuroglia for MRI, we aimed to demonstrate no retention of SPION-gfap in neurons. The dentate gyrus (DG) region of the hippocampus is known to have a unique neuronal formation (GFAP−; Fig. 3C, solid arrows), with neuroglia (GFAP+; Fig. 3C, dashed arrows) in the tissue surrounding the neuronal formation. Our hypothesis was that the neuronal formation in the DG would not show negative MRI signal. We compared the signal reduction patterns in the DG in 3 groups of mice that received SPION-gfap, SPION-cfos (a control that would exhibit very minimal signal reduction in neurons), or no infusion (control without expected signal change). We used a 14-T MRI system to acquire 3-dimensional T2*-weighted MR microscopy in ex vivo mouse brains collected 1 d after infusion of SPION-gfap or SPION-cfos (40 μg Fe/kg or 120 pmol sODN/kg, i.c.v.). As the MRI data showed, there was no signal reduction in the DG in brains from animals given the SPION-gfap infusion (Fig. 3D, solid arrow), but signal reduction was seen in brains previously infused with SPION-cfos (Fig. 3E, solid arrow). There was no image contrast to delineate the structure of the neuronal formation in the control brain (Fig. 3F).
Neuroglial uptake of SPION-gfap, a TEM study
We used TEM to confirm the distribution and uptake of SPION-gfap in small neuroglia. At 4 h after SPION-gfap delivery by i.c.v. injection, we collected brain samples from the nucleus accumbens (NAc) in the hemisphere contralateral to the i.c.v. injection site. Because membrane-enclosed electron-dense nanoparticles (EDNs) are difficult to identify in brain samples, both with and without SPION-sODN (Supplemental Fig. S2), we examined samples without lead stain to reduce the background. We identified several EDNs around the one capillary that had a 6-μm inner diameter (Fig. 4A) and in several glial cells (Fig. 4B, C). There were no EDNs in either the capillary lumen (Fig. 4A), or in the neuron located adjacent to glia (Fig. 4B; dashed arrow shows the boundary of the neuronal membrane). Moreover, the EDN appeared to be located in the endoplasmic reticulum of neuroglia (Fig. 4C). This observation is consistent with the result shown in Fig. 3, which also indicates that the dose (40 μg Fe/kg, i.c.v.) of SPION in sODN-gfap is sufficient for cell tracking in vivo, as nontargeting SPION was excluded from neural cells (Supplemental Figs. S2 and S3). SPION-gfap is a multimodal contrast agent for MRI and TEM.
Figure 4.
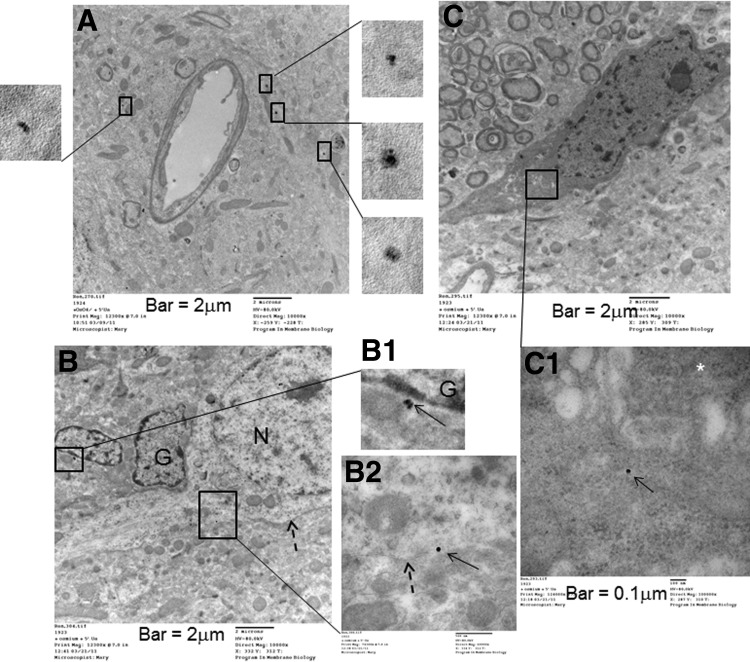
SPION-gfap uptake in glia of 3 mouse samples (partially stained with uranyl acetate) was examined by TEM. A) Several EDNs (boxes) were present around a small vessel (perivascular uptake); no EDN was present in the vascular lumen. B–B2) Intercellular border of a neuron (B, B2; dashed arrows) and enlarged views of EDN in boxed areas in B (B1, B2; solid arrows). N, neuronal nucleus; G, glial nuclei. C, C1) One EDN (C1; solid arrow) within the endoplasmic reticulum in neuroglia. Fully stained samples (osmium, uranyl acetate, and lead citrate) are presented in Supplemental Fig S2.
Optimal CNR after SPION-gfap uptake
To establish the window of MRI detection of the SPION-gfap probe, we determined the optimal CNR of SPION-gfap in vivo by conducting repeat MRI scans in the same group of mice (n≥3/group) 2, 4, and 6 h after i.c.v. infusion. At each time point, we acquired a series of T2*-weighted MRI scans to generate R2* maps of the signal of cerebral iron concentration, maintaining a consistent signal-to-noise ratio of 50 to 70 for TE = 3 ms scans in each session to ensure good-quality MR images. We extracted the mean ΔR2* values from different ROIs contralateral to the injection site (Fig. 5A, B; arrows). The entire protocol was repeated until we imaged the necessary number of mice, as previously determined by a power analysis (P=80%; α=0.05) of the data from the first MRI scan. We first compared group-averaged ΔR2* values to preinfusion (baseline) values within the same ROI (30) at 2, 4, and 6 h to determine the best time to acquire MR images. Figure 5C shows significant R2* elevation at 4 and 6 h in most ROIs, including the medial prefrontal cortex (mPFC), caudate-putamen (CPu), hippocampus (hippo), and motor cortex (MC) outlined in Fig. 5B. Because it was difficult to determine whether the 4- or 6-h time point provided more uniform imaging contrast among the ROIs, an additional comparison was performed on the basis of CNRs. Figure 5D shows the average CNR values from all ROIs (horizontal bars), calculated from the composite mean CNR obtained from 6 ROIs (symbol notations) at 4 different time points. While individual CNRs at h 0 were relatively uniform and low (mean±se=2.6±0.3), the CNRs of different ROIs became scattered at 2 h (2.5±4.6) and 4 h (10.7±4.4), and finally converged at 6 h (12.2±2.7). We observed a gradual increase in the average CNR, from 2 to 4 h after SPION-gfap delivery, and afterward, a plateau with a smaller increase toward 6 h. Relatively large interregional variations in CNR 4 h before this plateau can be attributed to differential dynamics of probe distribution, uptake, retention, and clearance in different brain regions. On the basis of these observations, we determined that 6 h after i.c.v. infusion is the optimal time point at which SPION-gfap provides sufficient MRI signal specificity of SPION-gfap for whole-brain imaging.
Figure 5.
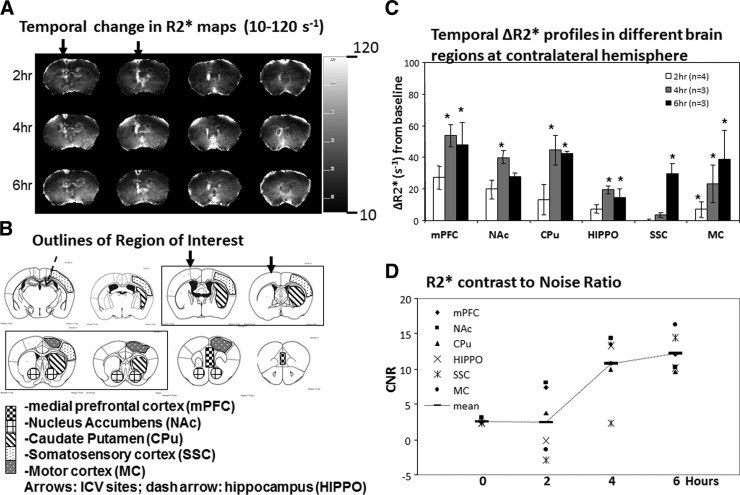
Optimal contrast for MRI in vivo. A) Representative R2* maps at 2, 4, and 6 h after i.c.v. infusion of SPION-gfap with a scale bar ranging from 10 to 120 s−1. B) ROIs from which R2* values were extracted for panels C and D (32). C) ΔR2* values in all ROIs at 2, 4, and 6 h after i.c.v. infusion of SPION-gfap; Δ R2* is significantly elevated in most ROIs at 4 and 6 h. *P < 0.05; t test. D) CNR analysis indicates that although CNR was much improved at 4 h, regional variation among the ROIs was reduced significantly thereafter; i.e., probe distribution had reached steady state at 6 h.
Amphetamine-induced changes in gfap mRNA by MRI
To demonstrate the sensitivity of SPION-gfap for reporting the change in GFAP mRNA levels in vivo, we designed our experimental scheme for both acute (A1) and chronic (A8) amphetamine exposure paradigms. We observed that ΔR2* was high above the baseline (ΔR2*=0) in the normal group (SAL), but that the A1 and A8 groups exhibited significant reduction following amphetamine exposure (Fig. 6B). The reduction was observed in vivo in 5 of 6 ROIs in the mesolimbic pathway, as well as in the cortices [mPFC, somatosensory cortex (SSC), and MC] and striatum (NAc and CPU). Moreover, there was slight elevation in the SSC in animals assigned to the A8 group compared to the A1 group. In any of the three groups, the hippocampus showed no significant change.
Figure 6.
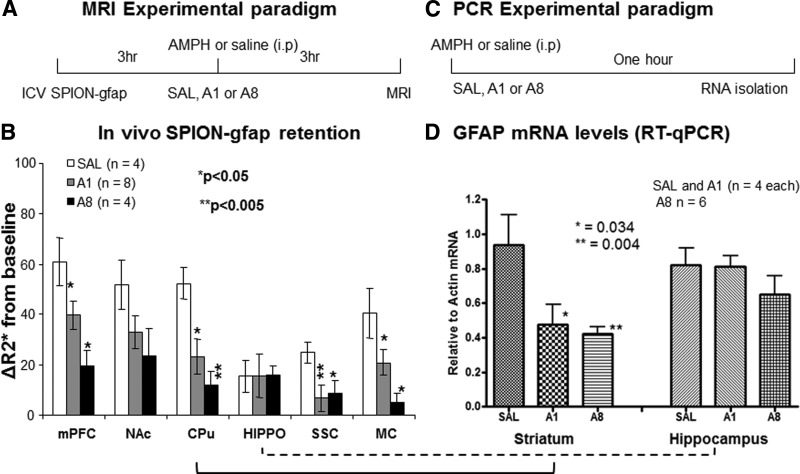
Amphetamine-induced changes in GFAP mRNA expression by GT tMRI and RT-PCR. At 2 wk before MRI, 6 mice were given saline (n=4) or amphetamine (4 mg/kg, i.p., n=2) injections, once every other day for a total of 7 doses. On the day of MRI, we administered SPION-gfap to all 6 mice. After 3 h, we subdivided the 4 mice in the saline group, and injected them with saline (SAL group; n=2) or amphetamine (A1 group; acute exposure, n=2); the animals in the chronic exposure paradigm (A8 group) were administered one final amphetamine dose (30); there was no drug withdrawal period in this study. We then acquired R2* maps of the brains 3 h later (i.e., 6 h after i.c.v.), as described herein for optimal CNR, the earliest time point for sufficient SPION-gfap MR signal specificity. The entire protocol was repeated, as determined by power analysis (P=80%; α=0.05) of the data from the first MRI. A) MRI paradigm used on the day of experiment. B) Changes in ΔR2* after amphetamine showed differential decrease across the SAL, A1, and A8 groups in all brain regions except hippocampus (hippo). C) Experimental paradigm used on the day of ex vivo gene activity measurements. D) RT-PCR of GFAP mRNA collected 30 min after amphetamine showed significant reduction in gfap mRNA levels in the striatal regions (CPu), but not in hippocampus; this was true for all paradigms. Means and se (error bars) from each group are shown. Western blotting showed a slightly, but not significant elevation of striatal GFAP levels in A1 group (n=3) and A8 group (n=5) (Supplemental Fig S6).
Amphetamine-induced changes in GFAP mRNA by TaqMan analysis
We measured GFAP mRNA levels using TaqMan assays to confirm that in vivo R2* changes reflect gene activities. We obtained tissue samples from the striatum and hippocampus of SAL, A1, and A8 mice (n=4/group, no SPION-gfap treatment) 30 min after the last amphetamine treatment (Fig. 6C), and analyzed GFAP mRNA relative to actin mRNA in each animal, comparing the average GFAP mRNA relative to actin mRNA in each animal using TaqMan probes. We observed that GFAP mRNA transcription activities in the striatum were significantly reduced in both the A1 and A8 groups compared to the SAL group; there was no significant change in GFAP mRNA levels in the hippocampus samples. These data confirm that the MRI measurements in vivo agree with the TaqMan assay measurements of GFAP mRNA copy number (Fig. 6D). We observed similar changes in both GFAP mRNA copy number and ΔR2*, with a positive correlation in the striatum, perfect goodness of fit (R2=1.0), and significant increase from 0 (P=0.01). However, the se for each group was wide, with some overlapping (Supplemental Fig. S4). We observed the same correlation in the transcripts of three different mRNAs in the normal striatum (Supplemental Fig S5). Regardless of the method of detection, all except FosB mRNA exhibited large se, with no overlap. The correlation supports the notion that both gene transcript targeted MRI (GT tMRI) and RT-PCR report gene activities with the same mechanism of hybridization between sODN primer and mRNA target. Western blot assay revealed no significant striatal gliosis (elevation in GFAP antigen) in the A1 (n=3) and A8 groups (n=5) (Supplemental Fig S6).
Changes in GFAP mRNA reflect gliogenesis by SPION-gfap
To investigate whether there was a change in neuroglial population in regions other than the mesolimbic pathway, we compared ex vivo GFAP+ cells in the A8 and A1 groups (Fig. 7). Using the MR image data acquired after SPION-gfap infusion (and after acquiring the R2* maps), we deducted the averaged R2* maps obtained from the A1 group from those of the A8 group to generate a subtraction map showing GFAP+ cells in the A8 paradigm vs. the A1 paradigm. Although we observed no difference in the elevation of striatal gfap mRNA (in percentage increase) in the A8 group compared to the A1 group (Fig. 6B), we did observe significant gfap mRNA elevation in portions of the SSC and subventricular zone (SVZ) in the A8 mice (Fig. 7A). Immunohistochemistry of ex vivo samples confirmed that GFAP+ cell count in the SVZ was higher in the A8 mice than in the normal mice (Fig. 7B). In summary, our results show that the sensitivity of GT tMRI is similar to that of RT-PCR; both methods detect the level of mRNA where it is expressed. The GT tMRI reports regional changes similar to immunohistochemistry for the number of neuroglia based on GFAP expression. We conclude that the sensitivity of MR detection in our experimental setting enables us to discriminate regional gliogenesis in vivo in a manner comparable to the most sensitive conventional ex vivo assay methods.
Figure 7.
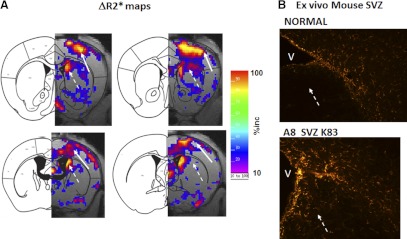
Amphetamine-induced gliogenesis (dashed arrows) in the SVZ of A8 group. A) Subtraction map illustrating the percentage increase in the A8 group, compared to the A1 group [(A8 − A1)/A1 × 100%], scale = 0–100%. Solid arrows indicate gliogenesis in the SSC. B) Greater number of neuroglia (gliogenesis) in the SVZ in A8 mice (1 of 4 is shown) compared to the SVZ of a normal mouse. V, cerebral ventricle.
DISCUSSION
We show here that SPION-gfap enables in vivo MRI detection of acute changes in neuroglial populations associated with amphetamine-induced neurotoxicity in the mesolimbic reward pathway of living brains. We also show that SPION-gfap detects gliogenesis in the SVZ following chronic amphetamine exposure. Results from advanced assays of TEM and TaqMan analysis confirm the MRI results. Drugs of abuse are chemically diverse, and their actions in the brain often converge to produce common effects that activate neural cells in brain regions of the mesolimbic dopaminergic pathway (38). We have developed a technique to tag various neural cells in vivo using a probe consisting of an MR contrast agent and antisense sODN that hybridizes to GFAP mRNA. Here, we have demonstrated in an animal model of brain injury that SPION-gfap and GT tMRI reveal regional change in neuroglia population with sensitivity (without amplification) comparable to that of advanced PCR and immunohistochemistry. Compared to basal-level transcription activity in the brains of saline-treated animals, we found that GFAP mRNA transcription decreased below the basal level following amphetamine exposure. This decrease indicated that amphetamine elicited a neurotoxic effect by reducing neuroglial population (39), which, in turn, further triggered regional gliogenesis in the SVZ (3, 6, 40, 41). The decrease in GFAP mRNA also suggests that SPION-gfap has stringent selectivity for neuroglia, and provides sensitivity for detection by MRI. This GT tMRI method is unique for detecting changes in living cells, as dead or dying cells lack the ability to degrade and exclude sODN, which is the basis of selectivity.
By tagging neuroglia with a SPION-gfap probe that makes them detectable by in vivo MRI, we were able to compare the transfection specificity and signal sensitivity of SPION-gfap for preclinical investigation. Our MRI results have been validated by several technologies commonly used in advanced molecular biology; i.e., RT-PCR or TaqMan analysis of ex vivo gene transcript copy number, TEM, and immunohistochemistry in normal and transgenic mice. Our observation of SPION-sODN enclosed in the membrane led us to conclude that endocytosis mediates contrast agent uptake, which others have also reported (42). Our MRI results also agree with the observation of reduced striatal neuroglia populations in human autopsy samples from methamphetamine users (8, 43–47). Our findings are consistent with those from animal models of schizophrenia or the manic phase of bipolar disorder (48), but disagree with studies involving GFAP antigen; this includes our studies, as well as those of other investigators (3, 6, 40, 41, 49, 50). Such disagreement may reflect the fact that proteins have longer half-lives (51), GFAP tends to accumulate (52), and minute changes in GFAP antigen can be undetectable by Western blot (Supplemental Fig S6) or immunohistochemistry (data not shown). However, changes in GFAP mRNA levels associated with transcription activity are unlikely to be cumulative, as gene transcript tagging is sensitive to real-time fluctuations in copy number in vivo. Indeed, the results from our ex vivo mRNA-based assays support our MRI observations in vivo. Although the resolution of MR images acquired at 9.4 T is 120 μm (inferior to the 5 μm achievable resolution with immunohistochemistry assay in Fig. 3B), MRI can reliably detect elevated glial function or gliogenesis induced by amphetamine or brain injury.
BBB-permeable modality has been developed for various models (53), but intravenous probe delivery is typically used when the BBB is disrupted, for example, by focused ultrasound or by experimentally induced cerebral ischemia (54). Many studies have employed a BBB bypass approach to deliver sODN (16, 17), antibody-mediated pODN (15), tumor xenografts (55), reporter genes (56), or optogenes (57) to normal mice. We have shown that when delivered in solution directly to the cerebrospinal fluid in the ventricles by similar BBB-bypass routes, the contrast agent flows through the perivascular space and is taken up by neural cells (21). Following transfection, the preferential exclusion properties of the cell mediate the selection of SPION-sODN based on the available mRNA in real time (30, 31), providing the window for MRI acquisition, as demonstrated by our observations of SPION-gfap uptake and retention in GFAP+ cells. The results we have acquired in mouse brains demonstrate consistency under physiological conditions. All of the modalities we have employed validate the hypothesis that SPION-gfap is retained in GFAP+ cells, but not retained in the neuronal formation of the DG, which comprises GFAP− cells. MRI demonstrates sensitivity similar to that of PCR studies of GFAP mRNA, and both TEM and MRI are consistent with the hypothesis that SPION-gfap reports neuroglial populations in various ROI.
Although the methodology for TaqMan estimation of gene copy number differs from our MRI technique, we have found agreement in the results of both approaches. Therefore, we can conclude that accurate base pairing of primer to its target sequence, or hybridization, serves as the detection mechanism of GT tMRI and TaqMan analysis. However, we cannot definitively confirm that the MR-derived ΔR2* provides accurate estimation of gene copy number until we test this approach for more mRNA targets and find ways to reduce variables in both assays. Even so, the results we have already acquired demonstrate that our transcript tagging technique provides a noninvasive method for cell typing by MRI in vivo.
The evidence presented here supports the hypothesis of universal uptake of SPION-sODN, subsequent rapid exclusion or degradation of unbound contrast agent, and specific retention of the compatible SPION-gfap in neuroglia in vivo. Although a number of investigators have reported ex vivo labeling of neural progenitor cells for in vivo tracking (58–60), the mechanism of their retention is not clear, and some may have shown in vivo transfer to different cells (25). Since 2007, we have tested eight different targeting SPION-sODNs that demonstrate hybridization-mediated selective gene targeting and provide a window for MRI detection of gene activity. These SPION-sODNs report changes in mRNAs that are activated by either external or internal stimuli. However, of the sODNs we have tested to date, only sODN-gfap is cell specific. Broadly speaking, the mechanism of selectivity and sensitivity of most ex vivo hybridization methods based on the Watson-Crick base pairing mechanism, i.e., Northern blot, in situ hybridization, reverse transcription, and microarray methods, are well established. However, the selectivity and sensitivity of these assays come from the energy provided by applying heat above normal physiological temperatures in an ex vivo environment. Here, we present unique data showing that the selectivity in our transcript-tagging approach is based on the ability of viable cells to rapidly exclude free SPION-gfap and provide an optimal window for imaging of gene activity in vivo, at normal physiological temperatures. By providing sensitivity typically achievable only in studies of live nematodes, fruit flies, and zebrafish, MRI has the potential to advance the applicability of molecular biology assays from studies of invertebrate or cold-blooded vertebrate animals to warm-blooded animal models. In the event that more contrast agents are developed, we envision that GT tMRI can have applications for more targets simultaneously in vivo for genome or transcriptome mapping.
We have demonstrated that small DNA with a random sequence is excluded faster than DNA with a complementary sense sequence. Whereas the sense sODN may have little mRNA target in the cytoplasm, the target may be located on the transcribed strand of the gene in the nucleus. Therefore, differential exclusion and retention appear to be dependent on the presence of a complementary sequence in the cells, whether mRNA or genomic DNA. We have avoided using sense sequence sODN as controls for GT tMRI in order to reduce potential noise in the MR signal, i.e., noise-mimicking triplex formation that can generate off-target effects. Recently, short inhibitory RNA or micro-RNA has been used to achieve mRNA knockdown for therapeutic applications. In double-stranded formation, short RNA contains a passenger strand that may be homologous to the sense strand. This sense homologue may create the off-target effect that is frequently observed in gene-knockdown strategies using short inhibitory RNA approaches.
We also propose that certain enzymes in neural cells may act on SPION-sODN to drive its exclusion. For example, protease may cleave the NA that linked SPION to sODN, causing SPION to be released from sODN-gfap, and hence excluded from the cell. Others are nucleases for single-stranded nucleic acids. Both nontargeting SPION and sODN with a random sequence exhibit such rapid exclusion. We previously demonstrated that nontargeting SPION at a dose of <200 μg/kg is rapidly excluded from neural tissue (Supplemental Fig S3); this dose is ≥5 times higher than what we determined as the optimal dose for detection by MRI. Identification of enzymes that may influence the retention and exclusion of unbound probes will be central to extending molecular biological investigation to applications in living brains, and to designing mRNA targeting probes for glioma in future therapeutic application.
The data we have accumulated suggest that the sequence of sODN determines the tagging ability of GT tMRI and that SPION-gfap detects GFAP+ neural cells with sensitivity and selectivity similar to that provided by advanced molecular assays, such as ex vivo hybridization, RT-PCR, and TaqMan analysis. MRI is a noninvasive imaging modality that can be used to acquire multiple sets of data over time, and in combination with targeted therapy throughout a subject's life span. The i.c.v. delivery method that we use in our mouse studies is similar to the cortical and lumbar puncture methods used for clinical therapeutic applications, although not approved for diagnostic application, in humans. Given this similarity, we anticipate that our probe construct can be further developed as a carrier for therapeutic drugs for human clinical use (61). Our results support the hypothesis that chronic amphetamine exposure elicits cerebral damage in multiple ways, one of which is by reducing neuroglial populations in the mesolimbic pathway; the other is by activating neuroglia (gliogenesis) in the SVZ and SSC. This in vivo MR technique has potentially far-reaching implications for discovery and evaluation of new therapies, and for interventions that may target gene transcription markers of neurological diseases and disorders.
Supplementary Material
Acknowledgments
The authors thank Ms. N. Eusemann for help with editing.
This project was supported by grants from the American Heart Association (09Grant2060416) and the U.S. National Institutes of Health (NIH; AT004974 to J.Q.R.; DA026108, DA029889, and EB013768 to P.K.L.; and NS045776 to the Massachusetts General Hospital Neuroscience Center). The 9.4-T MR system used for this work was funded in part by an NIH Shared Instrumentation grant awarded to the Athinoula A. Martinos Center for Biomedical Imaging.
The authors appreciate the help of M. McKee with TEM, and the availability of the Microscopy Core (which is supported by NIH DK43351 and DK57521). Author contributions: C.H.L. contributed to MRI acquisition and data analysis and wrote the initial draft of the manuscript; J.Y. contributed to qRT-PCR and TaqMan analysis; J.Q.R. established brain slice cultures, delivered SPION-gfap, and contributed to histology and TEM; C.-M.L. synthesized and modified sODN and carried out PC-12.1 culture studies; Z.Y. contributed to immunohistology; P.K.L. coordinated and provided overall oversight for the project, designed and prepared SPION-sODN, carried out time-lapse microscopy, and supervised the various phases of revision of the manuscript.
This article includes supplemental data. Please visit http://www.fasebj.org to obtain this information.
- BBB
- blood-brain barrier
- CNR
- contrast-to-noise ratio
- CPu
- caudate-putamen
- Cy
- cyanine
- DG
- dentate gyrus
- EDN
- electron-dense nanoparticle
- FITC
- fluorescein isothiocyanate
- GFAP
- glial fibrillary acidic protein
- GT tMRI
- gene transcript targeted MRI
- HDAC5
- histone deacetylase-5
- hippo
- hippocampus
- i.c.v.
- intracerebroventricular
- MC
- motor cortex
- mPFC
- medial prefrontal cortex
- NA
- NeutrAvidin
- NAc
- nucleus accumbens
- ODN
- oligodeoxynucleotide
- PB
- phosphate buffer
- PC-12.1
- pheochromocytoma-12.1
- PFA
- paraformaldehyde
- pODN
- peptide-modified oligodeoxynucleotide
- Rhd
- rhodamine
- ROI
- region of interest
- sODN
- phosphorothioate-modified oligodeoxynucleodide
- SPION
- superparamagnetic iron oxide nanoparticle
- SSC
- somatosensory cortex
- SVZ
- subventricular zone
- TEM
- transmission electron microscopy
REFERENCES
- 1. Tanibuchi Y., Shimagami M., Fukami G., Sekine Y., Iyo M., Hashimoto K. (2010) A case of methamphetamine use disorder treated with the antibiotic drug minocycline. Gen. Hosp. Psych. 32, 559.e1–559.e3 [DOI] [PubMed] [Google Scholar]
- 2. Kita T., Miyazaki I., Asanuma M., Takeshima M., Wagner G. C. (2009) Dopamine-induced behavioral changes and oxidative stress in methamphetamine-induced neurotoxicity. Int. Rev. Neurobiol. 88, 43–64 [DOI] [PubMed] [Google Scholar]
- 3. Krasnova I. N., Ladenheim B., Cadet J. L. (2005) Amphetamine induces apoptosis of medium spiny striatal projection neurons via the mitochondria-dependent pathway. FASEB J. 19, 851–853 [DOI] [PubMed] [Google Scholar]
- 4. Ladenheim B., Krasnova I. N., Deng X., Oyler J. M., Polettini A., Moran T. H., Huestis M. A., Cadet J. L. (2000) Methamphetamine-induced neurotoxicity is attenuated in transgenic mice with a null mutation for interleukin-6. Mol. Pharmacol. 58, 1247–1256 [DOI] [PubMed] [Google Scholar]
- 5. Bowyer J. F., Ali S. (2006) High doses of methamphetamine that cause disruption of the blood-brain barrier in limbic regions produce extensive neuronal degeneration in mouse hippocampus. Synapse 60, 521–532 [DOI] [PubMed] [Google Scholar]
- 6. Armstrong V., Reichel C. M., Doti J. F., Crawford C. A., McDougall S. A. (2004) Repeated amphetamine treatment causes a persistent elevation of glial fibrillary acidic protein in the caudate-putamen. Eur. J. Pharmacol. 488, 111–115 [DOI] [PubMed] [Google Scholar]
- 7. Tocharus J., Khonthun C., Chongthammakun S., Govitrapong P. (2010) Melatonin attenuates methamphetamine-induced overexpression of pro-inflammatory cytokines in microglial cell lines. J. Pineal Res. 48, 347–352 [DOI] [PubMed] [Google Scholar]
- 8. Kitamura O., Takeichi T., Wang E. L., Tokunaga I., Ishigami A., Kubo S. (2010) Microglial and astrocytic changes in the striatum of methamphetamine abusers. Legal Med. 12, 57–62 [DOI] [PubMed] [Google Scholar]
- 9. Silver J., Edwards M. A., Levitt P. (1993) Immunocytochemical demonstration of early appearing astroglial structures that form boundaries and pathways along axon tracts in the fetal brain. J. Comp. Neurol. 328, 415–436 [DOI] [PubMed] [Google Scholar]
- 10. Chadi G., Maximino J. R., de Oliveira. G. P. (2009) The importance of molecular histology to study glial influence on neurodegenerative disorders. Focus on recent developed single cell laser microdissection. J. Mol. Histol. 40, 241–250 [DOI] [PubMed] [Google Scholar]
- 11. Messing A., Head M. W., Galles K., Galbreath E. J., Goldman J. E., Brenner M. (1998) Fatal encephalopathy with astrocyte inclusions in GFAP transgenic mice. Am. J. Pathol. 152, 391–398 [PMC free article] [PubMed] [Google Scholar]
- 12. Strauch R. C., Mastarone D. J., Sukerkar P. A., Song Y., Ipsaro J. J., Meade T. J. (2011) Reporter protein-targeted probes for magnetic resonance imaging. J. Am. Chem. Soc. 133, 16346–16349 [DOI] [PMC free article] [PubMed] [Google Scholar]
- 13. McGeer P.L., Itagaki S., Tago H., McGeer E. G. (1987) Reactive microglia in patients with senile dementia of the Alzheimer type are positive for the histocompatibility glycoprotein HLA-DR. Neurosci. Lett. 79, 195–200 [DOI] [PubMed] [Google Scholar]
- 14. Odawara T., Iseki E., Kosaka K., Akiyama H., Ikeda K., Yamamoto T. (1995) Investigation of tau-2 positive microglia-like cells in the subcortical nuclei of human neurodegenerative disorders. Neurosci. Lett. 192, 145–148 [DOI] [PubMed] [Google Scholar]
- 15. Pardridge W. M., Boado R. J., Kang Y. S. (1995) Vector-mediated delivery of a polyamide (“peptide”) nucleic acid analogue through the blood-brain barrier in vivo. Proc. Natl. Acad. Sci. U. S. A. 92, 5592–5596 [DOI] [PMC free article] [PubMed] [Google Scholar]
- 16. Gyurko R., Wielbo D., Phillips M. I. (1993) Antisense inhibition of AT1 receptor mRNA and angiotensinogen mRNA in the brain of spontaneously hypertensive rats reduces hypertension of neurogenic origin. Regul. Pept. 49, 167–174 [DOI] [PubMed] [Google Scholar]
- 17. Wahlestedt C., Golanov E., Yamamoto S., Yee F., Ericson H., Yoo H., Inturrisi C. E., Reis D. J. (1993) Antisense oligodeoxynucleotides to NMDA-R1 receptor channel protect cortical neurons from excitotoxicity and reduce focal ischaemic infarctions. Nature 363, 260–263 [DOI] [PubMed] [Google Scholar]
- 18. Scacheri P. C., Rozenblatt-Rosen O., Caplen N. J., Wolfsberg T. G., Umayam L., Lee J. C., Hughes C. M., Shanmugam K. S., Bhattacharjee A., Meyerson M., Collins F. S. (2004) Short interfering RNAs can induce unexpected and divergent changes in the levels of untargeted proteins in mammalian cells. Proc. Natl. Acad. Sci. U. S. A. 101, 1892–1897 [DOI] [PMC free article] [PubMed] [Google Scholar]
- 19. Winkler J., Stessl M., Amartey J., Noe C. R. (2010) Off-target effects related to the phosphorothioate modification of nucleic acids. Chem. Med. Chem. 5, 1344–1352 [DOI] [PubMed] [Google Scholar]
- 20. Liu P. K., Salminen A., He Y. Y., Jiang M. H., Xue J. J., Liu J. S., Hsu C. Y. (1994) Suppression of ischemia-induced fos expression and AP-1 activity by an antisense oligodeoxynucleotide to c-fos mRNA. Ann. Neurol. 36, 566–576 [DOI] [PMC free article] [PubMed] [Google Scholar]
- 21. Liu C. H., Kim Y. R., Ren J. Q., Eichler F., Rosen B. R., Liu P. K. (2007) Imaging cerebral gene transcripts in live animals. J. Neurosci. 27, 713–722 [DOI] [PMC free article] [PubMed] [Google Scholar]
- 22. Louie A. Y., Hüber M. M., Ahrens E. T., Rothbächer U., Moats R., Jacobs R. E., Fraser S. E., Meade T. J. (2000) In vivo visualization of gene expression using magnetic resonance imaging. Nat. Biotechnol. 18, 321–325 [DOI] [PubMed] [Google Scholar]
- 23. Ichikawa T., Högemann D., Saeki Y., Tyminski E., Terada K., Weissleder R., Chiocca E. A., Basilion J. P. (2002) MRI of transgene expression: correlation to therapeutic gene expression. Neoplasia 4, 523–530 [DOI] [PMC free article] [PubMed] [Google Scholar]
- 24. Shapiro E. M., Skrtic S., Sharer K., Hill J. M., Dunbar C. E., Koretsky A. P. (2004) MRI detection of single particles for cellular imaging. Proc. Natl. Acad. Sci. U. S. A. 101, 10901–10906 [DOI] [PMC free article] [PubMed] [Google Scholar]
- 25. Berman S. C., Galpoththawela C., Gilad A. A., Bulte J. W., Walczak P. (2011) Long-term MR cell tracking of neural stem cells grafted in immunocompetent versus immunodeficient mice reveals distinct differences in contrast between live and dead cells. Magn. Reson. Med. 65, 564–574 [DOI] [PMC free article] [PubMed] [Google Scholar]
- 26. Lewis S. A., Balcarek J. M., Krek V., Shelanski M., Cowan N. J. (1984) Sequence of a cDNA clone encoding mouse glial fibrillary acidic protein: structural conservation of intermediate filaments. Proc. Natl. Acad. Sci. U. S. A. 81, 2743–2746 [DOI] [PMC free article] [PubMed] [Google Scholar]
- 27. Liu P. K., Liu C. H. (2011) Gene targeting MRI: nucleic acid-based imaging and applications. Methods Mol. Biol. 711, 363–377 [DOI] [PubMed] [Google Scholar]
- 28. Tischler A. S., Greene L. A. (1975) Nerve growth factor-induced process formation by cultured rat pheochromocytoma cells. Nature 258, 341–342 [DOI] [PubMed] [Google Scholar]
- 29. Boxerman J. L., Hamberg L. M., Rosen B. R., Weisskoff R. M. (1995) MR contrast due to intravascular magnetic susceptibility perturbations. Magn. Reson. Med. 34, 555–566 [DOI] [PubMed] [Google Scholar]
- 30. Liu C. H., Ren J. Q., Yang J., Liu C. M., Mandeville J. B., Bhide P., Yanagawa Y., Rosen B. R., Liu P. K. (2009) DNA-based MRI probes for specific detection of chronic exposure to amphetamine in living brains. J. Neurosci. 29, 10663–10670 [DOI] [PMC free article] [PubMed] [Google Scholar]
- 31. Liu C. H., Huang S., Cui J., Kim Y. R., Farrar C. T., Moskowitz M. A., Rosen B. R., Liu P. K. (2007) MR contrast probes that trace gene transcripts for cerebral ischemia in live animals. FASEB J. 21, 3004–3015 [DOI] [PMC free article] [PubMed] [Google Scholar]
- 32. Paxinos G., Franklin K. B. J. (2001) The Mouse Brain in Stereotoxic Coordinates, Academic, London [Google Scholar]
- 33. Muldoon L. L., Nilaver G., Kroll R. A., Pagel M. A., Breakefield X. O., Chiocca E. A., Davidson B. L., Weissleder R., Neuwelt E. A. (1995) Comparison of intracerebral inoculation and osmotic blood-brain barrier disruption for delivery of adenovirus, herpesvirus, and iron oxide particles to normal rat brain. Am. J. Pathol. 147, 1840–1851 [PMC free article] [PubMed] [Google Scholar]
- 34. Fitzgerald M. L., Xavier R., Haley K. J., Welti R., Goss J. L., Brown C. E., Zhuang D. Z., Bell S. A., Lu N., McKee M., Seed B., Freeman M. W. (2007) ABCA3 inactivation in mice causes respiratory failure, loss of pulmonary surfactant, and depletion of lung phosphatidylglycerol. J. Lipid Res. 48, 621–632 [DOI] [PubMed] [Google Scholar]
- 35. Livak K. J., Schmittgen T. D. (2001) Analysis of relative gene expression data using real-time quantitative PCR and the 2(-Delta Delta C(T)) method. Methods 25, 402–408 [DOI] [PubMed] [Google Scholar]
- 36. Smith M.V., Miller C. R., Kohn M., Walker N. J., Portier C. J. (2007) Absolute estimation of initial concentrations of amplicon in a real-time RT-PCR process. BMC Bioinformatics 8, 409. [DOI] [PMC free article] [PubMed] [Google Scholar]
- 37. Liu C. H., Ren J. Q., You Z., Yang J., Liu C. M., Uppal R., Liu P. K. (2012) Noninvasive detection of neural progenitor cells in living brains by MRI. FASEB J. 26, 1652–1662 [DOI] [PMC free article] [PubMed] [Google Scholar]
- 38. Nestler E. J. (2001) Molecular neurobiology of addiction. Am. J. Addict. 10, 201–217 [DOI] [PubMed] [Google Scholar]
- 39. McCann U. D., Ridenour A., Shaham Y., Ricaurte G. A. (1994) Serotonin neurotoxicity after (+/−)3,4-methylenedioxymethamphetamine (MDMA; “ecstasy”): a controlled study in humans. Neuropsychopharmacology 10, 129–138 [DOI] [PubMed] [Google Scholar]
- 40. Frey B. N., Andreazza A. C., Ceresér K. M., Martins M. R., Petronilho F. C., de Souza D. F., Tramontina F., Gonçalves C. A., Quevedo J., Kapczinski F. (2006) Evidence of astrogliosis in rat hippocampus after d-amphetamine exposure. Prog. Neuropsychopharmacol. Biol. Psychiatry 30, 1231–1234 [DOI] [PubMed] [Google Scholar]
- 41. Mao L., Wang J. Q. (2001) Gliogenesis in the striatum of the adult rat: alteration in neural progenitor population after psychostimulant exposure. Brain Res. Dev. Brain Res. 130, 41–51 [DOI] [PubMed] [Google Scholar]
- 42. Beltinger C., Saragovi H. U., Smith R. M., LeSauteur L., Shah N., DeDionisio L., Christensen L., Raible A., Jarett L., Gewirtz A. M. (1995) Binding, uptake, and intracellular trafficking of phosphorothioate-modified oligodeoxynucleotides. J. Clin. Invest. 95, 1814–1823 [DOI] [PMC free article] [PubMed] [Google Scholar]
- 43. Ricaurte G., Bryan G., Strauss L., Seiden L., Schuster C. (1985) Hallucinogenic amphetamine selectively destroys brain serotonin nerve terminals. Science 229, 986–988, 1985 [DOI] [PubMed] [Google Scholar]
- 44. Malberg J. E., Seiden L. S. (1998) Small changes in ambient temperature cause large changes in 3,4-methylenedioxymethamphetamine (MDMA)-induced serotonin neurotoxicity and core body temperature in the rat. J. Neurosci. 18, 5086–5094 [DOI] [PMC free article] [PubMed] [Google Scholar]
- 45. Fornai F., Lenzi P., Frenzilli G., Gesi M., Ferrucci M., Lazzeri G., Biagioni F., Nigro M., Falleni A., Giusiani M., Pellegrini A., Blandini F., Ruggieri S., Paparelli A. (2004) DNA damage and ubiquitinated neuronal inclusions in the substantia nigra and striatum of mice following MDMA (ecstasy). Psychopharmacology 173, 353–363 [DOI] [PubMed] [Google Scholar]
- 46. Malaplate-Armand C., Ferrari L., Masson C., Visvikis-Siest S., Lambert H., Batt A. M. (2005) Down-regulation of astroglial CYP2C, glucocorticoid receptor and constitutive androstane receptor genes in response to cocaine in human U373 MG astrocytoma cells. Toxicol. Lett. 159, 203–211 [DOI] [PubMed] [Google Scholar]
- 47. Buttner A. (2011) The neuropathology of drug abuse. Neuropathol. Appl. Neurobiol. 37, 118–134 [DOI] [PubMed] [Google Scholar]
- 48. Peleg-Raibstein D., Knuesel I., Feldon J. (2008) Amphetamine sensitization in rats as an animal model of schizophrenia. Behav. Brain Res. 191, 190–201 [DOI] [PubMed] [Google Scholar]
- 49. Narita M., Suzuki M., Kuzumaki N., Miyatake M., Suzuki T. (2008) Implication of activated astrocytes in the development of drug dependence: differences between methamphetamine and morphine. Ann. N. Y. Acad. Sci. 1141, 96–104 [DOI] [PubMed] [Google Scholar]
- 50. Huang Y. N., Wu C. H., Lin T. C., Wang J. Y. (2009) Methamphetamine induces heme oxygenase-1 expression in cortical neurons and glia to prevent its toxicity. Toxicol. Appl. Pharmacol. 240, 315–326 [DOI] [PubMed] [Google Scholar]
- 51. Rolland B., Le Prince G., Fages C., Nunez J., Tardy M. (1990) GFAP turnover during astroglial proliferation and differentiation. Brain Res. Dev. Brain Res. 56, 144–149 [DOI] [PubMed] [Google Scholar]
- 52. Sharova L. V., Sharov A. A., Nedorezov T., Piao Y., Shaik N., Ko M. S. (2009) Database for mRNA half-life of 19,977 genes obtained by DNA microarray analysis of pluripotent and differentiating mouse embryonic stem cells. DNA Res. 16, 45–58 [DOI] [PMC free article] [PubMed] [Google Scholar]
- 53. Koffie R. M., Farrar C. T., Saidi L. J., William C. M., Hyman B. T., Spires-Jones T. L. (2011) Nanoparticles enhance brain delivery of blood-brain barrier-impermeable probes for in vivo optical and magnetic resonance imaging. Proc. Natl. Acad. Sci. U. S. A. 108, 18837–18842 [DOI] [PMC free article] [PubMed] [Google Scholar]
- 54. Liu C. H., You Z., Ren J., Kim Y. R., Eikermann-Haerter K., Liu P. K. (2008) Noninvasive delivery of gene targeting probes to live brains for transcription MRI. FASEB J. 22, 1193–1203 [DOI] [PMC free article] [PubMed] [Google Scholar]
- 55. Shi N., Boado R. J., Pardridge W. M. (2000) Antisense imaging of gene expression in the brain in vivo. Proc. Natl. Acad. Sci. U. S. A. 97, 14709–14714 [DOI] [PMC free article] [PubMed] [Google Scholar]
- 56. Shi N., Zhang Y., Zhu C., Boado R. J., Pardridge W. M. (2001) Brain-specific expression of an exogenous gene after i.v. administration. Proc. Natl. Acad. Sci. U. S. A. 98, 12754–12759 [DOI] [PMC free article] [PubMed] [Google Scholar]
- 57. Lee J. H., Durand R., Gradinaru V., Zhang F., Goshen I., Kim D. S., Fenno L. E., Ramakrishnan C., Deisseroth K. (2010) Global and local fMRI signals driven by neurons defined optogenetically by type and wiring. Nature 465, 788–792 [DOI] [PMC free article] [PubMed] [Google Scholar]
- 58. Shapiro E. M., Skrtic S., Koretsky A. P. (2005) Sizing it up: cellular MRI using micron-sized iron oxide particles. Magn. Reson. Med. 53, 329–338 [DOI] [PubMed] [Google Scholar]
- 59. Frank J. A., Miller B. R., Arbab A. S., Zywicke H. A., Jordan E. K., Lewis B. K., Bryant L. H., Jr, Bulte J. W. (2003) Clinically applicable labeling of mammalian and stem cells by combining superparamagnetic iron oxides and transfection agents. Radiology 228, 480–487 [DOI] [PubMed] [Google Scholar]
- 60. Bulte J. W., Douglas T., Witwer B., Zhang S. C., Strable E., Lewis B. K., Zywicke H., Miller B., van Gelderen P., Moskowitz B. M., Duncan I. D., Frank J. A. (2001) Magnetodendrimers allow endosomal magnetic labeling and in vivo tracking of stem cells. Nat. Biotechnol. 19, 1141-1147 [DOI] [PubMed] [Google Scholar]
- 61. Liu C. H., You Z., Liu C. M., Kim Y. R., Whalen M. J., Rosen B. R., Liu P. K. (2009) Diffusion-weighted magnetic resonance imaging reversal by gene knockdown of matrix metalloproteinase-9 activities in live animal brains. J. Neurosci. 29, 3508–3517 [DOI] [PMC free article] [PubMed] [Google Scholar]
Associated Data
This section collects any data citations, data availability statements, or supplementary materials included in this article.