

Abstract
This personal recollection looks at the evolution of ideas about the dynamics of the blood oxygenation level dependent (BOLD) signal, with an emphasis on the balloon model. From the first detection of the BOLD response it has been clear that the signal exhibits interesting dynamics, such as a pronounced and long-lasting post-stimulus undershoot. The BOLD response, reflecting a change in local deoxyhemoglobin, is a combination of a hemodynamic response, related to changes in blood flow and venous blood volume, and a metabolic response related to oxygen metabolism. Modeling is potentially a way to understand the complex path from changes in neural activity to the BOLD signal. In the early days of fMRI it was hoped that the hemodynamic/metabolic response could be modeled in a unitary way, with blood flow, oxygen metabolism, and venous blood volume—the physiological factors that affect local deoxyhemoglobin—all tightly linked. The balloon model was an attempt to do this, based on the physiological ideas of limited oxygen delivery at baseline and a slow recovery of venous blood volume after the stimulus (the balloon effect), and this simple model of the physiology worked well to simulate the BOLD response. However, subsequent experiments suggest a more complicated picture of the underlying physiology, with blood flow and oxygen metabolism driven in parallel, possibly by different aspects of neural activity. In addition, it is still not clear whether the post-stimulus undershoot is a hemodynamic or a metabolic phenomenon, although the original venous balloon effect is unlikely to be the full explanation, and a flow undershoot is likely to be important. Although our understanding of the physics of the BOLD response is now reasonably solid, our understanding of the underlying physiological relationships is still relatively poor, and this is the primary hurdle for future models of BOLD dynamics.
Keywords: functional magnetic resonance imaging (fMRI), cerebral blood flow (CBF), cerebral metabolic rate of oxygen consumption (CMRO2), blood oxygen level dependent (BOLD) effect, arterial spin labeling (ASL), dynamic models
1. Introduction
The following is a personal recollection of the development of dynamic models of the blood oxygenation level dependent (BOLD) response, as well as a personal perspective on where we stand today and what I think are the key questions. For this reason, it falls short as a thorough review of the field, and has a bias toward the balloon model that I hope my colleagues will forgive. Focusing on the balloon model makes it possible to trace how our thinking has changed over the years, illustrating the growth in complexity of the models as new data became available. My goal is to focus more on the evolution of ideas about dynamic models, emphasizing the physical reasoning underlying the models rather than the mathematics itself. For that reason, the use of mathematical symbols is primarily just a shorthand for describing a physical model that links different variables in a deterministic way (e.g., v(f) simply means that blood volume v is determined by blood flow f).
2. Early ideas for modeling the dynamics of the BOLD response
2.1 The hemodynamic response
The need for dynamic models to understand the BOLD effect was evident even in the earliest reports of measurements of brain activation with functional magnetic resonance imaging (fMRI). The dynamic signal time course reported by Kwong and colleagues in their seminal 1992 paper (Kwong et al., 1992) shows the now familiar signal increase in visual cortex during stimulation, but also shows a significant lowering of the baseline after the first stimulus. In later studies using longer ‘off’ periods it became clear that this lowering is due to a transient but prolonged undershoot of the BOLD signal after the end of the stimulus. The presence of this post-stimulus undershoot suggests some kind of interesting dynamics is going on, although remarkably there is still no consensus on the source of the phenomenon even after 20 years of research (more on this below). In addition, studies using intrinsic optical imaging had found evidence for a small rise in deoxyhemoglobin at the onset of a stimulus (Frostig et al., 1990;Grinvald et al., 1991), and this effect was soon detected as an initial dip at the beginning of the BOLD response, first with a spectroscopy technique (Hennig et al., 1994) and then with imaging (Menon et al., 1995). The post-stimulus undershoot and the initial dip suggested that the dynamics of BOLD contrast are interestingly complex.
The BOLD effect was understood as a combination of two phenomena. The biophysical basis is that deoxyhemoglobin is paramagnetic and alters the susceptibility of the blood. This creates magnetic field gradients around the vessels that reduce the MR signal relative to what it would be in the absence of deoxyhemoglobin. The physiological basis is that cerebral blood flow (CBF) increases by a larger fraction than the cerebral metabolic rate of oxygen (CMRO2) when neural activity increases. In their seminal paper, Fox and Raichle (Fox and Raichle, 1986) described this phenomenon as ‘uncoupling’ of CBF and CMRO2 and subsequent studies indicate that this effect is a ubiquitous feature of brain physiology. In terms of the BOLD response, the key effect is that the oxygen extraction fraction (E) decreases with activation because the CBF change is larger than the CMRO2 change, decreasing local deoxyhemoglobin and thus slightly increasing the MR signal. This basic picture, though, highlights the complexity of the BOLD effect. Even if we simplify the physics and treat the BOLD signal just as a reflection of a change in total deoxyhemoglobin, that change depends on the exact balance of the changes in CBF and CMRO2 and also on the change in cerebral blood volume (CBV) of blood compartments that contain deoxyhemoglobin. In fact, the measured BOLD response also depends on volume exchange effects that are not directly related to blood oxygenation changes (e.g., arterial CBV changes that displace extravascular tissue), and these effects grow with field strength (Uludag et al., 2009).
In the early days the BOLD signal time course often was considered to be the ‘neural activity’ filtered through the ‘hemodynamic response’ (Figure 1A). Exactly what was meant by neural activity was somewhat vague, and I think it was often assumed to be local spiking activity. Much of the complexity of current modeling is due to the growing sophistication of experimental techniques that make it possible to break open these simple boxes. For example, we would now consider excitatory synaptic activity, inhibitory synaptic activity, neuromodulation, ion fluxes, etc. as important components of ‘neural activity’ in addition to local generation of action potentials, and all of these components could potentially stimulate CBF and CMRO2 responses (Logothetis et al., 2001; Lauritzen, 2005; Logothetis, 2008). Similarly, in the early days the hemodynamic response essentially was regarded as a unitary thing, a deterministic function of CBF, although it was recognized that the change in local deoxyhemoglobin depends on combined changes in CBF, CBV and CMRO2. The initial goal of modeling then was to try to formulate how the black box of the hemodynamic response might work. Given that the primary effect of the hemodynamic response is a large CBF change, a simple starting point was to ask how CMRO2 and CBV (really venous CBV, because that’s where most of the deoxyhemoglobin is) vary when a change in CBF is the input. Initially it seemed that the relationship between CBV and CBF was relatively straightforward. Grubb and colleagues had measured a steady-state relationship between CBF and total CBV in monkeys which they characterized as a power law of the form v(f)=fα, where v and f are the CBV and CBF normalized to their baseline values and α=0.38 from fitting their data (Grubb et al., 1974). This relationship appears in some form in nearly all models of the BOLD response, usually with the assumption that the fractional venous CBV change is the same as the fractional total CBV change described by the Grubb model.
Figure 1.

A) Schematic view of the BOLD response as a ‘neural response’ filtered through a ‘hemodynamic response’. B) The balloon model was an attempt to describe the hemodynamic response as a deterministic function of the dynamic CBF change with three components: 1) a model for slow recovery of venous CBV after the stimulus (the balloon effect); 2) a model for the oxygen extraction fraction E based on limited oxygen delivery in the baseline state; and 3) a model for the conversion of dynamic changes in total deoxyhemoglobin and venous CBV into the BOLD response.
The harder question was how to relate CMRO2 to CBF, the primary source of the BOLD effect. If CBF and CMRO2 are truly uncoupled, in the sense that they can vary independently and unpredictably, then there was little hope of developing a useful model of the BOLD response because the underlying physiology is too variable. Specifically, this uncertainty stood in the way of modeling the black box of the hemodynamic response as a unitary entity. To understand how local deoxyhemoglobin changes with activation, in addition to knowing v(f), we also needed a function relating the oxygen extraction fraction to blood flow, E(f). Armed with these two relationships, we could then model the ‘hemodynamic response’ by considering the CBV and CMRO2 changes to be directly predictable from the CBF change.
2.2 The metabolic response
My initial interest in modeling the BOLD response was focused on trying to understand the basic origin of the BOLD response. Why does CBF increase so much more than CMRO2 with activation? Specifically, is there a physiological basis for how much the oxygen extraction fraction changes with activation that could be the basis for a deterministic function E(f)? This was not really a question about the specific mechanisms involved in neurovascular coupling, but rather about the physiological function served by this mismatch of CBF and CMRO2 changes. Why has evolution preserved such a seemingly wasteful function?
Before I began working in the MRI field I had worked with positron emission tomography (PET) methods for measuring CBF and CMRO2, and an idea from that literature suggested why CBF might need to increase so much. A key assumption underlying the models used to derive CMRO2 measurements from PET data is that all of the O2 that leaves the capillary and enters the tissue space is metabolized. If there is no back flux of O2 from the tissue, then the tissue O2 concentration must be near zero. Larry Frank and I proposed that this phenomenon, combined with the experimental observation that capillary recruitment does not occur in the brain (Gobel et al., 1989; Gobel et al., 1990), could produce a functional requirement for a large CBF change to support a small CMRO2 change (Buxton and Frank, 1997). The basic idea is that in order to increase CMRO2, the gradient of O2 from capillary to tissue must increase. If the tissue O2 concentration is near zero, and capillary recruitment is not possible to shorten the distance between capillaries, then the only way to increase the O2 gradient is to raise capillary O2 concentration. This in turn requires a reduction of the oxygen extraction fraction. By this oxygen limitation model a reduction in E—the origin of the BOLD effect—is required to support the small change in CMRO2 associated with activation in the face of limited O2 delivery at rest. Note that this does not mean that the increased CBF causes the increased CMRO2 (increased CBF with constant CMRO2 would simply raise both capillary and tissue pO2 values). It’s rather that increased CMRO2 requires capillary pO2 to increase in order to increase the O2 flux to tissue, and this requires a large increase of CBF. We developed a mathematical model along these lines that provides a nonlinear function E(f), and it predicted a ratio of CBF and CMRO2 changes similar to the experimental results of Fox and Raichle.
Although the oxygen limitation model was an attempt to understand the relationship between dynamic changes in CBF and CMRO2, it was not really a dynamic model in the sense of predicting the time course of the BOLD signal. Instead, it was an attempt to model a fixed physiological relationship between the CBF and CMRO2 changes, so that these physiological variables are not independent. However, the form of E(f) provided by the oxygen limitation model is based on the restrictive assumption that tissue O2 concentration is essentially zero, and this model predicted that CMRO2 cannot increase without an increase of CBF. At the time, the biggest challenge to this idea in the context of the BOLD response was the post-stimulus undershoot. The leading interpretation at the time for both the post-stimulus undershoot and the initial dip was a mismatch of the dynamics of CBF and CMRO2: CMRO2 begins earlier than CBF, creating the initial dip, but then recovers to baseline more slowly than CBF after the end of the stimulus (Turner et al., 1993; Frahm et al., 1996; Kruger et al., 1996). To accommodate this CBF/CMRO2 uncoupling within the oxygen limitation model, the assumption of zero O2 concentration in tissue would have to be relaxed so that tissue pO2 could drop in order to increase the O2 gradient from blood to tissue, and that would mean that we no longer have a basis for a fixed relationship E(f).
2.3 The Balloon Model
For me there was a clear moment when I realized that it could be possible to model the hemodynamic response, including the post-stimulus undershoot, in a unitary way with consistent relationships v(f) and E(f). At the 1996 ISMRM meeting Joe Mandeville presented his experimental work in a rat model comparing the dynamics of BOLD, CBF and CBV responses to stimulation (Mandeville et al., 1996; Mandeville et al., 1998). The key point he made was that the familiar Grubb relationship between CBV and CBF held during the positive part of the BOLD response but not during the undershoot period. Specifically, he found a slow recovery of CBV that matched the duration of the BOLD post-stimulus undershoot, raising the possibility that the undershoot could be simply a biomechanical effect rather than a metabolic effect. For me this was a key observation, because if the post-stimulus undershoot could be explained as a slow recovery of venous CBV, then it could still be true that CBF and CMRO2 remain tightly coupled in a predictable way. With that idea planted, Eric Wong, Larry Frank and I began to develop a biomechanical dynamic model for the BOLD response with different time constants for CBF and venous CBV recovery. In parallel, Mandeville and colleagues also developed a dynamic model along similar lines, and our balloon model (Buxton et al., 1998) and their delayed compliance model (Mandeville et al., 1999) are built on similar concepts.
The balloon model is based on three components (Figure 1B): 1) A model for the BOLD effect in terms of changes in the normalized total deoxyhemoglobin (q) and the normalized venous CBV (v) that included both intra- and extra-vascular signal changes as well as volume exchange effects as blood vessels dilated and displaced extravascular spins; 2) a form of E(f) based on the oxygen limitation model; and 3) a model for v(f) that included slow recovery of venous CBV after the stimulus, analogous to the expansion and then slow contraction of a balloon. The inflow f(t) served as the driving function of the model, with differential equations for the dynamics of q and v based on mass balance. The basic physical picture is that the venous CBV inflates during activation and then slowly deflates during the undershoot. At first glance this sounds backwards, because it’s dilation of the vessels that changes the resistance and alters the CBF. However, most of the resistance is on the arterial side, so this model is essentially describing a scenario where the arterioles dilate and constrict to modulate CBF, and the venous component follows passively with a delay. In fact, in Mandeville’s original study he had found evidence for a smaller fast rising component of CBV, consistent with the arterial component. However, our treatment of v(f) was really just a descriptive mathematical form illustrating the physical idea of the venous balloon, rather than a form based on an underlying biophysical model. Mandeville and colleagues went further in adapting a windkessel model in the context of delayed compliance (Mandeville et al., 1999) to provide a better physical foundation. (Windkessel refers to a classic model of high pressure flow into compliant vessels, taken from the German word for an air chamber used to create pressure for 19th century fire engines).
3. Evolving ideas about dynamic models
3.1 The neural driver of CBF
Mathematically, the balloon model could serve as a complete description of the BOLD response, in the sense that specifying the CBF change f(t) was enough to calculate a dynamic BOLD response curve. Friston and colleagues took the next step of trying to relate the CBF response to changes in the underlying neural activity (Friston et al., 2000). They assumed that the change in neural activity creates a signal s(t) that drives f(t) in a linear way, with the CBF responding like a damped harmonic oscillator. Specifically, this form implies that the CBF can exhibit a post-stimulus undershoot as it rings down after a simple stimulus, and also exhibits a natural resonance. Interestingly, a good fit to their data implied a resonant frequency of about 10s, consistent with observations of vasomotion, the intrinsic flow fluctuations that are observed with a number of techniques. In this study the focus, though, was on a different question: does the balloon model produce the same types of nonlinearity that have been observed in the BOLD signal? Nonlinear features appear when the response to two closely spaced stimuli is compared with a simple sum of the individual responses to one stimulus alone, or when the responses to short and long stimuli are compared (Miller et al., 2001). Friston and colleagues showed that a linear step from neural activity to CBF, plus the balloon model as the step from CBF to BOLD response, produced nonlinearities similar to what had been observed experimentally. However, it should be noted that the BOLD post-stimulus undershoots in the Friston model are not due to mismatch of CBV and CBF changes, as in the original balloon model, but rather to the assumed harmonic oscillator behavior of CBF.
The extension by Friston and colleagues to a linear driver between neural activity and CBF was essentially a mathematical construction embodying a linear relationship, rather than based on particular physiological mechanisms related to neurovascular coupling. Nevertheless, this combination of a linear CBF response with the balloon model provided a complete pathway for simulating BOLD responses that look plausible and exhibit nonlinear aspects that agree with experimental measurements. Because of this, it became useful as a way to simulate the fMRI experiment for developing experimental designs or for analyzing data where a hemodynamic response function was needed.
3.2 The temporal scale of the BOLD response
Behzadi and Liu (Behzadi and Liu, 2005) used the Friston model to address a surprising effect related to the dynamics of the BOLD response. In the original balloon model the temporal scale of the BOLD response is defined by a time constant that varies inversely with baseline CBF, so that if baseline CBF is increased and everything else remains the same we would expect the BOLD response to evolve more quickly. In fact, though, the opposite happens. With inhalation of CO2 baseline CBF increases, but the BOLD response slows down (Cohen et al., 2002). With caffeine baseline CBF decreases, yet the BOLD response evolves more quickly (Liu et al., 2004). Behzadi and Liu considered how a neural driver s(t) acting on the smooth muscle of the arterioles would lead to a change in flow. The key innovation was to consider the compliance of the vessel as having two components: an active component due to smooth muscle, and a passive component due to elastic elements that stretch when the vessel expands. When the vessel is constricted the compliance is dominated by the smooth muscle, but when expanded the elastic elements make an important contribution. Because the neural driver only affects the smooth muscle, it is more effective at modulating flow when the vessel is constricted in the baseline state. Behzadi and Liu showed that this effect would speed up the BOLD response when baseline CBF is low and slow it down when CBF is high.
3.3 Growing sophistication of the models
Since the early days of fMRI the growth of detailed models of the physiology underlying the BOLD response has been impressive. I cannot do justice to them in this short perspective, and the following is really just a sampler. A number of investigators have built on and substantially modified the original balloon model (Feng et al., 2001; Toronov et al., 2003; Blockley et al., 2009). In particular, Zheng, Mayhew and colleagues have developed more sophisticated ways of modeling the biophysics of venous expansion and contraction to improve the treatment of v(f) (Kong et al., 2004; Zheng and Mayhew, 2009). In addition, other authors have relaxed the assumption of E(f) based on the oxygen limitation model, and developed significantly more complex models of the underlying energy metabolism and of oxygen transport. In particular, Aubert and colleagues have developed sophisticated models of the different elements of energy metabolism (Aubert and Costalat, 2002; Aubert et al., 2007) and combined these with the balloon model at the output stage to model the dynamics of the BOLD response. The BOLD signal model itself also has been modified and corrected (Buxton et al., 2004; Obata et al., 2004), and work on developing a more detailed model of how various physiological factors affect the BOLD signal continues (Uludag et al., 2009; Griffeth and Buxton, 2011). Much more has been learned about the various mechanisms that link different aspects of neural activity to CBF, including the role of various neuronal and astrocytic drivers. This has prompted more sophisticated models of neurovascular coupling (Riera et al., 2006; Riera et al., 2007; Zheng et al., 2010).
This growth of complexity of the modeling is important because the physiology really is rather complicated, but it also brings up an interesting question: why do we make models? I think initially the goal is to find the simplest model that captures what is known from experiments and tests whether simple physiological hypotheses are sufficient to account for the observed data. If a simple model is possible, it can be useful as a framework for modeling both the experiment and the data. As a model expands to include more parameters to describe the original effects, or new effects that were not originally included, it becomes a more complete tool for simulating different physiological possibilities. However, a very detailed model may become less useful for modeling data because so much that is included in the model is not well understood.
For example, Davis and colleagues (Davis et al., 1998) proposed a very simple model of the BOLD response in the context of the calibrated BOLD experiment, and the calibrated BOLD approach now offers one of the best tools we have for assessing CMRO2 changes (Hoge et al., 1999; Stefanovic et al., 2004; Chiarelli et al., 2007; Ances et al., 2008; Griffeth et al., 2011; Mark et al., 2011). The Davis model is used as a theoretical framework for analyzing CBF and BOLD responses to a stimulus, together with responses to hypercapnia, to estimate the CMRO2 change associated with the stimulus. This is an excellent example of how a theoretical framework based on an appropriate model can make it possible to integrate different measurements and make estimates of physiological variables that one could not get with either measurement alone. However, the Davis model left out a number of effects that we think are important in determining the BOLD response. Recently Valerie Griffeth and I developed a much more detailed model that includes all of the physiological variables we could think of that might affect the BOLD response (Griffeth and Buxton, 2011), and the model was applied to help understand the complicated effects of caffeine on CBF and CMRO2 (Griffeth et al., 2011). This detailed model does not work as a direct substitute for the Davis model in the calibrated BOLD experiment, though, because for a particular experiment we do not know the right values to put in for all of the physiological parameters. Nevertheless the detailed model provides a way to simulate the BOLD response under a wide range of physiological conditions, and then use this simulated data to test the accuracy of the Davis model in the presence of this unknown underlying physiological variability. Somewhat surprisingly, we found that the Davis model works reasonably well for the calibrated BOLD experiment despite the fact that the original derivation of the model left out a number of important effects. Interestingly, it was not that these effects were unimportant, but rather that the mathematical form of the Davis model was sufficient to capture the overall variation, although this meant that the model parameters cannot be interpreted physically in the way they were originally introduced.
In short, it is useful to think about modeling as having two distinct goals: 1) simulating the underlying physiology and physical processes as accurately as we can; and 2) modeling experimental data. In principle the same model can work for both with a Bayesian framework that provides a way to deal with the uncertainties in all of the parameters of the detailed simulation model (Friston, 2002). In my experience, though, we usually have detailed models for simulations and simpler models for analyzing data, and a good use of the detailed models is to test the accuracy of the simpler models. The original balloon model was an attempt at minimalism in modeling, to show that simple ideas relating physiological parameters—the balloon effect and limited oxygen delivery—were sufficient to explain the basic features observed in the BOLD response. It worked reasonably well at producing plausible BOLD responses, and for this reason it found a niche, and its simplicity was an asset. However, the ability of the balloon model to simulate realistic looking BOLD responses does not mean that the underlying ideas about the physiology are right, and it is important to consider the original model in the light of current experimental data.
4. Current ideas related to the physiological basis of BOLD contrast
4.1 Are CBF and CMRO2 tightly coupled?
The basic assumption of the oxygen limitation model is that tissue oxygen tension (pO2) is near zero. However, a number of recent studies using oxygen electrodes in animal models show that brain tissue pO2 is relatively high, about 25 mmHg (Ances et al., 2001; Thompson et al., 2003; 2005). For reference, mean capillary pO2 is about 45 mmHg and the tissue pO2 at which oxygen concentration limits the kinetics of CMRO2 is less than 1 mm Hg (Gnaiger et al., 1998). This suggests that CMRO2 is not fundamentally limited by delivery of O2, and that CMRO2 could increase substantially by simply allowing tissue pO2 to drop, with no need for an increase in CBF. Interestingly, though, it appears that with normal brain function the tissue pO2 is basically maintained, and the O2 gradient from blood to tissue is increased by decreasing the oxygen extraction fraction. In fact this scenario is equivalent to a generalization of the original oxygen limitation model. Instead of a tissue pO2 that cannot be reduced because it’s zero, the new scenario looks like a non-zero pO2 that is prevented from falling. A more general model for O2 transport that includes tissue pO2 suggests that this requires the CBF change to be 2-3 times larger than the CMRO2 change (Buxton, 2010). This is smaller than the ratio found by Fox and Raichle, but a number of experimental studies with both calibrated BOLD and PET have found coupling ratios in this approximate range, although there is a wide variation in the experimental literature (see (Buxton, 2010) for a review). In a recent study employing spatially resolved pO2 measurements, the increased CBF with activation preserved the lower pO2 values at a constant level, while tissue pO2 in areas with higher baseline pO2 increased, supporting the idea that the functional significance of the large CBF increase is to prevent pO2 from dropping to dangerously low levels in those areas where it is already low (Devor et al., 2011).
The picture above suggests that the evolutionary advantage of the large CBF change may well be to prevent a drop in tissue pO2, but there is not a strict requirement for CBF and CMRO2 to be tightly coupled. Much of the work in my group over the last few years has focused on understanding how different physiological conditions can alter the coupling of CBF and CMRO2 changes. We found evidence for a larger coupling ratio in visual cortex compared with deeper structures (Ances et al., 2008), although a later study suggests this difference may be due in part to the strength of the stimulus (Liang and Buxton, 2009), with the coupling ratio increasing in visual cortex as the stimulus contrast increases. We also found that the coupling ratio was smaller when a visual stimulus was attended compared to unattended (i.e., with attention the CMRO2 response to the stimulus increased substantially) (Moradi et al., 2011). In addition, we found that caffeine strongly affects both baseline CBF and CMRO2 and their responses to a visual stimulus, with a substantially larger CMRO2 response to a visual stimulus after caffeine was administered (Perthen et al., 2008;Griffeth et al., 2011).
At first glance, the differences in the coupling ratios of CBF and CMRO2 changes that are observed do not seem to be very large. For example, in the study comparing visual cortex with deeper structures (Ances et al., 2008), the difference in that ratio was only ~1.6 compared to ~2.2. From a general physiological perspective that difference suggests a consistent pattern of combined CBF and CMRO2 changes. In terms of modeling the BOLD response, though, that difference has a significant impact. In this study the ratio of BOLD signal changes between the two areas was ~7, but the CMRO2 ratio was only ~2. In short, variability of the ratio of CBF and CMRO2 changes is an important confounding factor for modeling the BOLD response because these two physiological changes drive the BOLD response in opposite directions. This basic counteracting influence of CBF and CMRO2 changes was nicely demonstrated in two animal studies in which the CBF response was suppressed (Nagaoka et al., 2006;Zappe et al., 2008). The BOLD response flipped sign to become negative due to the CMRO2 change, with similar dynamics to the positive BOLD response when the CBF response was not suppressed.
A number of studies suggest reasons why the relative magnitudes of the CBF and CMRO2 changes may not be tightly coupled. The CMRO2 change may simply reflect the energy costs of the overall evoked activity, with CMRO2 increasing as needed to restore ion gradients, recycle neurotransmitter, etc, in the recovery from neuronal signaling (see (Attwell and Laughlin, 2001) for an estimated energy budget of neural signaling). However, the simple picture of energy metabolism demands driving the increase in CBF appears to be wrong. Instead, the CBF response appears to be driven in a feed-forward way by aspects of neuronal signaling (Uludag et al., 2004), with the astrocytes thought to play a primary role as the intermediaries between neural activity and blood flow, in addition to the effects of neuronal signaling molecules on the vessels, including nitric oxide (Attwell and Iadecola, 2002;Hamel, 2006;Iadecola and Nedergaard, 2007;Koehler et al., 2009). Overall, the BOLD response is thought to reflect neural mass activity through this complex set of mechanisms (Logothetis, 2008). However, the basic picture of CBF and CMRO2 being driven in parallel suggests the possibility that the aspects of neural activity that strongly modulate CBF may not be the same aspects that drive CMRO2, and that as different aspects of inhibition or neuromodulation come into play the CBF/CMRO2 coupling ratio may change (Buxton, 2010;Griffeth et al., 2011;Moradi et al., 2011).
In short, the original hope that we can model the ‘hemodynamic response’ in a simple unitary way as in the balloon model, with CBF and CMRO2 responses tightly coupled, is not possible. Instead, a better approach now is to think of a ‘hemodynamic response’ and a ‘metabolic response’ as two independent features driven in parallel, but possibly driven by different aspects of neural activity. Unfortunately, this makes it difficult to interpret the BOLD response in a quantitatively meaningful way without additional measurements, such as CBF measured with arterial spin labeling (ASL). Because the observed variability of CBF/CMRO2 coupling strongly modulates the magnitude of the BOLD response, observed differences in the BOLD response between healthy and disease populations do not necessarily mean that the underlying neural responses were different.
4.2 Is the initial dip due to a fast rise in CMRO2?
The initial dip has had a checkered history, because it is not always seen (Buxton, 2001). In addition, the early optical studies were somewhat ambiguous, in that they showed an increase of deoxyhemoglobin but no apparent decrease of the oxyhemoglobin signal. For a pure increase in CMRO2 with no change in CBF we would expect an exchange of oxyhemoglobin with deoxyhemoglobin, so the experimental results suggested that there was also an element of a CBV change. In support of an early CMRO2 change, a study in humans showed that the BOLD initial dip is reduced after administration of caffeine, which speeds up the CBF response (Behzadi and Liu, 2006). The fact that the speed of onset of the CBF response depends on the baseline physiological state suggests a possible source of the variability of the initial dip in different studies. In the original balloon model paper we argued that the timing of venous CBV changes also could produce an initial dip. More recently Uludag and colleagues (Uludag et al., 2009) showed that due to volume exchange effects even arterial CBV changes could lead to an initial dip, an effect that would increase with magnetic field strength, consistent with experimental results. Further experiments with optical methods in animal models, however, have found mixed results, including evidence for deoxyhemoglobin changes prior to CBV changes (Devor et al., 2003) and for CBV changes as the earliest effect (Sirotin et al., 2009), and the issue is still controversial (Uludag, 2010;Chen et al., 2011). In short, the physiological origin of the initial dip remains an open question.
4.3 What is happening during the BOLD post-stimulus undershoot?
The idea of a slow return of venous CBV was a key part of the balloon model designed to explain the BOLD post-stimulus undershoot in a way that was consistent with the MION studies of CBV recovery. Despite a large number of subsequent studies, there is still no agreement in the field about the physiological origin of the undershoot. Broadly speaking, there are several possibilities: 1) an undershoot of neural activity, with CBF and CMRO2 following along; 2) a slow recovery of CMRO2 after CBF and CBV have returned to baseline; 3) a slow recovery of venous CBV after CBF and CMRO2 have returned to baseline, as in the balloon model; and 4) a transient undershoot of CBF after CMRO2 has returned to baseline. In principle, elements of each could be involved. Another way to look at this is that there are two ways in which the total deoxyhemoglobin could be increased during the BOLD undershoot: a reduced hemoglobin saturation of venous blood, or an increased volume of venous or capillary blood. The balloon model assumes that it is purely an increase in CBV, and that venous oxygenation is back to baseline. The other possibilities all involve reduced venous oxygen saturation during the undershoot.
The idea of a slow CBV recovery was prompted by Mandeville’s original MION studies in animal models (Mandeville et al., 1998), and subsequent MION studies have confirmed the slow CBV recovery but also added interesting refinements to the picture with improved spatial resolution. Two studies (Yacoub et al., 2006;Zhao et al., 2007), found BOLD undershoots and slow recovery of the MION CBV signal in the deeper layers of cortex, but importantly a BOLD undershoot without a slow recovery of CBV in the surface layers. This indicates that the blood oxygenation in the surface layers is reduced during the undershoot, because it cannot be explained by elevated CBV. Note that the surface layer signal could be due to draining venous blood from the lower layers, but a pure CBV effect in the lower layers would not alter venous oxygenation. These data suggest that venous CBV changes cannot fully explain the undershoot, and there must be reduced blood oxygenation during the undershoot. This could come about either from a sustained elevation of CMRO2 or an undershoot of CBF. In addition, a study using two-photon microscopy to directly measure changes in vessel diameter did not find much change in venous vessels during the short stimulus, so there was no possibility for a balloon effect (Hillman et al., 2007). Recently, though, two new studies, one with two photon microscopy (Drew et al., 2011) and one using MRI methods (Kim and Kim, 2011), added another interesting refinement to the idea of slow venous recovery. In these studies the venous CBV change was slow to develop and slow to recover, so the CBV effect was only seen with a long stimulus duration. In contrast to these results in animal models, though, a number of studies in humans failed to find evidence of a slow recovery of CBV using injected contrast agents (Frahm et al., 2008;Dechent et al., 2011), the VASO technique (Lu et al., 2004;Tuunanen et al., 2006) or near infrared spectroscopy (NIRS) (Schroeter et al., 2006), although a study with another method (VERVE) did find evidence for a slow CBV recovery (Chen and Pike, 2009). A recent study found that gradient echo and spin echo BOLD responses had nearly identical dynamic shapes, in contradiction to the prediction that extravascular signal loss around veins with elevated CBV should be partly refocused in the spin echo (Poser et al., 2011), although one needs to be careful about the interpretation of spin-echo BOLD signals (Uludag et al., 2009). At this point it is not clear how the results of these different methods can be reconciled, but there is a clear need to closely examine systematic differences. For example, the VERVE method is sensitive to deoxygenated blood, while the contrast agents, and probably the VASO technique as well, are sensitive to total blood volume. Nevertheless, taken together these studies suggest that the original balloon idea is at most only a part of the explanation of the BOLD post-stimulus undershoot, and that reduction of venous oxygenation also plays a role.
Slow CMRO2 recovery would reduce venous oxygen saturation, and would be an interesting physiological result. A number of studies noted above have concluded that this is the origin of the post-stimulus undershoot based on the lack of evidence for a slow CBV recovery or a CBF undershoot. In addition, two recent studies used a breath-hold stimulus paradigm, with the idea that there should be no change in CMRO2 and thus no slow recovery of CMRO2 to drive the BOLD undershoot (Donahue et al., 2009;Hua et al., 2011). Indeed they found very large CBF and BOLD responses without a BOLD undershoot, supporting the picture of a slow CMRO2 recovery following neuronal stimuli. However, another recent study in rats found that increasing intracranial pressure reduces the BOLD undershoot (Fuchtemeier et al., 2010), suggesting a biomechanical rather than a metabolic origin.
An alternative possibility to slow CMRO2 recovery as a source of decreased venous oxygenation during the undershoot is a CBF undershoot, and this possibility deserves more attention. Chen and Pike found a significant CBF undershoot along with a slow recovery of CBV in humans (Chen and Pike, 2009). The study of Kim and Kim in an animal model found a reduction of arterial CBV while venous CBV was elevated (Kim and Kim, 2011). Other studies with optical methods also support an undershoot of arteriolar volume after the stimulus (Devor et al., 2007;Chen et al., 2011). These studies suggest the intriguing possibility of an opposite pattern of arterial and venous CBV changes during the undershoot, which could make the interpretation of overall CBV change more complicated. The idea of a CBF undershoot associated with the arteriolar constriction also is interesting because the BOLD signal modeling suggests that a weak CBF undershoot can have a surprisingly large effect on the BOLD undershoot, particularly if there is not a corresponding undershoot of CMRO2. In a recent study (Griffeth et al., 2011) measuring both CBF and BOLD responses to a visual stimulus we calculated the CMRO2 response that would be required to explain the BOLD response if CBV closely follows CBF by applying the standard BOLD signal model at each time point (Figure 2). Although the CBF undershoot was weak, it was sufficient to explain the BOLD undershoot without a prolonged CMRO2 recovery.
Figure 2.
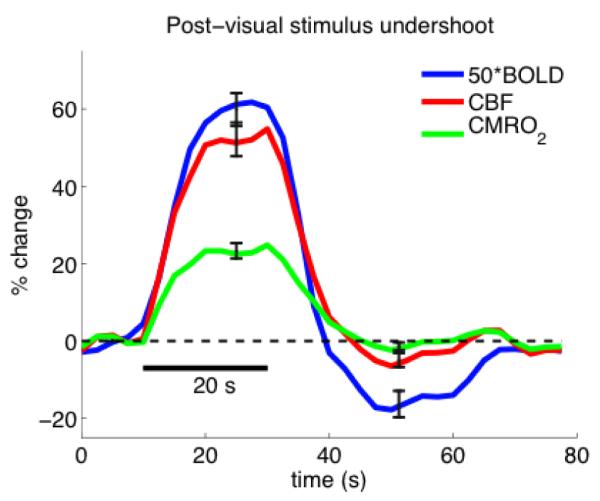
/B> Measured CBF (red) and BOLD (blue, x50 for display) responses to a visual stimulus redrawn from the calibrated BOLD study reported in (Griffeth et al., 2011). For each subject, the CMRO2 response curve was estimated by analyzing the measured responses at each time point by applying the BOLD signal model with the calibration factor determined from the hypercapnia experiment. All curves are the average of 9 subjects. These data illustrate that the BOLD signal model predicts that a weak CBF undershoot can produce a much larger BOLD signal undershoot without elevated CMRO2. (Figure courtesy of Valerie Griffeth).
In short, the original balloon model assumption of slow venous CBV recovery is at best only part of the story of the BOLD undershoot. At this point it may be useful to reframe the current experimental goals by drawing a distinction between two basic hypotheses for the BOLD undershoot: a metabolic effect related to slow recovery of CMRO2, or a hemodynamic effect related to a combination of a CBF undershoot with a slow recovery of venous CBV. Note that a CBF undershoot could in principle be driven by a reduction in neural activity, as suggested in a recent study in which the undershoot was modulated by the type of stimulus applied (Sadaghiani et al., 2009). Another possibility is that the dynamic behavior of the CBF response is similar to that of a damped harmonic oscillator, as suggested by Friston (Friston et al., 2000) and recently developed by Ress (Ress et al., 2009). To me the hemodynamic hypothesis appears to be able to explain more of the data, but new studies focused on distinguishing the broader hemodynamic hypothesis from the metabolic hypothesis are needed.
5. Summary and future directions
As modeling of BOLD contrast has evolved we have had a steady convergence on the basic biophysical model of how different physiological effects contribute to the BOLD signal (e.g., see (Uludag et al., 2009;Griffeth and Buxton, 2011)). That is, there is reasonable agreement that if we know what the physiological changes are we can predict what the BOLD response will be. However, the physiological relationships still elude us. The original balloon model was an attempt to find a plausible set of relationships v(f) and E(f) that would let us move forward with modeling the BOLD response as a simple function of the CBF response. As the field has matured, particularly with the accumulation of more specific experimental data, these simple relationships have broken down as a full picture of the physiology (Figure 3). The hemodynamic response needs to include the possibility of a CBF undershoot as well as a slow recovery of venous CBV, and indeed this may be the dominant effect. The relationship between CBF and CMRO2 changes is not fixed, and we do not understand the pattern of variability sufficiently to model it. For these reasons, we cannot make a simple predictive model for the BOLD response because we do not yet understand the physiology.
Figure 3.
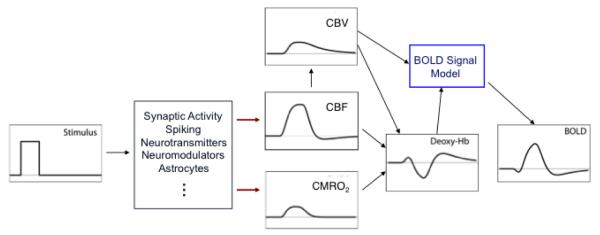
The current view of the physiological basis of the BOLD response is more complex than what was modeled with the balloon model. The key difference is that current studies support a picture of CBF and CMRO2 responses driven in parallel by different aspects of neural activity, so that we must think of a hemodynamic response and a metabolic response as independent effects. The origin of the post-stimulus undershoot is still uncertain, although the original assumption of a pure CBV effect cannot explain all of the current experimental data. Instead, a useful focus now is between a hemodynamic hypothesis, including elements of both a CBF undershoot and a slow venous CBV recovery (as shown) or a metabolic hypothesis related to slow recovery of CMRO2.
On the positive side, though, dynamic measurements of both CBF and BOLD responses offer us one of the best windows available for understanding the physiology. In particular, quantitative dynamic fMRI is the best hope we have for understanding the dynamics of CMRO2 (Buxton, 2010;Griffeth et al., 2011). As the sophistication of the basic experimental methods improves, new models of the dynamics will surely follow. Perhaps the most important question is: which aspects of neural activity drive CBF, and which aspects drive CMRO2? A solid experimental answer to that question will allow us to develop newer, more accurate models for the BOLD response and provide a richer context for interpreting BOLD studies in both health and disease.
Acknowledgements
The author would like to thank Nic Blockley, Valerie Griffeth and Aaron Simon for helpful discussion of this material. The author is supported by NIH grant NS-36722.
Footnotes
Publisher's Disclaimer: This is a PDF file of an unedited manuscript that has been accepted for publication. As a service to our customers we are providing this early version of the manuscript. The manuscript will undergo copyediting, typesetting, and review of the resulting proof before it is published in its final citable form. Please note that during the production process errors may be discovered which could affect the content, and all legal disclaimers that apply to the journal pertain.
References
- Ances BM, Leontiev O, Perthen JE, Liang C, Lansing AE, Buxton RB. Regional differences in the coupling of cerebral blood flow and oxygen metabolism changes in response to activation: Implications for BOLD-fMRI. Neuroimage. 2008;39:1510–1521. doi: 10.1016/j.neuroimage.2007.11.015. [DOI] [PMC free article] [PubMed] [Google Scholar]
- Ances BM, Wilson DF, Greenberg JH, Detre JA. Dynamic changes in cerebral blood flow, O2 tension, and calculated cerebral metabolic rate of O2 during functional activation using oxygen phosphorescence quenching. J Cereb Blood Flow Metab. 2001;21:511–516. doi: 10.1097/00004647-200105000-00005. [DOI] [PubMed] [Google Scholar]
- Attwell D, Iadecola C. The neural basis of functional brain imaging signals. Trends Neurosci. 2002;25:621–625. doi: 10.1016/s0166-2236(02)02264-6. [DOI] [PubMed] [Google Scholar]
- Attwell D, Laughlin SB. An energy budget for signaling in the grey matter of the brain. J Cereb Blood Flow Metab. 2001;21:1133–1145. doi: 10.1097/00004647-200110000-00001. [DOI] [PubMed] [Google Scholar]
- Aubert A, Costalat R. A model of the coupling between brain electrical activity, metabolism, and hemodynamics: application to the interpretation of functional neuroimaging. Neuroimage. 2002;17:1162–1181. doi: 10.1006/nimg.2002.1224. [DOI] [PubMed] [Google Scholar]
- Aubert A, Pellerin L, Magistretti PJ, Costalat R. A coherent neurobiological framework for functional neuroimaging provided by a model integrating compartmentalized energy metabolism. Proc Natl Acad Sci U S A. 2007;104:4188–4193. doi: 10.1073/pnas.0605864104. [DOI] [PMC free article] [PubMed] [Google Scholar]
- Behzadi Y, Liu TT. An arteriolar compliance model of the cerebral blood flow response to neural stimulus. Neuroimage. 2005;25:1100–1111. doi: 10.1016/j.neuroimage.2004.12.057. [DOI] [PubMed] [Google Scholar]
- Behzadi Y, Liu TT. Caffeine reduces the initial dip in the visual BOLD response at 3 T. Neuroimage. 2006;32:9–15. doi: 10.1016/j.neuroimage.2006.03.005. [DOI] [PubMed] [Google Scholar]
- Blockley NP, Francis ST, Gowland PA. Perturbation of the BOLD response by a contrast agent and interpretation through a modified balloon model. Neuroimage. 2009;48:84–93. doi: 10.1016/j.neuroimage.2009.06.038. [DOI] [PubMed] [Google Scholar]
- Buxton RB. The elusive initial dip. Neuroimage. 2001;13:953–958. doi: 10.1006/nimg.2001.0814. [DOI] [PubMed] [Google Scholar]
- Buxton RB. Interpreting oxygenation-based neuroimaging signals: the importance and the challenge of understanding brain oxygen metabolism. Front Neuroenergetics. 2010;2:8. doi: 10.3389/fnene.2010.00008. [DOI] [PMC free article] [PubMed] [Google Scholar]
- Buxton RB, Frank LR. A model for the coupling between cerebral blood flow and oxygen metabolism during neural stimulation. J Cereb Blood Flow Metab. 1997;17:64–72. doi: 10.1097/00004647-199701000-00009. [DOI] [PubMed] [Google Scholar]
- Buxton RB, Uludag K, Dubowitz DJ, Liu TT. Modeling the hemodynamic response to brain activation. Neuroimage. 2004;23(Suppl 1):S220–233. doi: 10.1016/j.neuroimage.2004.07.013. [DOI] [PubMed] [Google Scholar]
- Buxton RB, Wong EC, Frank LR. Dynamics of blood flow and oxygenation changes during brain activation: the balloon model. Magn. Reson. Med. 1998;39:855–864. doi: 10.1002/mrm.1910390602. [DOI] [PubMed] [Google Scholar]
- Chen BR, Bouchard MB, Mccaslin AF, Burgess SA, Hillman EM. High-speed vascular dynamics of the hemodynamic response. Neuroimage. 2011;54:1021–1030. doi: 10.1016/j.neuroimage.2010.09.036. [DOI] [PMC free article] [PubMed] [Google Scholar]
- Chen JJ, Pike GB. Origins of the BOLD post-stimulus undershoot. Neuroimage. 2009;46:559–568. doi: 10.1016/j.neuroimage.2009.03.015. [DOI] [PubMed] [Google Scholar]
- Chiarelli PA, Bulte DP, Gallichan D, Piechnik SK, Wise R, Jezzard P. Flow-metabolism coupling in human visual, motor, and supplementary motor areas assessed by magnetic resonance imaging. Magn Reson Med. 2007;57:538–547. doi: 10.1002/mrm.21171. [DOI] [PubMed] [Google Scholar]
- Cohen ER, Ugurbil K, Kim SG. Effect of basal conditions on the magnitude and dynamics of the blood oxygenation level-dependent fMRI response. J Cereb Blood Flow Metab. 2002;22:1042–1053. doi: 10.1097/00004647-200209000-00002. [DOI] [PubMed] [Google Scholar]
- Davis TL, Kwong KK, Weisskoff RM, Rosen BR. Calibrated functional MRI: mapping the dynamics of oxidative metabolism. Proc. Natl. Acad. Sci. USA. 1998;95:1834–1839. doi: 10.1073/pnas.95.4.1834. [DOI] [PMC free article] [PubMed] [Google Scholar]
- Dechent P, Schutze G, Helms G, Merboldt KD, Frahm J. Basal cerebral blood volume during the poststimulation undershoot in BOLD MRI of the human brain. J Cereb Blood Flow Metab. 2011;31:82–89. doi: 10.1038/jcbfm.2010.133. [DOI] [PMC free article] [PubMed] [Google Scholar]
- Devor A, Dunn AK, Andermann ML, Ulbert I, Boas DA, Dale AM. Coupling of total hemoglobin concentration, oxygenation, and neural activity in rat somatosensory cortex. Neuron. 2003;39:353–359. doi: 10.1016/s0896-6273(03)00403-3. [DOI] [PubMed] [Google Scholar]
- Devor A, Sakadzic S, Saisan PA, Yaseen MA, Roussakis E, Srinivasan VJ, Vinogradov SA, Rosen BR, Buxton RB, Dale AM, Boas DA. “Overshoot” of o2 is required to maintain baseline tissue oxygenation at locations distal to blood vessels. J Neurosci. 2011;31:13676–13681. doi: 10.1523/JNEUROSCI.1968-11.2011. [DOI] [PMC free article] [PubMed] [Google Scholar]
- Devor A, Tian P, Nishimura N, Teng IC, Hillman EM, Narayanan SN, Ulbert I, Boas DA, Kleinfeld D, Dale AM. Suppressed neuronal activity and concurrent arteriolar vasoconstriction may explain negative blood oxygenation level-dependent signal. J Neurosci. 2007;27:4452–4459. doi: 10.1523/JNEUROSCI.0134-07.2007. [DOI] [PMC free article] [PubMed] [Google Scholar]
- Donahue MJ, Stevens RD, De Boorder M, Pekar JJ, Hendrikse J, Van Zijl PC. Hemodynamic changes after visual stimulation and breath holding provide evidence for an uncoupling of cerebral blood flow and volume from oxygen metabolism. J Cereb Blood Flow Metab. 2009;29:176–185. doi: 10.1038/jcbfm.2008.109. [DOI] [PMC free article] [PubMed] [Google Scholar]
- Drew PJ, Shih AY, Kleinfeld D. Fluctuating and sensory-induced vasodynamics in rodent cortex extend arteriole capacity. Proc Natl Acad Sci U S A. 2011;108:8473–8478. doi: 10.1073/pnas.1100428108. [DOI] [PMC free article] [PubMed] [Google Scholar]
- Feng CM, Liu HL, Fox PT, Gao JH. Comparison of the experimental BOLD signal change in event-related fMRI with the balloon model. NMR Biomed. 2001;14:397–401. doi: 10.1002/nbm.718. [DOI] [PubMed] [Google Scholar]
- Fox PT, Raichle ME. Focal physiological uncoupling of cerebral blood flow and oxidative metabolism during somatosensory stimulation in human subjects. Proc. Natl. Acad. Sci. USA. 1986;83:1140–1144. doi: 10.1073/pnas.83.4.1140. [DOI] [PMC free article] [PubMed] [Google Scholar]
- Frahm J, Baudewig J, Kallenberg K, Kastrup A, Merboldt KD, Dechent P. The post-stimulation undershoot in BOLD fMRI of human brain is not caused by elevated cerebral blood volume. Neuroimage. 2008;40:473–481. doi: 10.1016/j.neuroimage.2007.12.005. [DOI] [PubMed] [Google Scholar]
- Frahm J, Krüger G, Merboldt K-D, Kleinschmidt A. Dynamic uncoupling and recoupling of perfusion and oxidative metabolism during focal activation in man. Magn. Reson. Med. 1996;35:143–148. doi: 10.1002/mrm.1910350202. [DOI] [PubMed] [Google Scholar]
- Friston KJ. Bayesian estimation of dynamical systems: an application to fMRI. Neuroimage. 2002;16:513–530. doi: 10.1006/nimg.2001.1044. [DOI] [PubMed] [Google Scholar]
- Friston KJ, Mechelli A, Turner R, Price CJ. Nonlinear responses in fMRI: the Balloon model, Volterra kernels, and other hemodynamics. Neuroimage. 2000;12:466–477. doi: 10.1006/nimg.2000.0630. [DOI] [PubMed] [Google Scholar]
- Frostig RD, Lieke EE, Ts’o DY, Grinvald A. Cortical functional architecture and local coupling between neuronal activity and the microcirculation revealed by in vivo high-resolution optical imaging of intrinsic signals. Proc. Natl. Acad. Sci. USA. 1990;87:6082–6086. doi: 10.1073/pnas.87.16.6082. [DOI] [PMC free article] [PubMed] [Google Scholar]
- Fuchtemeier M, Leithner C, Offenhauser N, Foddis M, Kohl-Bareis M, Dirnagl U, Lindauer U, Royl G. Elevating intracranial pressure reverses the decrease in deoxygenated hemoglobin and abolishes the post-stimulus overshoot upon somatosensory activation in rats. Neuroimage. 2010;52:445–454. doi: 10.1016/j.neuroimage.2010.04.237. [DOI] [PubMed] [Google Scholar]
- Gnaiger E, Lassnig B, Kuznetsov A, Rieger G, Margreiter R. Mitochondrial oxygen affinity, respiratory flux control and excess capacity of cytochrome c oxidase. J Exp Biol. 1998;201:1129–1139. doi: 10.1242/jeb.201.8.1129. [DOI] [PubMed] [Google Scholar]
- Gobel U, Klein B, Schrock H, Kuschinsky W. Lack of capillary recruitment in the brains of awake rats during hypercapnia. J Cereb Blood Flow Metab. 1989;9:491–499. doi: 10.1038/jcbfm.1989.72. [DOI] [PubMed] [Google Scholar]
- Gobel U, Theilen H, Kuschinsky W. Congruence of total and perfused capillary network in rat brains. Circulation Research. 1990;66:271–281. doi: 10.1161/01.res.66.2.271. [DOI] [PubMed] [Google Scholar]
- Griffeth VE, Buxton RB. A theoretical framework for estimating cerebral oxygen metabolism changes using the calibrated-BOLD method: Modeling the effects of blood volume distribution, hematocrit, oxygen extraction fraction, and tissue signal properties on the BOLD signal. Neuroimage. 2011;58:198–212. doi: 10.1016/j.neuroimage.2011.05.077. [DOI] [PMC free article] [PubMed] [Google Scholar]
- Griffeth VE, Perthen JE, Buxton RB. Prospects for quantitative fMRI: Investigating the effects of caffeine on baseline oxygen metabolism and the response to a visual stimulus in humans. Neuroimage. 2011;57:809–816. doi: 10.1016/j.neuroimage.2011.04.064. [DOI] [PMC free article] [PubMed] [Google Scholar]
- Grinvald A, Frostig RD, Siegel RM, Bratfeld E. High -resolution optical imaging of functional brain architecture in the awake monkey. Proc. Natl. Acad. Sci. USA. 1991;88:11559–11563. doi: 10.1073/pnas.88.24.11559. [DOI] [PMC free article] [PubMed] [Google Scholar]
- Grubb RL, Jr., Raichle ME, Eichling JO, Ter-Pogossian MM. The effects of changes in PaCO2 on cerebral blood volume, blood flow, and vascular mean transit time. Stroke. 1974;5:630–639. doi: 10.1161/01.str.5.5.630. [DOI] [PubMed] [Google Scholar]
- Hamel E. Perivascular nerves and the regulation of cerebrovascular tone. J Appl Physiol. 2006;100:1059–1064. doi: 10.1152/japplphysiol.00954.2005. [DOI] [PubMed] [Google Scholar]
- Hennig J, Ernst T, Speck O, Deuschl G, Feifel E. Dection of brain activation using oxygenation sensitive functional spectroscopy. Magn. Reson. Med. 1994;31:85–90. doi: 10.1002/mrm.1910310115. [DOI] [PubMed] [Google Scholar]
- Hillman EM, Devor A, Bouchard MB, Dunn AK, Krauss GW, Skoch J, Bacskai BJ, Dale AM, Boas DA. Depth-resolved optical imaging and microscopy of vascular compartment dynamics during somatosensory stimulation. Neuroimage. 2007;35:89–104. doi: 10.1016/j.neuroimage.2006.11.032. [DOI] [PMC free article] [PubMed] [Google Scholar]
- Hoge RD, Atkinson J, Gill B, Crelier GR, Marrett S, Pike GB. Linear coupling between cerebral blood flow and oxygen consumption in activated human cortex. Proc. Natl. Acad. Sci., USA. 1999;96:9403–9408. doi: 10.1073/pnas.96.16.9403. [DOI] [PMC free article] [PubMed] [Google Scholar]
- Hua J, Stevens RD, Huang AJ, Pekar JJ, Van Zijl PC. Physiological origin for the BOLD poststimulus undershoot in human brain: vascular compliance versus oxygen metabolism. J Cereb Blood Flow Metab. 2011;31:1599–1611. doi: 10.1038/jcbfm.2011.35. [DOI] [PMC free article] [PubMed] [Google Scholar]
- Iadecola C, Nedergaard M. Glial regulation of the cerebral microvasculature. Nat Neurosci. 2007;10:1369–1376. doi: 10.1038/nn2003. [DOI] [PubMed] [Google Scholar]
- Kim T, Kim SG. Temporal dynamics and spatial specificity of arterial and venous blood volume changes during visual stimulation: implication for BOLD quantification. J Cereb Blood Flow Metab. 2011;31:1211–1222. doi: 10.1038/jcbfm.2010.226. [DOI] [PMC free article] [PubMed] [Google Scholar]
- Koehler RC, Roman RJ, Harder DR. Astrocytes and the regulation of cerebral blood flow. Trends Neurosci. 2009;32:160–169. doi: 10.1016/j.tins.2008.11.005. [DOI] [PubMed] [Google Scholar]
- Kong Y, Zheng Y, Johnston D, Martindale J, Jones M, Billings S, Mayhew J. A model of the dynamic relationship between blood flow and volume changes during brain activation. J Cereb Blood Flow Metab. 2004;24:1382–1392. doi: 10.1097/01.WCB.0000141500.74439.53. [DOI] [PubMed] [Google Scholar]
- Kruger G, Kleinschmidt A, Frahm J. Dynamic MRI sensitized to cerebral blood oxygenation and flow during sustained activation of human visual cortex‘. Magn. Reson. Med. 1996;35:797–800. doi: 10.1002/mrm.1910350602. [DOI] [PubMed] [Google Scholar]
- Kwong KK, Belliveau JW, Chesler DA, Goldberg IE, Weisskoff RM, Poncelet BP, Kennedy DN, Hoppel BE, Cohen MS, Turner R. Dynamic magnetic resonance imaging of human brain activity during primary sensory stimulation. Proc Natl Acad Sci U S A. 1992;89:5675–5679. doi: 10.1073/pnas.89.12.5675. Et Al. [DOI] [PMC free article] [PubMed] [Google Scholar]
- Lauritzen M. Reading vascular changes in brain imaging: is dendritic calcium the key? Nat Rev Neurosci. 2005;6:77–85. doi: 10.1038/nrn1589. [DOI] [PubMed] [Google Scholar]
- Liang C, Buxton RB. Stimulus contrast alters CBF/CMRO2 coupling. International Society for Magnetic Resonance in Medicine. (Year)
- Liu TT, Behzadi Y, Restom K, Uludag K, Lu K, Buracas GT, Dubowitz DJ, Buxton RB. Caffeine alters the temporal dynamics of the visual BOLD response. Neuroimage. 2004;23:1402–1413. doi: 10.1016/j.neuroimage.2004.07.061. [DOI] [PubMed] [Google Scholar]
- Logothetis NK. What we can do and what we cannot do with fMRI. Nature. 2008;453:869–878. doi: 10.1038/nature06976. [DOI] [PubMed] [Google Scholar]
- Logothetis NK, Pauls J, Augath M, Trinath T, Oeltermann A. Neurophysiological investigation of the basis of the fMRI signal. Nature. 2001;412:150–157. doi: 10.1038/35084005. [DOI] [PubMed] [Google Scholar]
- Lu H, Golay X, Pekar JJ, Van Zijl PC. Sustained poststimulus elevation in cerebral oxygen utilization after vascular recovery. J Cereb Blood Flow Metab. 2004;24:764–770. doi: 10.1097/01.WCB.0000124322.60992.5C. [DOI] [PubMed] [Google Scholar]
- Mandeville JB, Marota J, Keltner JR, Kosovsky B, Burke J, Hyman S, Lapointe L, Reese T, Kwong K, Rosen B, Weissleder R, Weisskoff R. CBV functional imaging in rat brain using iron oxide agent at steady state concentration. ISMRM, Fourth Scientific Meeting; p. 292. (Year) [Google Scholar]
- Mandeville JB, Marota JJA, Ayata C, Zaharchuk G, Moskowitz MA, Rosen BR, Weisskoff RM. Evidence of a cerebrovascular post-arteriole Windkessel with delayed compliance. J. Cereb. Blood Flow and Metabol. 1999;19:679–689. doi: 10.1097/00004647-199906000-00012. [DOI] [PubMed] [Google Scholar]
- Mandeville JB, Marota JJA, Kosofsky BE, Keltner JR, Weissleder R, Rosen BR, Weisskoff RM. Dynamic functional imaging of relative cerebral blood volume during rat forepaw stimulation. Magn. Reson. Med. 1998;39:615–624. doi: 10.1002/mrm.1910390415. [DOI] [PubMed] [Google Scholar]
- Mark CI, Fisher JA, Pike GB. Improved fMRI calibration: precisely controlled hyperoxic versus hypercapnic stimuli. Neuroimage. 2011;54:1102–1111. doi: 10.1016/j.neuroimage.2010.08.070. [DOI] [PubMed] [Google Scholar]
- Menon RS, Ogawa S, Strupp JP, Anderson P, Ugurbil K. BOLD based functional MRI at 4 tesla includes a capillary bed contribution: echo-planar imaging correlates with previous optical imaging using intrinsic signals. Magn. Reson. Med. 1995;33:453–459. doi: 10.1002/mrm.1910330323. [DOI] [PubMed] [Google Scholar]
- Miller KL, Luh WM, Liu TT, Martinez A, Obata T, Wong EC, Frank LR, Buxton RB. Nonlinear temporal dynamics of the cerebral blood flow response. Hum Brain Mapp. 2001;13:1–12. doi: 10.1002/hbm.1020. [DOI] [PMC free article] [PubMed] [Google Scholar]
- Moradi F, Buracas GT, Buxton RB. Attention strongly increases oxygen metabolic response to stimulus in primary visual cortex. Neuroimage. 2011 doi: 10.1016/j.neuroimage.2011.07.078. (in press) [DOI] [PMC free article] [PubMed] [Google Scholar]
- Nagaoka T, Zhao F, Wang P, Harel N, Kennan RP, Ogawa S, Kim SG. Increases in oxygen consumption without cerebral blood volume change during visual stimulation under hypotension condition. J Cereb Blood Flow Metab. 2006;26:1043–1051. doi: 10.1038/sj.jcbfm.9600251. [DOI] [PubMed] [Google Scholar]
- Obata T, Liu TT, Miller KL, Luh WM, Wong EC, Frank LR, Buxton RB. Discrepancies between BOLD and flow dynamics in primary and supplementary motor areas: application of the balloon model to the interpretation of BOLD transients. Neuroimage. 2004;21:144–153. doi: 10.1016/j.neuroimage.2003.08.040. [DOI] [PubMed] [Google Scholar]
- Perthen JE, Lansing AE, Liau J, Liu TT, Buxton RB. Caffeine-induced uncoupling of cerebral blood flow and oxygen metabolism: A calibrated BOLD fMRI study. Neuroimage. 2008;40:237–247. doi: 10.1016/j.neuroimage.2007.10.049. [DOI] [PMC free article] [PubMed] [Google Scholar]
- Poser BA, Van Mierlo E, Norris DG. Exploring the post-stimulus undershoot with spin-echo fMRI: implications for models of neurovascular response. Hum Brain Mapp. 2011;32:141–153. doi: 10.1002/hbm.21003. [DOI] [PMC free article] [PubMed] [Google Scholar]
- Ress D, Thompson JK, Rokers B, Khan RK, Huk AC. A model for transient oxygen delivery in cerebral cortex. Front Neuroenergetics. 2009;1:3. doi: 10.3389/neuro.14.003.2009. [DOI] [PMC free article] [PubMed] [Google Scholar]
- Riera JJ, Jimenez JC, Wan X, Kawashima R, Ozaki T. Nonlinear local electrovascular coupling. II: From data to neuronal masses. Hum Brain Mapp. 2007;28:335–354. doi: 10.1002/hbm.20278. [DOI] [PMC free article] [PubMed] [Google Scholar]
- Riera JJ, Wan X, Jimenez JC, Kawashima R. Nonlinear local electrovascular coupling. I: A theoretical model. Hum Brain Mapp. 2006;27:896–914. doi: 10.1002/hbm.20230. [DOI] [PMC free article] [PubMed] [Google Scholar]
- Sadaghiani S, Ugurbil K, Uludag K. Neural activity-induced modulation of BOLD poststimulus undershoot independent of the positive signal. Magn Reson Imaging. 2009;27:1030–1038. doi: 10.1016/j.mri.2009.04.003. [DOI] [PubMed] [Google Scholar]
- Schroeter ML, Kupka T, Mildner T, Uludag K, Von Cramon DY. Investigating the post-stimulus undershoot of the BOLD signal--a simultaneous fMRI and fNIRS study. Neuroimage. 2006;30:349–358. doi: 10.1016/j.neuroimage.2005.09.048. [DOI] [PubMed] [Google Scholar]
- Sirotin YB, Hillman EM, Bordier C, Das A. Spatiotemporal precision and hemodynamic mechanism of optical point spreads in alert primates. Proc Natl Acad Sci U S A. 2009;106:18390–18395. doi: 10.1073/pnas.0905509106. [DOI] [PMC free article] [PubMed] [Google Scholar]
- Stefanovic B, Warnking JM, Pike GB. Hemodynamic and metabolic responses to neuronal inhibition. Neuroimage. 2004;22:771–778. doi: 10.1016/j.neuroimage.2004.01.036. [DOI] [PubMed] [Google Scholar]
- Thompson JK, Peterson MR, Freeman RD. Single-neuron activity and tissue oxygenation in the cerebral cortex. Science. 2003;299:1070–1072. doi: 10.1126/science.1079220. [DOI] [PubMed] [Google Scholar]
- Thompson JK, Peterson MR, Freeman RD. Separate spatial scales determine neural activity-dependent changes in tissue oxygen within central visual pathways. J Neurosci. 2005;25:9046–9058. doi: 10.1523/JNEUROSCI.2127-05.2005. [DOI] [PMC free article] [PubMed] [Google Scholar]
- Toronov V, Walker S, Gupta R, Choi JH, Gratton E, Hueber D, Webb A. The roles of changes in deoxyhemoglobin concentration and regional cerebral blood volume in the fMRI BOLD signal. Neuroimage. 2003;19:1521–1531. doi: 10.1016/s1053-8119(03)00152-6. [DOI] [PubMed] [Google Scholar]
- Turner R, Jezzard P, Wen H, Kwong KK, Bihan DL, Zeffiro T, Balaban RS. Functional mapping of the human visual cortex at 4 and 1.5 tesla using deoxygenation contrast EPI. Magn. Reson. Med. 1993;29:277–279. doi: 10.1002/mrm.1910290221. [DOI] [PubMed] [Google Scholar]
- Tuunanen PI, Vidyasagar R, Kauppinen RA. Effects of mild hypoxic hypoxia on poststimulus undershoot of blood-oxygenation-level-dependent fMRI signal in the human visual cortex. Magn Reson Imaging. 2006;24:993–999. doi: 10.1016/j.mri.2006.04.017. [DOI] [PubMed] [Google Scholar]
- Uludag K. To dip or not to dip: reconciling optical imaging and fMRI data. Proc Natl Acad Sci U S A. 2010;107:E23. doi: 10.1073/pnas.0914194107. reply E24. [DOI] [PMC free article] [PubMed] [Google Scholar]
- Uludag K, Dubowitz DJ, Yoder EJ, Restom K, Liu TT, Buxton RB. Coupling of cerebral blood flow and oxygen consumption during physiological activation and deactivation measured with fMRI. Neuroimage. 2004;23:148–155. doi: 10.1016/j.neuroimage.2004.05.013. [DOI] [PubMed] [Google Scholar]
- Uludag K, Muller-Bierl B, Ugurbil K. An integrative model for neuronal activity-induced signal changes for gradient and spin echo functional imaging. Neuroimage. 2009;48:150–165. doi: 10.1016/j.neuroimage.2009.05.051. [DOI] [PubMed] [Google Scholar]
- Yacoub E, Ugurbil K, Harel N. The spatial dependence of the poststimulus undershoot as revealed by high-resolution BOLD- and CBV-weighted fMRI. J Cereb Blood Flow Metab. 2006;26:634–644. doi: 10.1038/sj.jcbfm.9600239. [DOI] [PubMed] [Google Scholar]
- Zappe AC, Uludag K, Logothetis NK. Direct measurement of oxygen extraction with fMRI using 6% CO2 inhalation. Magn Reson Imaging. 2008;26:961–967. doi: 10.1016/j.mri.2008.02.005. [DOI] [PubMed] [Google Scholar]
- Zhao F, Jin T, Wang P, Kim SG. Improved spatial localization of post-stimulus BOLD undershoot relative to positive BOLD. Neuroimage. 2007;34:1084–1092. doi: 10.1016/j.neuroimage.2006.10.016. [DOI] [PMC free article] [PubMed] [Google Scholar]
- Zheng Y, Mayhew J. A time-invariant visco-elastic windkessel model relating blood flow and blood volume. Neuroimage. 2009;47:1371–1380. doi: 10.1016/j.neuroimage.2009.04.022. [DOI] [PMC free article] [PubMed] [Google Scholar]
- Zheng Y, Pan Y, Harris S, Billings S, Coca D, Berwick J, Jones M, Kennerley A, Johnston D, Martin C, Devonshire IM, Mayhew J. A dynamic model of neurovascular coupling: Implications for blood vessel dilation and constriction. Neuroimage. 2010 doi: 10.1016/j.neuroimage.2010.01.102. [DOI] [PMC free article] [PubMed] [Google Scholar]