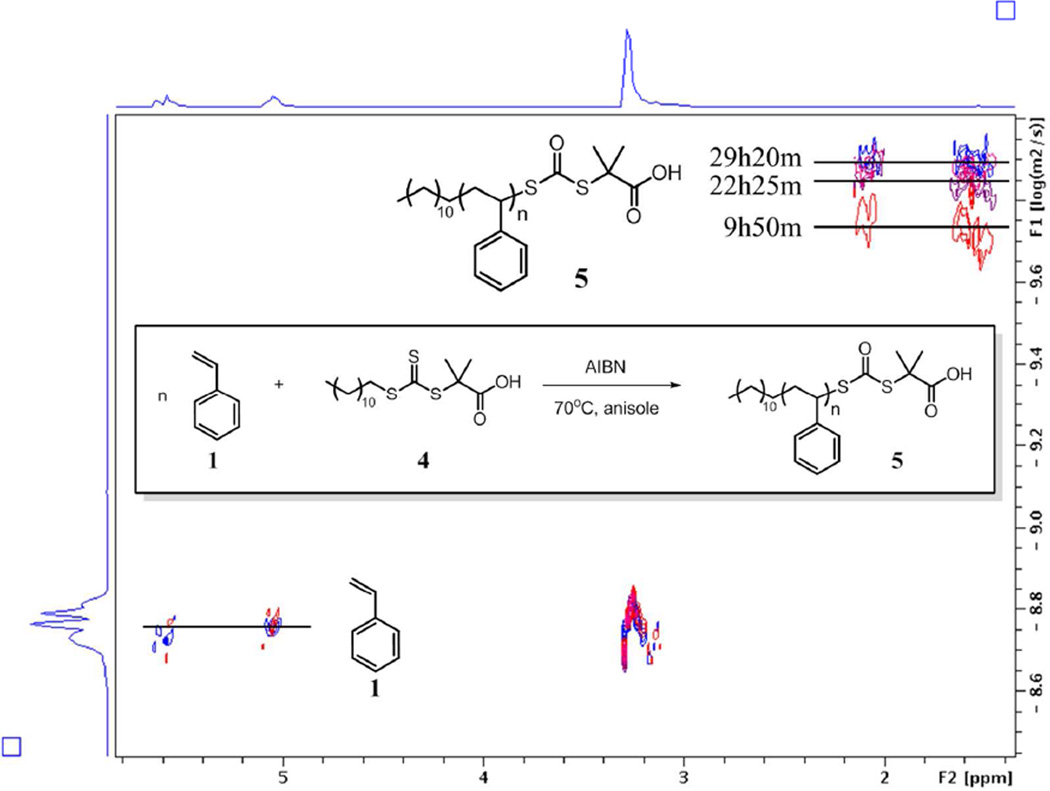
Figure 4.
Stacked DOSY spectra of reaction crude of RAFT. DOSY spectra of 0h, 9h50m, 22h25m, and 29h20min were stacked. Olefinic peaks of styrene were used as internal references to monitor the viscosity change of the dilute crude solution. Due to the heavy overlap of the aromatic regions of styrene and polystyrene, they are not shown in the stacked spectra. Representative RAFT 1H DOSY spectra can be found in supplementary Figure S21.

