The authors found that practice size was related to practice mergers, hiring additional staff, and increasing staff pay in the past 12 months; metropolitan practices were more likely to have experienced mergers in the past 12 months than those in nonmetropolitan areas.
Abstract
In response to reports of increasing financial and administrative burdens on oncology practices and a lack of systematic information related to these issues, American Society of Clinical Oncology (ASCO) leadership started an effort to collect key practice-level data from all oncology practices in the United States. The result of the effort is the ASCO National Census of Oncology Practices (Census) launched in June 2012. The initial Census work involved compiling an inventory of oncology practices from existing lists of oncology physicians in the United States. A comprehensive, online data collection instrument was developed, which covered a number of areas, including practice characteristics (staffing configuration, organizational structure, patient mix and volume, types of services offered); organizational, staffing, and service changes over the past 12 months; and an assessment of the likelihood that the practice would experience organizational, staffing, and service changes in the next 12 months. More than 600 practices participated in the Census by providing information. In this article, we present preliminary highlights from the data gathered to date. We found that practice size was related to having experienced practice mergers, hiring additional staff, and increasing staff pay in the past 12 months, that geographic location was related to having experienced hiring additional staff, and that practices in metropolitan areas were more likely to have experienced practice mergers in the past 12 months than those in nonmetropolitan areas. We also found that practice size and geographic location were related to higher likelihoods of anticipating practice mergers, sales, and purchases in the future.
Introduction
The American Society of Clinical Oncology (ASCO) National Census of Oncology Practices (Census) originated as a program to gather systematic information about the existing and trending ownership structure of oncology practices at a time when practices are working to adapt to increasing administrative and financial pressures. Specific broad reporting information regarding oncology practices is necessary to understand how these practices are adapting to environmental stressors and opportunities as they continue to provide high-quality cancer care to their patients. Absent this basic information about oncology practices, policy solutions and other interventions may be inadequate to respond to the anticipated shortage of oncologists1 or may inadvertently address the wrong issues.
The goals of ASCO regarding the Census were: one, to collect systematic demographic data on all oncology practices in the United States, including data on practice size, makeup and organization, affiliations with hospitals and other entities, staffing characteristics, and patient characteristics; two, to learn how oncology practices are adapting to administrative and financial pressures with relation to these demographic characteristics; and three, to develop the capacity to monitor oncology practice characteristics and changes therewith to tailor its advocacy, educational products, and practice support efforts appropriately, thereby best meeting the needs of its members and the larger oncology practice community as they care for patients in a shifting health care delivery landscape.
In this article, we briefly recount the development of the Census and summarize several findings derived from the information that was collected. The focus of the presentation of findings is on describing the practices that participated and how practice size and location were related to practice changes over the past year and anticipated changes over the next year. The article concludes with a discussion of the limitations of the data collected to date given the participation rate in the Census, especially among a specific class of practices, and the ASCO plan for continuing to build on the progress made in the initial 6 months.
Methods
Census Development and Deployment
The Census development process consisted of three distinct efforts: first, compilation of a listing of all potential US oncology practices; second, development of a data collection instrument; and third, deployment of the instrument for completion by oncology practices. ASCO contracted with a partner organization, the Center for Health Workforce Studies at the School of Public Health, University at Albany–State University of New York (the contractor), to conduct this work.
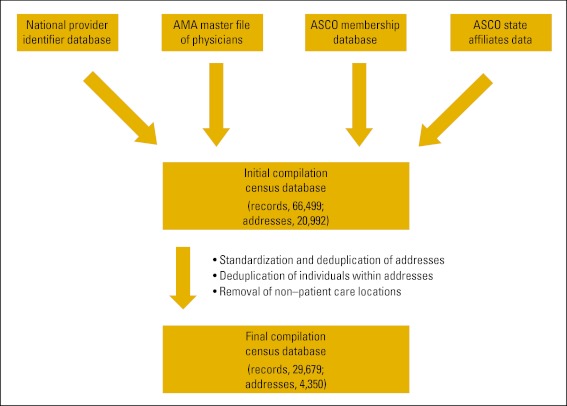
The strategy employed to identify oncology practices was focused on compiling and reconciling multiple lists of oncology physicians to identify the common addresses of oncology practice locations. The lists used included the Centers for Medicare and Medicaid Services National Provider Identifier Registry, which contains address and identification information on all health care providers who can receive direct Medicare reimbursement; the American Medical Association Masterfile of Physicians, which contains address, demographic, and limited practice characteristic information on all physicians in the United States; the ASCO membership database, which contains address, demographic, and limited practice characteristic information on members of the organization; and, finally, a collection of databases maintained by the state affiliates of ASCO on the names and addresses of oncology physicians or state affiliate members in their respective states (where available). The initial compilation of oncology physician records at common addresses across the databases yielded some 66,000 physician records and more than 20,000 potential practice addresses (Fig 1). The contractor conducted further reconciliation of the compiled data through address cleansing techniques, de-duplication of physician records at unique practice addresses, and exclusion of addresses of non–patient care locations (eg, pharmaceutical companies, corporate offices, foundations, patient advocacy organizations). The final inventory of oncology practices consisted of 4,350 practice addresses and 29,679 physician records. It should be acknowledged that this number of associated physician records exceeds the number of unique oncology physicians in the United States, because the objective was to generate a list of practice locations that included a list of the physicians who provide services at each practice. Furthermore, each address did not necessarily represent an independent oncology practice; rather, each represented the possible location of an oncology practice or a satellite office of an oncology practice.
Figure 1.
Oncology practice data compilation. AMA, American Medical Association; ASCO, American Society of Clinical Oncology.
Volunteers from the ASCO Clinical Practice Committee Working Group on Practice Trends and Economics, along with ASCO staff and the contractor, determined the substantive topics to be covered in the Census data collection instrument. These topics included practice ownership and relationships with other entities and practice characteristics, such as staffing configurations and characteristics, types of services provided, use of electronic health records (EHRs), and patient characteristics. The data collection instrument also included a battery of items devoted to the experiences of practices in the past 12 months, including changes in practice ownership and affiliation, staffing contraction and expansion, salary reduction and increase, changes in the types of services provided, and changes in the volume and mix of patients treated. Finally, the Census instrument included a bank of questions that inquired about the likelihood of changes in practice ownership and affiliation, staffing contraction and expansion, salary reduction and increase, types of services provided, and volume and mix of patients treated over the next 12 months. The substantive questions developed for the Census were pilot tested with a small number of practices. Feedback from the pilot testing was incorporated into the final instrument.
The instrument was developed as an online database application integrated within the ASCO Web site. The questions were designed to be answered by the practice administrator or practice manager (or equivalent), because the information requested was likely beyond the knowledge of any particular clinical staff member. A Census database record was constructed for each oncology practice identified in the practice inventory. A username and password were assigned to each practice to enable practice representatives to access their Census record. Each record was prepopulated with the practice name and address information as well as a list of physicians thought to be associated with the practice. To facilitate practices with more than one location to complete the Census, the database application afforded users the opportunity to start new records for each practice site on which they wished to report.
The Census was launched in late June 2012. Deployment involved a multipronged, multimedia approach. Beginning in late 2011, members of the ASCO Clinical Practice Committee and ASCO leadership began to conduct interviews announcing the Census project and its goals. As the launch date approached, ASCO leveraged its communications network to announce the Census through its daily electronic communications with members. Finally, to coincide with the launch of the database application, a letter of invitation was mailed to each practice in the inventory with instructions on how to access and complete the Census. Postcard reminders to practices that had not participated were distributed throughout the summer, as were a number of follow-up invitation letters with instructions on how to participate.
Because of an awareness of the effort required to complete the survey, an incentive was offered for participation to the first 300 practices that participated. The practice administrators at the first 100 practices to complete the Census received a $50 gift code that could be used at www.amazon.com. Practice administrators at the next 200 practices to complete the Census received a $25 gift code that could be used at www.amazon.com.
In addition, ASCO staff and many volunteers from ASCO member committees reached out to their contacts at practices across the country to encourage participation. This additional outreach led to the discovery of another 196 practices subsequent to the launch.
Response
As of the writing of this article, 632 practices have participated in the Census, with 542 having provided full-data replies. Response to the Census varied by geographic location (P < .001) and practice size (P < .001) but not by geography (metropolitan/nonmetropolitan status; P < .128; Table 1). Practices in the north central Census region were the most likely to respond (18.1%), whereas those in the west and northeast were the least likely (11.6% and 11.8%, respectively). Nonmetropolitan practices were slightly more likely to respond than metropolitan practices, but the difference was not statistically significant. In terms of practice size, practices in the top quartile (six or more oncology physicians) were the most likely to respond (17.1%).
Table 1.
Census Response Rate Analysis
| Characteristic | Population | Responses | Rate (%) | Test Value F | P |
|---|---|---|---|---|---|
| Overall | 4,546 | 632 | 13.9 | — | — |
| Geographic location | 7.166 | ≤ .001 | |||
| Northeast | 998 | 118 | 11.8 | ||
| North central | 996 | 180 | 18.1 | ||
| South | 1,586 | 221 | 13.9 | ||
| West | 965 | 112 | 11.6 | ||
| Metropolitan status | 2.319 | ≤ .128 | |||
| Nonmetropolitan | 497 | 79 | 15.9 | ||
| Metropolitan | 3,880 | 520 | 13.4 | ||
| Practice size, No. of oncology physicians | 16.228 | ≤ .001 | |||
| One | 1,136 | 108 | 9.5 | ||
| Two to five | 2,175 | 256 | 11.8 | ||
| ≥ Six | 1,114 | 191 | 17.1 |
Over the course of the data collection and follow-up outreach to nonrespondent practices, we became aware that particular types of practices were reluctant to participate. Several large integrated practices as well as practices within several professional management services networks chose not to participate; we felt this might have been the result of worries about sharing proprietary and competitive business information; other reasons may have existed as well. Moreover, because more information about oncology practices is generally not available, it should be noted that it is impossible to assess completely the extent to which the responses to the Census are representative of the entire population of oncology practices. For example, it is not known how well the responses represent academic practices, because a population database of academic practices with which to compare responses does not exist. Indeed, one of the reasons for starting the Census effort was to combat the dearth of information available on oncology practices in the United States.
There were two main barriers to participation in the Census. First, although it did not manifest in the pilot testing as a problem, compiling the information necessary for completion questions was labor intensive. Several of the items required consulting with other staff at the practice and/or reviewing records from the previous 12 months. Second, because there was such a large amount of information requested, entering the information into the database was time consuming. These factors are likely to have contributed to the lower than ideal response rate, especially among practices that do not have a dedicated practice administrator.
Given the premise that information on all the oncology practices was not known beforehand and the observed biases resulting from the types of practices that have participated to date, the reader should interpret the findings presented in the remainder of this article as preliminary—as a report on the progress of the Census effort to date.
Results
Practice Demographics
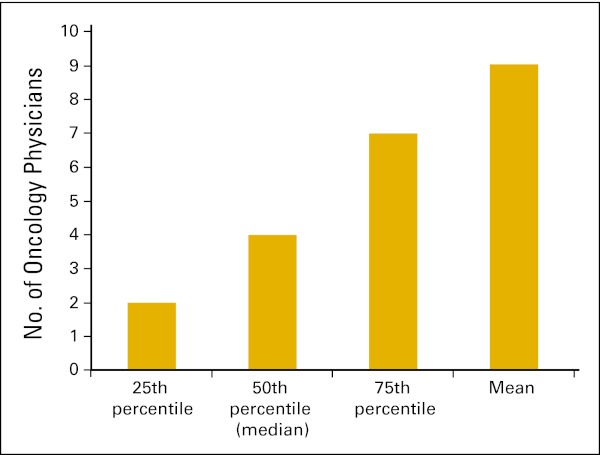
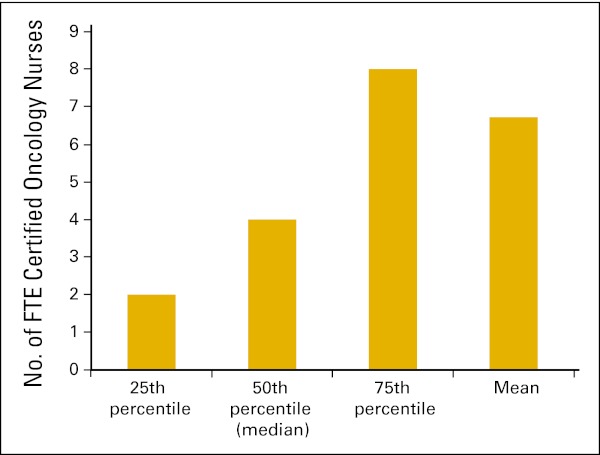
This section presents demographic information about the practices that participated in the Census. Respondents were asked to report the oncology physicians working in the practice as well as the staff full-time equivalents (FTEs) across a variety of clinical and nonclinical positions. Among the practices that reported to the Census, the mean number of oncology physicians in the practice was 9.0 (Fig 2). The average number of FTE oncology-certified nurses was 6.7 FTEs (Fig 3).
Figure 2.
Number of oncology physicians in practice (n = 555 practices).
Figure 3.
Number of full-time equivalent (FTE) certified oncology nurses in practice (n = 468 practices).
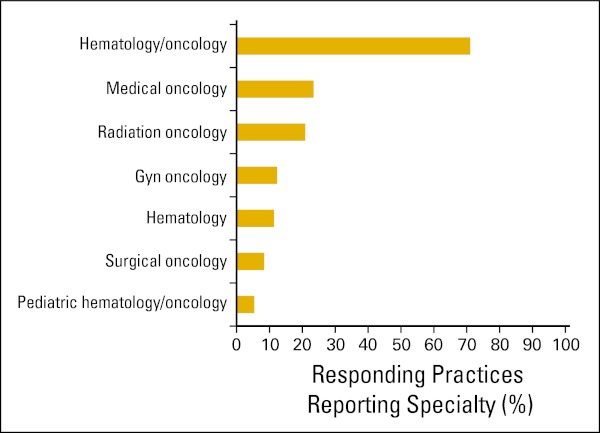
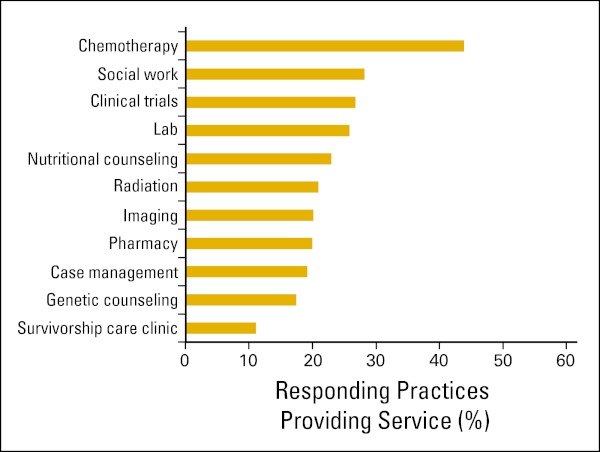
Practices were asked to report the medical specialties that the practice offered its patients. Figure 4 shows their responses. Nearly three quarters (71%) reported hematology/oncology. Slightly less than one quarter (23.4%) reported medical oncology, whereas one in five (20.9%) reported radiation oncology. Respondents were also asked to report the kinds of services that the practice provided. Figure 5 presents their responses. Chemotherapy services were reported to be offered at fewer than half of responding practices (43.8%). Social work, clinical trials, laboratory services, and nutritional counseling were reported by nearly one quarter of responding practices (28.2%, 26.7%, 25.8%, and 22.9%, respectively).
Figure 4.
Practice specialties reported (n = 632 practices). Gyn, gynecologic.
Figure 5.
Services provided by practices (n = 632 practices).
Respondents were asked how their practices were structured. Table 2 summarizes their responses. More than half of the respondents (55.9%) reported that their practices were private community practices. The next most common response was a nonacademic institution with employed physicians, given by 12.4% of respondents. Academic practices (both community and institutional) made up 11.3% of respondent practices. Finally, private integrated group practices that are part of large health systems made up 9.8% of the respondent practices.
Table 2.
Organization of Practices (n = 599 practices)
| Ownership Type | No. | % |
|---|---|---|
| Private community practice characterized as a corporation, partnership, or other legal entity | 335 | 55.9 |
| Private integrated group practice that is part of a large health care system (including those practices that own the institution in which they work or those practices captured within closed health care systems [eg, May, Gessinger, Scott & White; Kaiser; and so on]) | 59 | 9.8 |
| Institutional, nonacademic, employed physicians (including nonacademic hospitals, 501.a or 501.c3, or entities that are captured by part of the institution) | 74 | 12.4 |
| Institutional, nonacademic, contracted physicians | 21 | 3.5 |
| Academic practice (with academic teaching, academic research activities) | 57 | 9.5 |
| Academic community-based practice | 11 | 1.8 |
| Government (federal: PHS, military, VA; state) | 11 | 1.8 |
| Other | 31 | 5.2 |
| Total | 599 | 100.0 |
Abbreviations: PHS, Public Health Service; VA, Veterans Affairs.
Figure 6 presents Census participant responses to a question about the use of EHRs/electronic medical records (EMRs). More than 60% of the responding practices reported use of an advanced EHR/EMR. For the purposes of the Census, an advanced EHR/EMR was defined as a computerized system that includes the following functionalities: electronic sending of diagnostic or therapeutic plans and orders to internal staff or external entities; electronic transfer of patient data to other providers; connection to a personal health record; support for the physician with the diagnosis or treatment of a patient (eg, clinical decision support); and aggregate clinical data to create analytic reports for population health monitoring, quality reporting, and so on and to identify and provide relevant patient education (eg, medication instructions, treatment plans, and so on). Approximately 16% of responding practices reported use of a basic EHR/EMR, and 15% of respondents reported plans to implement an EHR/EMR within the next 6 months. Finally, a small portion of respondents (8.0%) reported no EHR/EMR use and no plans to implement such a system.
Figure 6.
Practice electronic health record (EHR)/electronic medical record (EMR) use (n = 597 practices).
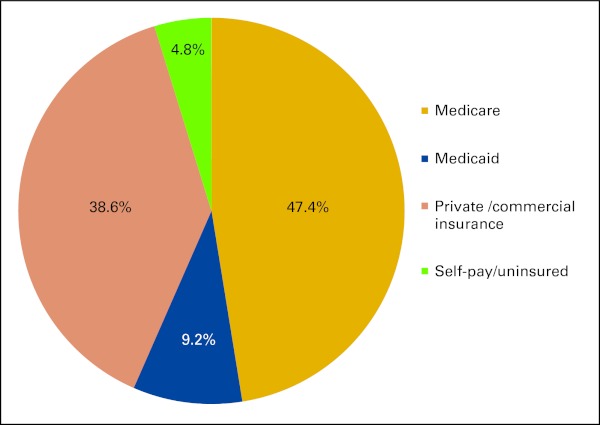
Payer mix information was requested from practices for major payer categories based on percentage of patients treated in the practice. Figure 7 shows the responses. The average percentage of patients reported to have Medicare coverage was 47.4%, nearly half of patients. A substantial yet smaller percentage (38.6%) was reported to have private, commercial insurance. On average, 9.2% of patients had Medicaid coverage. Finally, on average, practices reported 4.8% of their patients had no health care insurance.
Figure 7.
Practice patient insurance mix (n = 473 practices).
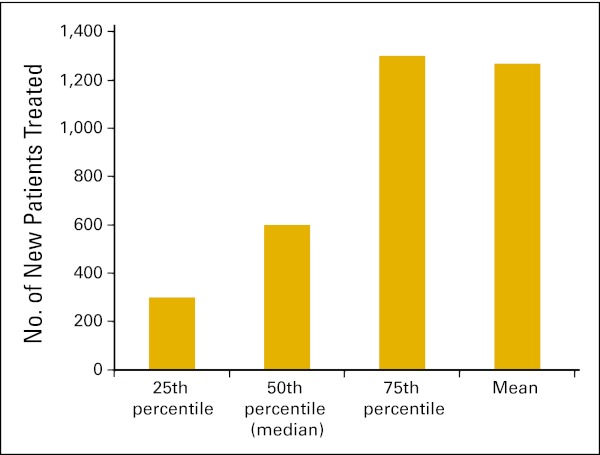
Respondents were asked to report the number of new patients their practices had treated in the past 12 months. The average number of new patients reported per practice was 1,268 (Fig 8).
Figure 8.
Average number of new patients treated in the past 12 months per practice (n = 449 practices).
Experiences During the Past 12 Months
The Census included a battery of questions asking respondents to report on experiences they had had over the past 12 months related to changes in the organizational structure of the practice, staff hiring and reductions, and salary increases and decreases. Table 3 lists those responses across a number of practice characteristics, including practice size, practice location, and practice location geography, as well as the results of statistical tests to determine whether the differences seen across the groups reached statistical significance.
Table 3.
Experiences in the Past 12 Months
| Experience | Practice Size (No. of physicians) |
Geographic Location |
Geography |
||||||||||||
|---|---|---|---|---|---|---|---|---|---|---|---|---|---|---|---|
| One to Two (n = 189; %) | Three to Six (n = 207; %) | ≥ Seven (n = 159; %) | χ2 | P | Northeast (n = 118; %) | North Central (n = 180; %) | South (n = 221; %) | West (n = 112; %) | χ2 | P | Metropolitan (n = 520; %) | Nonmetropolitan (n = 79; %) | χ2 | P | |
| Purchased another practice | 2.585 | .275 | 0.949 | .814 | 0.137 | .711 | |||||||||
| Yes | 1.2 | 1.7 | 3.8 | 1.1 | 3.0 | 2.1 | 2.2 | 2.2 | 1.5 | ||||||
| No | 98.8 | 98.3 | 96.2 | 98.9 | 97.0 | 97.9 | 97.8 | 97.8 | 98.5 | ||||||
| Merged with another practice | 7.882 | .019 | 2.942 | .401 | 4.256 | .039 | |||||||||
| Yes | 3.0 | 2.8 | 8.9 | 7.5 | 5.1 | 3.2 | 6.5 | 5.9 | 0.0 | ||||||
| No | 97.0 | 97.2 | 91.1 | 92.5 | 94.9 | 96.8 | 93.5 | 94.1 | 100.0 | ||||||
| Became affiliated with another entity | 0.923 | .630 | 2.503 | .475 | 0.634 | .426 | |||||||||
| Yes | 10.3 | 11.2 | 13.8 | 11.0 | 14.3 | 10.4 | 14.4 | 11.6 | 14.7 | ||||||
| No | 89.7 | 88.8 | 86.2 | 89.0 | 85.7 | 89.6 | 85.6 | 88.4 | 85.3 | ||||||
| Hired additional staff | 26.548 | < .001 | 11.518 | .009 | 0.440 | .507 | |||||||||
| Yes | 41.4 | 55.9 | 70.7 | 53.6 | 60.1 | 45.1 | 62.9 | 54.8 | 50.7 | ||||||
| No | 58.6 | 44.1 | 29.3 | 46.4 | 39.9 | 54.9 | 37.1 | 45.2 | 49.3 | ||||||
| Experienced staff layoffs | 0.856 | .652 | 7.746 | .052 | 1.010 | .315 | |||||||||
| Yes | 16.9 | 13.0 | 15.3 | 17.7 | 8.4 | 18.7 | 13.4 | 15.3 | 10.8 | ||||||
| No | 83.1 | 87.0 | 84.7 | 82.3 | 91.6 | 81.3 | 86.6 | 84.7 | 89.2 | ||||||
| Gave raises to staff | 12.936 | .002 | 1.160 | .762 | 0.039 | .844 | |||||||||
| Yes | 40.7 | 51.1 | 61.2 | 46.4 | 53.1 | 49.5 | 48.5 | 49.9 | 48.6 | ||||||
| No | 59.3 | 48.9 | 38.8 | 53.6 | 46.9 | 50.5 | 51.5 | 50.1 | 51.4 | ||||||
| Reduced staff salaries | 4.241 | .120 | 2.387 | .496 | 0.277 | .599 | |||||||||
| Yes | 8.6 | 3.7 | 5.0 | 8.2 | 4.1 | 4.6 | 6.2 | 5.5 | 4.0 | ||||||
| No | 91.4 | 96.3 | 95.0 | 91.8 | 95.9 | 95.4 | 93.8 | 94.5 | 96.0 | ||||||
Census responses indicated that having experienced a merger between practices, hiring additional staff, and experiencing staff pay increases were more likely to have happened as practice size increased. Hiring additional staff was related to practice location, with practices in the southern Census region the least likely to have experienced hiring additional staff over the past 12 months. Staff layoffs were also related to practice location, with practices in the north central Census region least likely to have experienced staff layoffs. Finally, practices in metropolitan locations were more likely than those in nonmetropolitan areas to have experienced mergers with other practices.
Anticipating Changes in the Next 12 Months
The Census also included a battery of questions asking respondents to forecast the likelihood of potential occurrences happening in the practices over the next 12 months. For each potential occurrence, respondents were asked to indicate the likelihood that the occurrence would happen in the next 12 months on a five-point likelihood scale, from very unlikely to very likely. Tables 4 to 6 list those responses across a number of practice characteristics, including practice size, practice location, and practice location geography, as well as the results of statistical tests to determine whether the differences seen across the groups reached statistical significance.
Table 4.
Anticipated Organizational Changes in the Next 12 Months
| Change | Practice Size (No. of physicians) |
Geographic Location |
Geography |
||||||||||||
|---|---|---|---|---|---|---|---|---|---|---|---|---|---|---|---|
| One to Two (n = 189; %) | Three to Six (n = 207; %) | ≥ Seven (n = 159; %) | χ2 | P | Northeast (n = 118; %) | North Central (n = 180; %) | South (n = 221; %) | West (n = 112; %) | χ2 | P | Metropolitan (n = 520; %) | Nonmetropolitan (n = 79; %) | χ2 | P | |
| Purchase another practice | 18.834 | .016 | 15.743 | .471 | 3.091 | .543 | |||||||||
| Very unlikely | 91.2 | 87.2 | 75.9 | 81.5 | 85.1 | 84.9 | 85.7 | 84.2 | 87.1 | ||||||
| Somewhat unlikely | 2.9 | 4.5 | 9.0 | 9.8 | 5.7 | 6.3 | 0.0 | 5.2 | 7.1 | ||||||
| Neither likely nor unlikely | 3.5 | 5.0 | 6.8 | 4.3 | 3.5 | 4.7 | 8.8 | 5.4 | 2.9 | ||||||
| Somewhat likely | 0.0 | 1.7 | 4.5 | 1.1 | 2.1 | 2.1 | 4.4 | 2.6 | 0.0 | ||||||
| Very likely | 2.4 | 1.7 | 3.8 | 3.3 | 3.5 | 2.1 | 1.1 | 2.6 | 2.9 | ||||||
| Merge with another practice | 5.021 | .755 | 20.522 | .198 | 0.786 | .940 | |||||||||
| Very unlikely | 67.1 | 72.1 | 72.2 | 64.1 | 69.5 | 74.0 | 70.3 | 69.2 | 70.0 | ||||||
| Somewhat unlikely | 8.8 | 8.9 | 6.8 | 9.8 | 10.6 | 7.3 | 4.4 | 8.2 | 10.0 | ||||||
| Neither likely nor unlikely | 12.4 | 6.7 | 9.8 | 9.8 | 10.6 | 6.8 | 11.0 | 9.4 | 10.0 | ||||||
| Somewhat likely | 6.5 | 8.4 | 6.0 | 8.7 | 5.7 | 6.8 | 11.0 | 8.2 | 5.7 | ||||||
| Very likely | 5.3 | 3.9 | 5.3 | 7.6 | 3.5 | 5.2 | 3.3 | 4.9 | 4.3 | ||||||
| Sell the practice | 13.317 | .101 | 28.752 | .026 | 6.959 | .138 | |||||||||
| Very unlikely | 71.8 | 78.1 | 83.5 | 77.2 | 72.9 | 80.2 | 75.8 | 75.5 | 78.6 | ||||||
| Somewhat unlikely | 5.9 | 9.0 | 6.0 | 7.6 | 8.6 | 4.7 | 9.9 | 8.3 | 2.9 | ||||||
| Neither likely nor unlikely | 8.8 | 7.3 | 4.5 | 7.6 | 9.3 | 4.7 | 7.7 | 7.5 | 5.7 | ||||||
| Somewhat likely | 7.6 | 3.4 | 4.5 | 4.3 | 4.3 | 7.3 | 2.2 | 5.4 | 4.3 | ||||||
| Very likely | 5.9 | 2.2 | 1.5 | 3.3 | 5.0 | 3.1 | 4.4 | 3.3 | 8.6 | ||||||
| Close the practice | 27.943 | < .001 | 50.413 | < .001 | 2.213 | .697 | |||||||||
| Very unlikely | 75.3 | 89.3 | 94.0 | 81.5 | 85.0 | 85.9 | 85.7 | 84.0 | 88.6 | ||||||
| Somewhat unlikely | 6.5 | 2.8 | 3.8 | 5.4 | 2.1 | 5.2 | 4.4 | 4.5 | 4.3 | ||||||
| Neither likely nor unlikely | 8.2 | 4.5 | 0.8 | 5.4 | 5.0 | 4.2 | 4.4 | 5.2 | 2.9 | ||||||
| Somewhat likely | 3.5 | 1.7 | 0.0 | 3.3 | 2.1 | 2.6 | 0.0 | 2.1 | 2.9 | ||||||
| Very likely | 6.5 | 1.7 | 1.5 | 4.3 | 5.7 | 2.1 | 5.5 | 4.2 | 1.4 | ||||||
Table 6.
Anticipated Salary Changes in the Next 12 Months
| Change | Practice Size (No. of physicians) |
Geographic Location |
Geography |
||||||||||||
|---|---|---|---|---|---|---|---|---|---|---|---|---|---|---|---|
| One to Two (n = 189; %) | Three to Six (n = 207; %) | ≥ Seven (n = 159; %) | χ2 | P | Northeast (n = 118; %) | North Central (n = 180; %) | South (n = 221; %) | West (n = 112; %) | χ2 | P | Metropolitan (n = 520; %) | Nonmetropolitan (n = 79; %) | χ2 | P | |
| Give raises to oncology physicians | 10.918 | .206 | 14.173 | .290 | 2.113 | .715 | |||||||||
| Very unlikely | 54.7 | 47.0 | 40.9 | 37.8 | 46.9 | 50.9 | 55.1 | 48.1 | 50.0 | ||||||
| Somewhat unlikely | 10.9 | 9.0 | 7.1 | 13.4 | 5.5 | 8.9 | 11.5 | 9.8 | 5.0 | ||||||
| Neither likely nor unlikely | 21.9 | 21.7 | 29.1 | 24.4 | 28.1 | 23.7 | 12.8 | 22.9 | 21.7 | ||||||
| Somewhat likely | 7.3 | 13.9 | 15.0 | 14.6 | 11.7 | 10.1 | 14.1 | 12.2 | 13.3 | ||||||
| Very likely | 5.1 | 8.4 | 7.9 | 9.8 | 7.8 | 6.5 | 6.4 | 6.9 | 10.0 | ||||||
| Give raises to oncology-certified nurses | 13.261 | .103 | 18.475 | .102 | 4.173 | .383 | |||||||||
| Very unlikely | 47.3 | 34.3 | 30.2 | 29.3 | 33.1 | 40.4 | 46.3 | 38.0 | 37.3 | ||||||
| Somewhat unlikely | 9.3 | 9.0 | 8.7 | 13.3 | 9.9 | 5.8 | 11.0 | 10.0 | 3.4 | ||||||
| Neither likely nor unlikely | 20.9 | 20.5 | 27.8 | 21.3 | 20.7 | 27.5 | 13.4 | 22.1 | 20.3 | ||||||
| Somewhat likely | 17.1 | 24.1 | 24.6 | 22.7 | 23.1 | 19.9 | 22.0 | 20.5 | 28.8 | ||||||
| Very likely | 5.4 | 12.0 | 8.7 | 13.3 | 13.2 | 6.4 | 7.3 | 9.4 | 10.2 | ||||||
| Reduce pay to oncology physicians | 3.427 | .905 | 20.992 | .050 | 5.101 | .277 | |||||||||
| Very unlikely | 73.1 | 67.3 | 70.8 | 65.4 | 68.0 | 72.5 | 70.4 | 67.9 | 82.0 | ||||||
| Somewhat unlikely | 4.8 | 9.7 | 7.7 | 13.6 | 6.3 | 5.6 | 6.2 | 7.0 | 3.3 | ||||||
| Neither likely nor unlikely | 9.0 | 9.7 | 10.0 | 6.2 | 11.7 | 10.1 | 8.6 | 10.6 | 6.6 | ||||||
| Somewhat likely | 6.2 | 7.3 | 5.4 | 13.6 | 3.9 | 6.2 | 7.4 | 7.5 | 4.9 | ||||||
| Very likely | 6.9 | 6.1 | 6.2 | 1.2 | 10.2 | 5.6 | 7.4 | 7.0 | 3.3 | ||||||
| Reduce pay to oncology certified nurses | 7.856 | .448 | 10.142 | .603 | 1.118 | .891 | |||||||||
| Very unlikely | 77.3 | 83.0 | 83.3 | 78.9 | 82.9 | 81.0 | 76.8 | 80.1 | 83.1 | ||||||
| Somewhat unlikely | 7.6 | 9.1 | 6.3 | 14.5 | 5.7 | 6.5 | 8.5 | 7.5 | 6.8 | ||||||
| Neither likely nor unlikely | 9.8 | 4.8 | 7.1 | 5.3 | 5.7 | 8.3 | 9.8 | 8.1 | 5.1 | ||||||
| Somewhat likely | 3.0 | 3.0 | 2.4 | 1.3 | 4.9 | 3.0 | 3.7 | 3.5 | 3.4 | ||||||
| Very likely | 2.3 | 0.0 | 0.8 | 0.0 | 0.8 | 1.2 | 1.2 | 0.8 | 1.7 | ||||||
Table 5.
Likelihood of Occurrence in the Next 12 Months
| Occurrence | Practice Size (No. of physicians) |
Geographic Location |
Geography |
||||||||||||
|---|---|---|---|---|---|---|---|---|---|---|---|---|---|---|---|
| One to Two (n = 189; %) | Three to Six (n = 207; %) | ≥ Seven (n = 159; %) | χ2 | P | Northeast (n = 118; %) | North Central (n = 180; %) | South (n = 221; %) | West (n = 112; %) | χ2 | P | Metropolitan (n = 520; %) | Nonmetropolitan (n = 79; %) | χ2 | P | |
| Hire additional oncology physicians | 43.139 | < .001 | 24.421 | .018 | 1.847 | .764 | |||||||||
| Very unlikely | 58.9 | 42.9 | 31.3 | 46.1 | 36.2 | 53.0 | 44.2 | 44.5 | 52.2 | ||||||
| Somewhat unlikely | 5.7 | 5.6 | 5.3 | 4.5 | 5.8 | 8.1 | 2.3 | 6.4 | 4.3 | ||||||
| Neither likely nor unlikely | 19.6 | 16.4 | 12.2 | 23.6 | 18.8 | 11.9 | 14.0 | 16.6 | 14.5 | ||||||
| Somewhat likely | 7.0 | 14.1 | 17.6 | 9.0 | 18.8 | 9.2 | 12.8 | 12.5 | 13.0 | ||||||
| Very likely | 8.9 | 20.9 | 33.6 | 16.9 | 20.3 | 17.8 | 26.7 | 20.0 | 15.9 | ||||||
| Hire additional oncology certified nurses | 34.204 | < .001 | 14.801 | .252 | 5.159 | .271 | |||||||||
| Very unlikely | 62.3 | 43.5 | 31.5 | 46.4 | 39.4 | 57.2 | 40.0 | 49.2 | 37.7 | ||||||
| Somewhat unlikely | 6.5 | 10.6 | 8.7 | 8.3 | 10.6 | 8.3 | 8.2 | 8.9 | 11.6 | ||||||
| Neither likely nor unlikely | 16.9 | 15.3 | 24.4 | 17.9 | 20.5 | 13.9 | 21.2 | 16.5 | 26.1 | ||||||
| Somewhat likely | 9.1 | 16.5 | 21.3 | 16.7 | 15.9 | 13.3 | 15.3 | 14.5 | 14.5 | ||||||
| Very likely | 5.2 | 14.1 | 14.2 | 10.7 | 13.6 | 7.2 | 15.3 | 10.9 | 10.1 | ||||||
| Lay off oncology physicians | 16.268 | .039 | 12.153 | .433 | 2.510 | .643 | |||||||||
| Very unlikely | 89.4 | 92.0 | 90.6 | 87.0 | 92.2 | 91.4 | 89.0 | 89.7 | 95.2 | ||||||
| Somewhat unlikely | 0.8 | 2.9 | 3.9 | 6.5 | 2.3 | 1.7 | 1.2 | 2.6 | 1.6 | ||||||
| Neither likely nor unlikely | 5.3 | 3.4 | 3.9 | 5.2 | 3.1 | 3.4 | 6.1 | 4.7 | 1.6 | ||||||
| Somewhat likely | 0.0 | 1.7 | 0.8 | 1.3 | 0.8 | 1.7 | 0.0 | 1.3 | 0.0 | ||||||
| Very likely | 4.5 | 0.0 | 0.8 | 0.0 | 1.6 | 1.7 | 3.7 | 1.6 | 1.6 | ||||||
| Lay off oncology-certified nurses | 21.306 | .019 | 14.477 | .490 | 5.649 | .342 | |||||||||
| Very unlikely | 77.0 | 86.1 | 85.7 | 82.2 | 82.4 | 82.7 | 85.5 | 83.6 | 81.7 | ||||||
| Somewhat unlikely | 9.5 | 6.6 | 7.9 | 6.8 | 8.8 | 8.6 | 6.0 | 6.3 | 13.3 | ||||||
| Neither likely nor unlikely | 8.7 | 3.6 | 4.0 | 8.2 | 6.4 | 3.1 | 6.0 | 6.0 | 3.3 | ||||||
| Somewhat likely | 2.4 | 3.0 | 1.6 | 2.7 | 1.6 | 3.7 | 1.2 | 2.7 | 1.7 | ||||||
| Very likely | 2.4 | 0.6 | 0.8 | 0.0 | 0.8 | 1.9 | 1.2 | 1.4 | 0.0 | ||||||
Census responses indicated that the likelihood of reporting the purchasing of another practice and the closing of the practice in the next 12 months was related to practice size. Larger practices reported greater likelihood of purchasing other practices in the next 12 months. Smaller practices reported greater likelihood of closing their practices in the next 12 months. Geographic location was also related to differences in the reported likelihood of closing and selling practices.
Practice size was also related to differences in the reported likelihood of making staffing changes. Smaller practices reported greater likelihood of laying off oncology physicians and oncology-certified nurses, whereas larger practices reported greater likelihood of hiring oncology physicians and oncology-certified nurses in the next 12 months. Geographic location was related to differences in the reported likelihood of hiring oncology physicians, with practices in the north central and western Census regions reporting greater likelihood of hiring oncology physicians in the next 12 months.
Discussion
Obtaining a complete census of oncology practices and related trends is crucial to understanding how national policy will affect practices across the full range of settings. As the initial effort, the ASCO National Census of Oncology Practices collected valuable information from a substantial number of oncology practices across the United States. Although this is an unprecedented achievement, there are several limitations to generalizing the information presented here. These include geographic differences in response patterns, low response rates from specific types of practices, and an overall low response rate that may relate to the difficulty of extracting information needed to answer the questions. Until there is reasonable assurance of a representative sample of respondents, it will be difficult for ASCO to use such data to develop strategy around practice management, workforce analysis, and provider reimbursement. The Census survey will be an ongoing effort with planned reporting on an annual basis. As such, the methodology can be refined to enhance the ability of ASCO to identify trends in the numbers and characteristics of oncology practices in the United States; how they are structured in terms of ownership model and affiliation with other groups, facilities, and entities; the kinds of services provided; their use of different types of providers and staff; practice volume; and characteristics of patients. These insights will have a major impact on how ASCO advocates for its members.
Accurate practice data and trend analysis can also support development of practice benchmarks to help individual practices and networks make important business and practice decisions in a more informed way. Census information can be presented across a number of contexts to maximize its analytic utility. For example, in this article, we have presented some of the findings across geographic location, geographic type, and practice size. In the future, these data could also be analyzed across practice ownership type, key staffing features (eg, use of nonphysician clinicians), patient mix, recent changes in staffing, and so on. These analyses and others will help practices better adapt to their own individual challenges by providing robust information about the practice environment and how others are adapting to it.
As noted, several large, integrated practice networks were reluctant to participate in the Census. Moreover, the representation of academic practices was also questionable. Finally, the low participation rate on the whole increases the likelihood of bias in terms of both quality and magnitude. Two examples illustrate the potential biases in the data collected to date. First, the practices that have responded demonstrate a higher penetration of EHR/EMR use than expected compared with previous reports.2 Second, more than half of the practices that responded reported not providing chemotherapy services at their practice site, a finding that is problematic on its face. Given these and other findings, we have appropriately labeled the information presented in this article as preliminary. We hope that as the Census becomes a more visible ASCO activity through word of mouth, published reports and summary briefings that use the data, and continued promotion, practices will be more inclined to participate.
ASCO will continue to maintain and promote the Census. The Census team is currently reviewing the effort to date to determine where improvements can be made. ASCO is compiling the feedback we have received and will use it to inform future iterations. Be on the lookout for more information from the Census and about how to participate. We wish to thank all of the practices that participated in the initial Census effort.
Acknowledgment
The authors wish to acknowledge the members of the American Society of Clinical Oncology (ASCO) Clinical Practice Committee and oncology practices who provided their time and insights during the development and pilot-testing phase of the Census. Additionally, the authors wish to acknowledge the numerous ASCO volunteers who aided in the Census outreach effort.
Authors' Disclosures of Potential Conflicts of Interest
Although all authors completed the disclosure declaration, the following author(s) and/or an author's immediate family member(s) indicated a financial or other interest that is relevant to the subject matter under consideration in this article. Certain relationships marked with a “U” are those for which no compensation was received; those relationships marked with a “C” were compensated. For a detailed description of the disclosure categories, or for more information about ASCO's conflict of interest policy, please refer to the Author Disclosure Declaration and the Disclosures of Potential Conflicts of Interest section in Information for Contributors.
Employment or Leadership Position: Amy Hanley, American Society of Clinical Oncology (C); Karen Hagerty, American Society of Clinical Oncology (C) Consultant or Advisory Role: Gaetano J. Forte, American Society of Clinical Oncology (C) Stock Ownership: None Honoraria: None Research Funding: None Expert Testimony: None Other Remuneration: None
Author Contributions
Conception and design: Gaetano J. Forte, Amy Hanley, Anupama Kurup, Michael N. Neuss, Therese M. Mulvey
Administrative support: Gaetano J. Forte, Amy Hanley, Karen Hagerty
Provision of study materials or patients: Gaetano J. Forte
Collection and assembly of data: Gaetano J. Forte
Data analysis and interpretation: Gaetano J. Forte, Amy Hanley
Manuscript writing: All authors
Final approval of manuscript: All authors
References
- 1.Erikson C, Salsberg E, Forte G, et al. The supply and demand for oncologists: Challenges to assuring access to oncology services. J Oncol Pract. 2007;3:79–86. doi: 10.1200/JOP.0723601. [DOI] [PMC free article] [PubMed] [Google Scholar]
- 2.Barr TR, Towle EL. National practice benchmark, 2011 report on 2010 data. J Oncol Pract. 2011;7(suppl):67s–82s. doi: 10.1200/JOP.2011.000402. [DOI] [PubMed] [Google Scholar]


