

Abstract
The genetic diversity of Yersinia pestis, the etiologic agent of plague, is extremely limited because of its recent origin coupled with a slow clock rate. Here we identified 2,326 SNPs from 133 genomes of Y. pestis strains that were isolated in China and elsewhere. These SNPs define the genealogy of Y. pestis since its most recent common ancestor. All but 28 of these SNPs represented mutations that happened only once within the genealogy, and they were distributed essentially at random among individual genes. Only seven genes contained a significant excess of nonsynonymous SNP, suggesting that the fixation of SNPs mainly arises via neutral processes, such as genetic drift, rather than Darwinian selection. However, the rate of fixation varies dramatically over the genealogy: the number of SNPs accumulated by different lineages was highly variable and the genealogy contains multiple polytomies, one of which resulted in four branches near the time of the Black Death. We suggest that demographic changes can affect the speed of evolution in epidemic pathogens even in the absence of natural selection, and hypothesize that neutral SNPs are fixed rapidly during intermittent epidemics and outbreaks.
Keywords: infectious disease, molecular clock, phylogenomics, NGS, molecular epidemiology
Plague caused by Yersinia pestis has claimed millions of human lives as recently as the 20th century, and sylvatic plague remains enzootic (endemic) in multiple rodent foci around the world (1, 2). These Gram-negative bacteria can be transmitted from rodents to humans and animals by fleabites, physical contact, or respiratory droplets, and human infection is usually lethal in the absence of antibiotic treatment.
In 1894, microbiologists identified Y. pestis as the cause of modern plague (3). They also attributed historical pandemics of plague to this bacterium, including the Black Death (4), which reached Europe in 1347, and the Justinianic Pandemic (5), which began in 541. This interpretation has been questioned by historians and epidemiologists because the Black Death differed in epidemiology and symptoms from modern plague at the beginning of the 20th century (6–8). Furthermore, the hosts (rats) and vectors (fleas, Xenopsyllis cheopsis) that are currently associated with efficient transmission of bubonic plague were rare or absent in Europe during the Black Death (8). However, Y. pestis DNA and antigens were detected in Black Death skeletons by multiple groups (9, 10) and sequences of Y. pestis genomes have been reconstructed from ancient DNA in skeletons that were buried in London in 1348–1349, soon after the Black Death reached Europe (11).
Y. pestis evolves clonally and has only very limited genetic diversity (12). Phylogeographic analysis of a global collection of isolates showed that these bacteria have spread repeatedly from China (13), and that the Black Death genotypes map to the base of phylogenetic branch 1 (9, 11). However, multiple questions remain unresolved, including whether plague spread globally during or after the Black Death, and whether the Justinianic Pandemic was caused by Y. pestis (11).
Here we describe the genomic sequences of >100 Y. pestis strains from China and East Asia. Our results show that the medieval spread of plague coincided with a “big bang” in Y. pestis diversity, during which several extant lineages arose within a short time period. We conclude that sequence evolution is largely neutral and mutations have accumulated at a very uneven pace, possibly because of the alternation of endemic and epidemic periods. Finally, we show that Y. pestis lineages that can infect humans already existed by the time of the Justinianic Pandemic.
Results
Core-Genome and Pan-Genome of Y. pestis.
We sequenced 118 genomes of isolates from China, Mongolia, the former Soviet Union, Myanmar, and Madagascar using Illumina short-read sequencing (Dataset S1). The 107 Chinese isolates represent the diversity revealed by molecular genotyping of > 900 strains (14, 15), which in turn reflect the geographic and temporal diversity of > 5,000 isolates collected during annual surveillance of all sylvatic plague foci in China. Thus, these genomes should provide a good representation of the geographic and genetic diversity of Y. pestis in China. Of the 118 genomes, 103 are from a variety of rodent genera and other nonprimate mammals, 14 are from human patients, and 1 is from a human flea (Dataset S1).
The sequence reads were assembled into genomes with SOAPdenovo (16), resulting in an average coverage per genome of 61-fold and an average genome assembly size of 4.6 Mb (Dataset S2). A pan-genome was created from all genomes, and reads containing putative SNPs relative to the pan-genome were filtered to exclude potential sequencing errors. We tested the reliability of these procedures by comparing the results for two strains, the genomes of which had previously been independently sequenced with traditional Sanger sequencing (17). The two genomes differed at positions 129314 and 1559993 for strain K11973002, whereas the two genomes of strain E1979001 were indistinguishable. Sequencing of PCR products showed that the two differences in K11973002 represented sequencing errors in the Sanger genome.
We also analyzed 15 other, previously published genomes of Y. pestis (Dataset S1), for a total of 133 genomic sequences. The Y. pestis core-genome, consisting of segments present in all 133 genomes, is 3.53-Mb long, subdivided into 990 genomic blocks because most assemblies contain multiple contigs (Datasets S2 and S3). This genome contains 3,450 annotated genes spanning 3.03 Mb. Our comparisons further identified 1.92 Mb (1,700 annotated genes spanning 1.16 Mb) that were variably present in some isolates (Dataset S4), of which 421 kb were assigned to six previously known plasmids (SI Appendix, Table S1). The Y. pestis pan-genome (core-genome plus accessory genome) is 5.46 Mb in length (SI Appendix, Fig. S1 and Table S1).
Y. pestis Lineages in Relation to Geography and Host.
Previously (13, 18, 19) we interpreted the population structure of Y. pestis as a clonal lineage with three branches, designated 0, 1, and 2, which evolved from Yersinia pseudotuberculosis 2,600–28,000 y ago. According to this interpretation, the Y. pestis genealogy is rooted by Y. pseudotuberculosis at the base of branch 0, and SNPs have accumulated serially along branch 0 and subsequently along branches 1 and 2. All Y. pestis isolates, including the genomes analyzed here, cluster within one multilocus sequence type that is embedded within the Y. pseudotuberculosis population structure (20). These observations show that Y. pestis is a genetically monomorphic clone of Y. pseudotuberculosis, which has greater diversity. A highly robust maximum-likelihood (ML) tree of the 133 genomes of Y. pestis plus four published genomes of Y. pseudotuberculosis confirmed that Y. pseudotuberculosis is a suitable outgroup for defining the order of sequential mutations during the genealogy of Y. pestis, and that the most recent common ancestor (MRCA) of all sampled isolates of Y. pestis is at the base of branch 0 (SI Appendix, Fig. S2). The four Y. pseudotuberculosis genomes share the same nucleotide for all SNPs within Y. pestis, which defines the ancestral state. Almost all core SNPs within the genealogy of Y. pestis correspond to substitutions that have occurred only once, and thus define a unique, fully parsimonious path of changes. The core-genome of Y. pestis contains 2,298 such SNPs (Dataset S5), which were used to generate a rooted minimum spanning tree (MSTree) based on sequential changes since the MRCA (Fig. 1A and SI Appendix, Fig. S3).The MSTree and ML tree are fully concordant (SI Appendix, Fig. S4). Twenty-eight other SNPs were excluded from these analyses because they are homoplasies (repeated identical mutations in independent branches) (SI Appendix, Table S2).
Fig. 1.
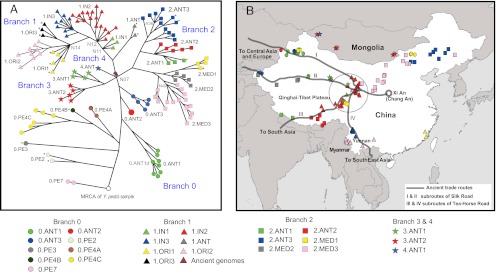
Population structure of Y. pestis revealed by core genome SNP analysis. (A) MSTree of 133 Y. pestis genomes based on 2, 298 SNPs, with Y. pseudotuberculosis IP 32953 as the outgroup to the MRCA. Branch lengths are logarithm transformed for visual effects (see SI Appendix, Fig. S3A for the untransformed tree). Branches are indicated by distinct symbol shapes and populations within branches are distinguished by colors. Symbols with an asterisk are publicly available genomes, not included in B. (B) Geographic sources of strains sequenced in this study. Ancient trade routes are illustrated by gray lines. The circled area is the Qinghai-Tibet Plateau, which encompasses the most diverse isolates and may be the original source of Y. pestis.
This comparative analysis of a large number of genomes revealed additional genealogical substructure. The genealogy now includes branches 3 and 4, which split from branch 0 concurrently with branches 1 and 2 in an extensive “big bang” polytomy at the junction designated node N07 (Fig. 1A and SI Appendix, Fig. S3B). The Black Death sequences that were defined by ancient DNA studies (9, 11) are also very close to this polytomy. The sequences are located on branch 1, one SNP and three SNPs after it diverged from node N07 (Fig. 1A). Two other SNPs identified by Bos et al. (11) were ignored in our genealogical analyses because they are located in repetitive segments.
We previously concluded that plague spread on multiple occasions from China or its vicinity (13). Our new data support this hypothesis because the deepest branching lineage of the genealogy, 0.PE7, has only been isolated in China. In contrast, isolates from the former Soviet Union belong to lineages (0.PE2 and 0.PE4B) that evolved more recently. The Y. pestis strains from China cluster geographically (MANOVA: Pillai-Bartlett trace = 1.75, P < 2.2 × 10⁻¹⁶), but also cluster by host genera (nonparametric χ2 test, 999 permutations: χ2 = 64.61, P = 0.001) (SI Appendix, Fig. S5). Because these two factors are largely confounded statistically, we were unable to evaluate the relative importance of geography and ecology in shaping the population structuring of Y. pestis in China. However, we note that the deepest branching lineage of the genealogy, 0.PE7, has only been isolated in the Qinghai-Tibet Plateau in China, and that most isolates from western and southern China were located near ancient trade routes designated as the “Silk” and “Tea-Horse” Roads, which crossed in the Qinghai-Tibet Plateau (Fig. 1B). These observations suggest that plague may have originated in or near the Qinghai-Tibet Plateau and was transmitted between rodent populations by human travel along the ancient trade routes.
Our data also show that most Y. pestis lineages are capable of causing human plague. Although we focused on Y. pestis from Chinese sylvatic foci in this study, 1,500 cases of human plague have been reported in China since 1955 (21). Our collection included 14 strains from human patients and one from a human flea. These 15 genomes included four on branch 0, as well as 11 others on branches 1, 2, and 3 (SI Appendix, Fig. S5B). One isolate from human bubonic plague lies on the deepest branch, 0.PE7, and the isolate from a human flea was found in the 0.ANT1 clade. Even though biovar Microtus (0.PE4C) is not associated with human disease (22, 23), the deepest branch within 0.PE4, 0.PE4A, includes two isolates from human disease. These observations thus show that the potential to cause human disease has probably been present since Y. pestis first evolved, and all known lineages can potentially cause plague, except 0.PE4C. Contrary to the conclusions of Bos et al. (11), neither the Black Death nor the polytomy at N07 were associated with a sudden acquisition of the potential to cause human disease.
Overdispersion of Branch Lengths in Y. pestis.
According to the expectations of a constant molecular clock, the core-genome of all modern strains should be approximately equidistant from the MRCA. However, this was not the case, as the number of SNPs to the MRCA varied between 96 (0.PE7) and 548 (0.PE3). Even after excluding these two extremes, the number ranged from 183 to 320 (SI Appendix, Fig. S3A and Dataset S1). Similarly, the number of SNPs accumulated since the polytomy at N07 by individual genomes on branch 1 ranged from 27 (1.IN1a) to 100 (1.ANTb). A constant molecular clock predicts a Poisson distribution of the root-to-tip distances, which results in similar values for the mean and the variance of the number of SNPs. However, in the Y. pestis phylogeny, the variance [1,575; 99% confidence interval (CI): 456, 3,970] of the number of SNPs accumulated from root to tips was much higher than the mean (248; 99% CI: 239, 257), using quantiles of the distributions obtained by bootstrapping root-to-tip distances to calculate 99% CIs. Strong heterogeneity in branch length from the MRCA was also apparent in the ML tree (SI Appendix, Fig. S2).
Overdispersion of branch lengths can occur when mutations accumulate progressively over the time period of sampling, as observed with H1N1 influenza virus (24) and methicillin-resistant Staphylococcus aureus (25, 26). However, both these organisms evolve very rapidly and have far more recent MRCAs than Y. pestis. As such, a substantial proportion of their diversity arose during the time covered by the sampling period. In contrast, the period during which the Y. pestis isolates were collected represents only a small fraction of the time during which they diversified from their MRCA, and the branch lengths to the MRCA for individual strains of Y. pestis were uncorrelated to their year of isolation (R2 = 0.01) (SI Appendix, Fig. S6).
Variable Clock Rate.
An alternative explanation for overdispersion in root-to-tip distance is that the substitution rate varies across lineages. We performed an analysis using the Bayesian relaxed-clock model in BEAST (27–30) on all genomes (SI Appendix), including the ancient DNAs, but excluding Angola (0.PE3), which prevented the analysis from converging. The analysis was performed with the known dates of isolation of the bacterial strains, using 1348 as the date for the ancient DNAs and based on a lognormal distribution of clock rate. This analysis indicated that the genealogy has indeed undergone substantial rate variation, with a nearly 40-fold difference between the slowest and the fastest evolving branches (Fig. 2 and SI Appendix, Fig. S7). Comparable calculations using a strict clock model, where rates were constant across the tree, yielded log10 marginal likelihoods of 109.6 with the Bayes Factor approach implemented in Tracer, which provides overwhelming support for a relaxed clock (27).
Fig. 2.

A maximum clade credibility tree of the core genomes of Y. pestis. The tree was estimated using the uncorrelated lognormal relaxed model in BEAST (27) with core-genomes. Angola (0.PE3) was excluded from this estimation because its anomalously fast rate could not be fitted by the lognormal model. Two sources of temporal information were used to date the tree. First, the two Black Death genomes were placed at 1348, the date of burial of the skeletons. Second, we constrained the mean of the lognormal distribution of rates to 1 × 10⁻⁸ substitutions per site per year (13). Estimates using these two parameters alone provided consistent dates, but with wider credibility intervals. Branch lengths are scaled to years. Branch colors indicate the estimated branch substitution rate on the logarithmic scale shown in the Rate Key at the left. Population designations are as in Dataset S1.
According to our calculations, rate accelerations and decelerations are interspersed in the tree, with the two fastest rates occurring at the big-bang polytomy at N07 and within 1.ORI, which was responsible for the global spread in 1894 of all three waves of the third pandemic (13). The date estimations indicate that 1.ORI evolved early in the 19th century, several decades before epidemic disease manifested within China, and that the polytomy at N07 preceded the Black Death by about 80 y (Table 1). The MRCA of all modern isolates of Y. pestis was calculated as 1322 BC (95% CI: 4394 BC to 510 AD). The nodes flanking Angola were estimated to have originated several centuries before the Justinianic Pandemic of 541 AD, with 95% CIs that overlap the beginning of that pandemic. Our dating estimates now cast doubt on our previous proposal that major voyages from China to Africa at the beginning of the 14th century brought 1.ANT to East Africa because those voyages predated the age of 1.ANT (1499 AD; 95% CI: 1377–1650) (Table 1 and SI Appendix, Fig. S8).
Table 1.
Date estimation of nodes potentially associated with pandemic plagues
| Clade | Median date (95% CI) |
| 1.ORI | 1808 AD (1735, 1863) |
| 1.ANT vs. branch 1 | 1499 AD (1377, 1650) |
| Ancient genomes | 1346 AD (1312, 1353) |
| Polytomy N07 | 1268 AD (1142, 1339) |
| N03, Descendent node of Angola (0.PE3) | 68 AD (932 BC – 806 AD) |
| N01, Parent node of Angola (0.PE3) | 816 BC (2775 BC – 590 AD) |
| MRCA | 1322 BC (4394 BC – 510 AD) |
The genome of strain Angola (0.PE3) was not included in the BEAST analysis because of its excessive length; the table lists the estimaged ages of the flanking nodes in the genealogy, N01 and N03 (SI Appendix, Fig. S3).
Internal Nodes and Multiple Polytomies.
As clock rates were highly variable across the phylogeny, we investigated whether variation in branch length was correlated with features of the tree topology. Interestingly, we observed a strong positive correlation between the number of nodes and the number of SNPs from each genome to the MRCA of the genealogy (R2 = 0.56) (Fig. 3A), indicating that lineages with higher mutation rates tend to have experienced more branching events over time. The relationship between SNPs and nodes can be biased by pseudoreplication, because the numbers of nodes and SNPs to the MRCA of the phylogeny largely overlap for closely related isolates. To circumvent this issue, we repeated this analysis with increasingly smaller random subsets of isolates (from 90 to 10% of the original dataset) and with 1,000 replicates for each dataset size. As expected, the range of R2 was larger in small datasets. However, the relationship between nodes and SNPs to the MRCA remained remarkably robust, with median R2 values ranging from 0.5 to 0.6 (Fig. 3B). A similar relationship between nodes and SNPs, the “node-density effect” (31), can arise under limited sampling of taxa with repeated forward and back mutations, because of mutation saturation in undersampled areas of a genealogy. However, homoplasies are rare in Y. pestis, which excludes mutation saturation. Thus, despite the variable mutation rate, SNPs are a good indication of branching events, and epidemics that have resulted in more SNPs are also associated with more historical branches. We note, however, that this may reflect an indirect correlation, because lineages that have experienced more epidemics have been more successful, and might therefore represent a greater proportion of our sample. In turn, isolates from clades that are more common in the dataset are also expected to be characterized by higher numbers of nodes from root to tip.
Fig. 3.

Linear correlation between SNPs and nodes to the MRCA. (A) Relationship between number of nodes and SNPs to the MRCA. The black line corresponds to a linear regression based on the points indicated by black dots. Open circles represent isolates with three or fewer nodes, which were excluded from the analysis because they belong to poorly sampled clades in the phylogeny. (B) Correlation between SNPs and nodes to the MRCA after randomly removing individual isolates in addition to the outliers. Variable proportions of isolates were randomly selected to construct ML trees based on SNPs, from which the coefficient of determination (R2) with nodes to the MRCA was calculated. Each box is based on 1,000 replicates.
A remarkable feature of our genealogy of Y. pestis is the presence of multiple polytomies, including the big-bang polytomy at node N07. Some of these nodes are the ancestors of populations that have only been identified in China (0.ANT1, 1.IN1, 1.IN2, 2.ANT3, and 2.MED3) but the basal node of 1.ORI (N14), the cause of the third pandemic, also represents a polytomy (Fig. 1 and SI Appendix, Fig. S3B). Thus, radial expansions (starburst genealogies) have occurred in Y. pestis on multiple occasions, interspersed with the binary branching structure that is otherwise normally associated with clonal diversification. As starburst genealogies are often interpreted as signatures for rapid expansions, it is tempting to speculate that each polytomy corresponds to an ancient plague epidemic. In this respect, the association between faster clock rates and branching events is particularly interesting, as it would suggests that lineages responsible for more epidemics might also accumulate genetic diversity more quickly.
Drivers of Molecular Clock Rate Variation in Y. pestis.
What are the causes behind the strong clock rate variation?
Mutations accumulate rapidly among “mutator” strains with elevated spontaneous mutation rates (32). However, Angola in 0.PE3, the strain whose genome had the most SNPs, is not a mutator (33), nor did any of the genomes contain traces of the epistatic mutations that can result in reversion of a transient mutator to wild-type. Furthermore, only one mutator was identified among 294 Y. pestis strains from global sources (13). Thus, transient mutators are unlikely to have caused the numerous rate accelerations and decelerations we observed throughout the Y. pestis phylogeny.
An alternative explanation would be numerous events of diversifying (natural) selection leading to the rapid fixation of favorable mutations, possibly coinciding with the spatial expansion of Y. pestis and host jumps to new host species. However, we found only limited evidence in the genomes for the effects of past natural selection having driven the rate of evolution of Y. pestis. The ratio of nonsynonymous to synonymous mutation rates (dN/dS) is 0.91 for all 2,298 SNPs; ranging from 0.79 to 1.37 for all nodes in the MSTree (Dataset S6). The near-parity dN/dS ratios are consistent with neutral evolution, and provide no obvious signs for diversifying selection at the genome level. However, dN/dS ratios are insensitive to a mixture of diversifying and purifying selection, and we thus considered other typical signatures of diversifying selection.
Diversifying selection might have resulted in frequent homoplasies, as has been observed for mutations to antibiotic resistance (34) and resistance to antivirals (35), but only 28 SNPs were homoplastic in the 133 genomes (SI Appendix, Table S2). Diversifying selection is also frequently hallmarked by genes with multiple, clustered nonsynonymous SNPs (nsSNPs). The distribution of the number of nsSNPs per gene deviated significantly from theoretical expectations under neutral evolution (Fig. 4A) (parametric and nonparametric χ2obs tests: χ2obs = 3,582, pparam = 4.2 × 10⁻²¹; pnonparam = 9.9 × 10⁻⁴), but this deviation was largely associated with only seven outlier genes (including two with homoplasies) that exhibited an excess of nsSNPs (Fig. 4 B and C). Only two of the 3,450 core genes displayed both homoplasies and excess nsSNPs (YPO0348 and YPO2210) and 20 others contained only one of these typical signatures of diversifying selection (SI Appendix, Table S3). Those 22 genes did not possess obvious unifying features, except that one (YPO0348) is thought to be important for the virulence of Y. pestis (36) and two are related to motility. Thus, our analyses provided little evidence for widespread natural selection having shaped the genomic diversity in Y. pestis, and natural selection cannot explain the extensive variation in substitution rate.
Fig. 4.

Identification of genes with unexpected numbers of nsSNPs. (A) Parametric and nonparametric χ2 goodness-of-fit test of the expected number of nsSNPs per gene. The observed χ2 (red arrow) is distinct from both the parametric distribution (black line) and the simulated distribution (blue histograms). (B) Contribution of each gene to the deviation from the expected number of nsSNPs. The bar plot shows the percentage contribution of each gene to the χ2 goodness-of-fit statistic, ordered by decreasing contribution. The entire distribution is shown in the inset, and the main figure shows the 30 genes with the highest contributions. Gene lengths are indicated by colors. The arrow differentiates outliers (left of the arrow) from other genes. (C) Numbers of nsSNPs per gene as a function of gene length. Each circle represents a gene, the symbol size of which is proportional to the deviation from theoretical expectations (as measured by a χ2 statistic). Confidence intervals of the theoretical expectations are represented in shades of blue for different α-thresholds (0.05, 0.01, 0.001). Red symbols indicate genes identified as outliers. The inner white line indicates the mean expectation.
We now consider a third possibility, namely that clock rate variation is simply the result of different bacterial replication rates between epidemic spread versus latent endemic disease. Sylvatic plagues consist of alternate cycles of enzootic disease, in which Y. pestis is rare in both fleas and hosts, and epizootic disease, in which it is common (1). During the enzootic phase, Y. pestis can survive for long periods in a dormant state, the basis of which is still poorly understood (37). In contrast, during a typical epizootic rodent-flea cycle, infected rodents suffer from intense bacteremia with >107 CFU/mL of blood, which is essential for transmission because the flea blood meal is so small and transmission by fleas is so inefficient (38, 39). Human epidemics result from epizootic plague in an intermediate host, such as rats, whose fleas then transmit Y. pestis to humans, and back to the rodents who are the maintenance hosts for future evolution. The mutational clock rate is constant in the epizootic phase, at least for microsatellite loci (40), similar to the rate measured in laboratory serial transfer experiments, but data are lacking on clock rates in enzootic plague. The same is true of human epidemics, except that SNPs can be fixed at exceptionally high rates during transmission to new geographic areas (13). However, based on their epidemiological differences, epidemics and epizootics should be associated with much higher rates of bacterial replication per unit time than are typical during the long periods of intervening enzootic disease, even if the mutation rate per bacterial replication cycle is constant. Such periods of rapid replication are expected to result in faster observed clock rates per unit time, even in the absence of natural selection.
A similar “generation-time effect” has been proposed for higher taxa, wherein species with more generations per unit time accumulate more mutations than species with longer generation times (41). However, for Y. pestis, this hypothesis indicates that lineages, which have been associated with more epidemic disease, should have higher clock rates, and conversely that higher clock rates are an indicator for an association with epidemic disease, even in the absence of historical evidence.
Discussion
Many genomic comparisons of multiple isolates within a bacterial species have focused on the diversity of gene content. In some bacteria with extensive HGT, such as Escherichia coli and Streptococcus agalactiae, the pan-genome is open-ended, and its size grows continuously with the number of sequenced genomes (42, 43). For asexual bacteria, such as Salmonella enterica serovar Typhi (44), clones of S. aureus (25, 26), and the endosymbiont Buchnera (45), the genome is closed and any acquisition of foreign genes seems to be largely restricted to bacteriophages and plasmids. The pan-genome of Y. pestis is also closed, with a size only slightly larger than the average size of the sequenced genomes (SI Appendix, Fig. S1). Most of the accessory genome is variable in its parental species, Y. pseudotuberculosis, and the only genomic island which might have been acquired after the earliest nodes in the genealogy is a filamentous bacteriophage (46). In contrast, the polymorphic nucleotides in the core genome provide an unambiguous record of a clonal genealogy, allowing analyses of changes that might be associated with historical epidemics and pandemics.
This genealogical clock ticks at a strikingly variable rate, as demonstrated by variable substitution rates and branching events along individual branches of the genealogy. These rates resulted in great heterogeneity in the number of SNPs that modern genomes and ancient DNA have accumulated since the MRCA, and multiple polytomies that probably reflect bursts of fixed mutation that occurred over brief periods. We provide evidence that these variations do not reflect either mutators or diversifying selection and propose that the number of mutations per unit time varies with transmission history: epidemics result in more replication cycles and more SNPs than enzootic phases. This interpretation is supported by an extensive polytomy that gave rise to branches 1 through 4 shortly before the Black Death, and a second polytomy that gave rise to 1.ORI shortly before its global spread from Hong Kong in 1894 resulted in the third pandemic. We also infer the possible occurrence of historically undocumented epidemics in China because multiple other such polytomies and branch-specific high clock rates were observed for populations of Y. pestis that have only been isolated in China or Mongolia until now. Finally, we raise the possibility that strain Angola (0.PE3) might have been associated with the Justinianic Pandemic spread from Africa to all of Europe.
The Angola genome contains an extraordinarily high number of SNPs (SI Appendix, Fig. S3), which according to our interpretation might have arisen during the two centuries of epidemic waves in Europe and Africa that were associated with the Justinianic Pandemic. The age of Angola is also compatible with this interpretation: the 95% CIs of our estimates for the ages of the nodes that flank Angola in the genealogy overlap with the beginning of that pandemic in 541 (Table 1). Although the causative agent of the Justinianic Pandemic is still uncertain, the successful amplification of Y. pestis specific genes from skeletons from the fifth to seventh centuries has been reported by two independent groups (47–49), whereas the biovar or genotype designations of these strains are unknown (50). Our dating implies that multiple extant Y. pestis lineages that were capable of causing human disease likely existed at that time, including the ancestors of Angola.
Similar demographic effects are expected to be true for other epidemic pathogens, especially for zoonotic diseases with similar lifestyles, such as Bacillus anthracis and Francisella tularensis (51). Variable mutation rates have also been reported for S. enterica serovar Montevideo, which was associated with a recent food-born outbreak (52). However, we note that although a demographic explanation may explain the observed patterns, we cannot exclude alternative scenarios, such as host density changes driven by climatic factors (53, 54), which will also change the number of bacterial replication cycles.
Many of our conclusions were only possible because our sampling was so extensive. An analysis of fewer genomes, or many genomes from a more restricted geographical source, might have lacked the statistical power to demonstrate the extensive rate variation and the multiple polytomies we describe here. We anticipate that our data will enrich the understanding of evolutionary mechanisms in pathogens alternating between endemic and epidemic demographies. The genomic data presented in this research will also be of help for further exploration of the pathogenicity of Y. pestis and its historical patterns of spread.
Materials and Methods
Details of materials and methods are included in SI Appendix, SI Materials and Methods and Dataset S7, which lists the SNPs excluded because they are in repetitive regions.
Supplementary Material
Acknowledgments
We thank Baizhong Cui, Zhizhong Song, Xingqi Dong, Xiang Dai, and Baolin Wang for DNA extraction; and Feng Xi, Rui Chen, Juan Wang, and Bo Wang for DNA library construction and sequencing. Support was provided by grants from the State Key Development Program for Basic Research of China (2009CB522600), the National Natural Science Foundation of China (Contract 30930001), Industry Research Special Foundation of China Ministry of Health (201202021), National Key Program for Infectious Diseases of China (2013ZX10004221-002), Shenzhen Biological Industry Development Special Foundation-Basic Research Key Projects (JC201005250088A), European Research Council (No. 260801-BIG_IDEA), and Science Foundation of Ireland (05/FE1/B882).
Footnotes
The authors declare no conflict of interest.
*This Direct Submission article had a prearranged editor.
Data deposition: Raw genome data have been deposited in the National Center for Biotechnology Information/Short Read archive database, www.ncbi.nlm.nih.gov/sra (accession no SRA010790; individual genome assemblies have been deposited under accession nos. ADOV00000000 47685–ADTI00000000 47685). The accession numbers for each strain are listed in Dataset S1.
This article contains supporting information online at www.pnas.org/lookup/suppl/doi:10.1073/pnas.1205750110/-/DCSupplemental.
References
- 1.Gage KL, Kosoy MY. Natural history of plague: Perspectives from more than a century of research. Annu Rev Entomol. 2005;50:505–528. doi: 10.1146/annurev.ento.50.071803.130337. [DOI] [PubMed] [Google Scholar]
- 2.Stenseth NC, et al. Plague: Past, present, and future. PLoS Med. 2008;5(1):e3. doi: 10.1371/journal.pmed.0050003. [DOI] [PMC free article] [PubMed] [Google Scholar]
- 3.Yersin A. La peste bubonique à Hong-Kong [Bubonic plague in Hong Kong] Ann Inst Pasteur (Paris) 1894;2:428–430. [Google Scholar]
- 4.Benedictow OJ. The Black Death 1346–1353. Woodbridge: Boydell Press; 2004. [Google Scholar]
- 5.Little LK. Plague and the End of Antiquity: The Pandemic of 541-750. New York: Cambridge Univ Press; 2007. p. xiv. 360. [Google Scholar]
- 6.Scott S, Duncan CJ. Biology of Plagues: Evidence from Historical Populations. Cambridge, New York: Cambridge Univ Press; 2001. p. xiv. 420. [Google Scholar]
- 7.Cohn SK. The Back Death Transformed: Disease and Culture in Early Renaissance Europe. London, New York: Arnold and Oxford Univ Press; 2002. p. x. 318. [Google Scholar]
- 8.Twigg G. The Black Death: A Biological Reappraisal. London: Batsford; 1984. [Google Scholar]
- 9.Haensch S, et al. Distinct clones of Yersinia pestis caused the black death. PLoS Pathog. 2010;6(10):e1001134. doi: 10.1371/journal.ppat.1001134. [DOI] [PMC free article] [PubMed] [Google Scholar]
- 10.Tran TN, et al. High throughput, multiplexed pathogen detection authenticates plague waves in medieval Venice, Italy. PLoS ONE. 2011;6(3):e16735. doi: 10.1371/journal.pone.0016735. [DOI] [PMC free article] [PubMed] [Google Scholar]
- 11.Bos KI, et al. A draft genome of Yersinia pestis from victims of the Black Death. Nature. 2011;478(7370):506–510. doi: 10.1038/nature10549. [DOI] [PMC free article] [PubMed] [Google Scholar]
- 12.Achtman M. Evolution, population structure, and phylogeography of genetically monomorphic bacterial pathogens. Annu Rev Microbiol. 2008;62:53–70. doi: 10.1146/annurev.micro.62.081307.162832. [DOI] [PubMed] [Google Scholar]
- 13.Morelli G, et al. Yersinia pestis genome sequencing identifies patterns of global phylogenetic diversity. Nat Genet. 2010;42(12):1140–1143. doi: 10.1038/ng.705. [DOI] [PMC free article] [PubMed] [Google Scholar]
- 14.Li Y, et al. Different region analysis for genotyping Yersinia pestis isolates from China. PLoS ONE. 2008;3(5):e2166. doi: 10.1371/journal.pone.0002166. [DOI] [PMC free article] [PubMed] [Google Scholar]
- 15.Li Y, et al. Genotyping and phylogenetic analysis of Yersinia pestis by MLVA: Insights into the worldwide expansion of Central Asia plague foci. PLoS ONE. 2009;4(6):e6000. doi: 10.1371/journal.pone.0006000. [DOI] [PMC free article] [PubMed] [Google Scholar]
- 16.Li R, et al. De novo assembly of human genomes with massively parallel short read sequencing. Genome Res. 2010;20(2):265–272. doi: 10.1101/gr.097261.109. [DOI] [PMC free article] [PubMed] [Google Scholar]
- 17.Eppinger M, et al. Draft genome sequences of Yersinia pestis isolates from natural foci of endemic plague in China. J Bacteriol. 2009;191(24):7628–7629. doi: 10.1128/JB.01227-09. [DOI] [PMC free article] [PubMed] [Google Scholar]
- 18.Achtman M, et al. Yersinia pestis, the cause of plague, is a recently emerged clone of Yersinia pseudotuberculosis. Proc Natl Acad Sci USA. 1999;96(24):14043–14048. doi: 10.1073/pnas.96.24.14043. [DOI] [PMC free article] [PubMed] [Google Scholar]
- 19.Achtman M, et al. Microevolution and history of the plague bacillus, Yersinia pestis. Proc Natl Acad Sci USA. 2004;101(51):17837–17842. doi: 10.1073/pnas.0408026101. [DOI] [PMC free article] [PubMed] [Google Scholar]
- 20.Laukkanen-Ninios R, et al. Population structure of the Yersinia pseudotuberculosis complex according to multilocus sequence typing. Environ Microbiol. 2011;13(12):3114–3127. doi: 10.1111/j.1462-2920.2011.02588.x. [DOI] [PMC free article] [PubMed] [Google Scholar]
- 21.WHO . WHO Report on Global Surveillance of Epidemic-Prone Infectious Disease. Geneva: WHO; 2000. pp. 25–37. Available at http://www.who.int/csr/resources/publications/surveillance/WHO_CDS_CSR_ISR_2000_1/en. [Google Scholar]
- 22.Song Y, et al. Complete genome sequence of Yersinia pestis strain 91001, an isolate avirulent to humans. DNA Res. 2004;11(3):179–197. doi: 10.1093/dnares/11.3.179. [DOI] [PubMed] [Google Scholar]
- 23.Zhou D, et al. Genetics of metabolic variations between Yersinia pestis biovars and the proposal of a new biovar, microtus. J Bacteriol. 2004;186(15):5147–5152. doi: 10.1128/JB.186.15.5147-5152.2004. [DOI] [PMC free article] [PubMed] [Google Scholar]
- 24.Smith GJ, et al. Origins and evolutionary genomics of the 2009 swine-origin H1N1 influenza A epidemic. Nature. 2009;459(7250):1122–1125. doi: 10.1038/nature08182. [DOI] [PubMed] [Google Scholar]
- 25.Harris SR, et al. Evolution of MRSA during hospital transmission and intercontinental spread. Science. 2010;327(5964):469–474. doi: 10.1126/science.1182395. [DOI] [PMC free article] [PubMed] [Google Scholar]
- 26.Nübel U, et al. A timescale for evolution, population expansion, and spatial spread of an emerging clone of methicillin-resistant Staphylococcus aureus. PLoS Pathog. 2010;6(4):e1000855. doi: 10.1371/journal.ppat.1000855. [DOI] [PMC free article] [PubMed] [Google Scholar]
- 27.Drummond AJ, Rambaut A. BEAST: Bayesian evolutionary analysis by sampling trees. BMC Evol Biol. 2007;7:214. doi: 10.1186/1471-2148-7-214. [DOI] [PMC free article] [PubMed] [Google Scholar]
- 28.Drummond AJ, Suchard MA. Bayesian random local clocks, or one rate to rule them all. BMC Biol. 2010;8:114. doi: 10.1186/1741-7007-8-114. [DOI] [PMC free article] [PubMed] [Google Scholar]
- 29.Drummond AJ, Ho SY, Phillips MJ, Rambaut A. Relaxed phylogenetics and dating with confidence. PLoS Biol. 2006;4(5):e88. doi: 10.1371/journal.pbio.0040088. [DOI] [PMC free article] [PubMed] [Google Scholar]
- 30.Ho SY, Phillips MJ, Cooper A, Drummond AJ. Time dependency of molecular rate estimates and systematic overestimation of recent divergence times. Mol Biol Evol. 2005;22(7):1561–1568. doi: 10.1093/molbev/msi145. [DOI] [PubMed] [Google Scholar]
- 31.Venditti C, Meade A, Pagel M. Detecting the node-density artifact in phylogeny reconstruction. Syst Biol. 2006;55(4):637–643. doi: 10.1080/10635150600865567. [DOI] [PubMed] [Google Scholar]
- 32.Barrick JE, et al. Genome evolution and adaptation in a long-term experiment with Escherichia coli. Nature. 2009;461(7268):1243–1247. doi: 10.1038/nature08480. [DOI] [PubMed] [Google Scholar]
- 33.Eppinger M, et al. Genome sequence of the deep-rooted Yersinia pestis strain Angola reveals new insights into the evolution and pangenome of the plague bacterium. J Bacteriol. 2010;192(6):1685–1699. doi: 10.1128/JB.01518-09. [DOI] [PMC free article] [PubMed] [Google Scholar]
- 34.Roumagnac P, et al. Evolutionary history of Salmonella typhi. Science. 2006;314(5803):1301–1304. doi: 10.1126/science.1134933. [DOI] [PMC free article] [PubMed] [Google Scholar]
- 35.Kryazhimskiy S, Dushoff J, Bazykin GA, Plotkin JB. Prevalence of epistasis in the evolution of influenza A surface proteins. PLoS Genet. 2011;7(2):e1001301. doi: 10.1371/journal.pgen.1001301. [DOI] [PMC free article] [PubMed] [Google Scholar]
- 36.Bearden SW, et al. Attenuated enzootic (pestoides) isolates of Yersinia pestis express active aspartase. Microbiology. 2009;155(Pt 1):198–209. doi: 10.1099/mic.0.021170-0. [DOI] [PubMed] [Google Scholar]
- 37.Drancourt M, Houhamdi L, Raoult D. Yersinia pestis as a telluric, human ectoparasite-borne organism. Lancet Infect Dis. 2006;6(4):234–241. doi: 10.1016/S1473-3099(06)70438-8. [DOI] [PubMed] [Google Scholar]
- 38.Hinnebusch BJ. The evolution of flea-borne transmission in Yersinia pestis. Curr Issues Mol Biol. 2005;7(2):197–212. [PubMed] [Google Scholar]
- 39.Lorange EA, Race BL, Sebbane F, Joseph Hinnebusch B. Poor vector competence of fleas and the evolution of hypervirulence in Yersinia pestis. J Infect Dis. 2005;191(11):1907–1912. doi: 10.1086/429931. [DOI] [PubMed] [Google Scholar]
- 40.Girard JM, et al. Differential plague-transmission dynamics determine Yersinia pestis population genetic structure on local, regional, and global scales. Proc Natl Acad Sci USA. 2004;101(22):8408–8413. doi: 10.1073/pnas.0401561101. [DOI] [PMC free article] [PubMed] [Google Scholar]
- 41.Laird CD, McConaughy BL, McCarthy BJ. Rate of fixation of nucleotide substitutions in evolution. Nature. 1969;224(5215):149–154. doi: 10.1038/224149a0. [DOI] [PubMed] [Google Scholar]
- 42.Tettelin H, et al. Genome analysis of multiple pathogenic isolates of Streptococcus agalactiae: Implications for the microbial “pan-genome”. Proc Natl Acad Sci USA. 2005;102(39):13950–13955. doi: 10.1073/pnas.0506758102. [DOI] [PMC free article] [PubMed] [Google Scholar]
- 43.Touchon M, et al. Organised genome dynamics in the Escherichia coli species results in highly diverse adaptive paths. PLoS Genet. 2009;5(1):e1000344. doi: 10.1371/journal.pgen.1000344. [DOI] [PMC free article] [PubMed] [Google Scholar]
- 44.Holt KE, et al. High-throughput sequencing provides insights into genome variation and evolution in Salmonella Typhi. Nat Genet. 2008;40(8):987–993. doi: 10.1038/ng.195. [DOI] [PMC free article] [PubMed] [Google Scholar]
- 45.Moran NA, McLaughlin HJ, Sorek R. The dynamics and time scale of ongoing genomic erosion in symbiotic bacteria. Science. 2009;323(5912):379–382. doi: 10.1126/science.1167140. [DOI] [PubMed] [Google Scholar]
- 46.Derbise A, et al. A horizontally acquired filamentous phage contributes to the pathogenicity of the plague bacillus. Mol Microbiol. 2007;63(4):1145–1157. doi: 10.1111/j.1365-2958.2006.05570.x. [DOI] [PubMed] [Google Scholar]
- 47.Wiechmann I, Grupe G. Detection of Yersinia pestis DNA in two early medieval skeletal finds from Aschheim (Upper Bavaria, 6th century A.D.) Am J Phys Anthropol. 2005;126(1):48–55. doi: 10.1002/ajpa.10276. [DOI] [PubMed] [Google Scholar]
- 48.Drancourt M, et al. Genotyping, Orientalis-like Yersinia pestis, and plague pandemics. Emerg Infect Dis. 2004;10(9):1585–1592. doi: 10.3201/eid1009.030933. [DOI] [PMC free article] [PubMed] [Google Scholar]
- 49.Drancourt M, et al. Yersinia pestis Orientalis in remains of ancient plague patients. Emerg Infect Dis. 2007;13(2):332–333. doi: 10.3201/eid1302.060197. [DOI] [PMC free article] [PubMed] [Google Scholar]
- 50.Vergnaud G. Yersinia pestis genotyping. Emerg Infect Dis. 2005;11(8):1317–1318, author reply 1318–1319. doi: 10.3201/eid1108.040942. [DOI] [PMC free article] [PubMed] [Google Scholar]
- 51.Keim PS, Wagner DM. Humans and evolutionary and ecological forces shaped the phylogeography of recently emerged diseases. Nat Rev Microbiol. 2009;7(11):813–821. doi: 10.1038/nrmicro2219. [DOI] [PMC free article] [PubMed] [Google Scholar]
- 52.Bakker HC, et al. A whole-genome single nucleotide polymorphism-based approach to trace and identify outbreaks linked to a common Salmonella enterica subsp. enterica serovar Montevideo pulsed-field gel electrophoresis type. Appl Environ Microbiol. 2011;77(24):8648–8655. doi: 10.1128/AEM.06538-11. [DOI] [PMC free article] [PubMed] [Google Scholar]
- 53.Stenseth NC, et al. Plague dynamics are driven by climate variation. Proc Natl Acad Sci USA. 2006;103(35):13110–13115. doi: 10.1073/pnas.0602447103. [DOI] [PMC free article] [PubMed] [Google Scholar]
- 54.Xu L, et al. Nonlinear effect of climate on plague during the third pandemic in China. Proc Natl Acad Sci USA. 2011;108(25):10214–10219. doi: 10.1073/pnas.1019486108. [DOI] [PMC free article] [PubMed] [Google Scholar]
Associated Data
This section collects any data citations, data availability statements, or supplementary materials included in this article.