Abstract
Purpose
The purpose of this study was to develop and test hardware and software modifications to allow quantitative full-thickness corneal imaging using the HRT Rostock Corneal Module.
Methods
A PC-controlled motor drive with positional feedback was integrated into the system to allow automated focusing through the entire cornea. The left eyes of ten New Zealand White rabbits were scanned from endothelium to epithelium. Image sequences were read into a custom-developed program for depth calculation and measurement of sub-layer thicknesses. 3-D visualizations were also generated using Imaris. In six rabbits, stack images were registered, and depth-dependent counts of keratocyte nuclei were made using Metamorph.
Results
The mean epithelial and corneal thicknesses measured in the rabbit were 47 ± 5 μm and 373 ± 25 μm, respectively (N = 10 corneas); coefficients of variation for repeated scans were 8.2% and 2.1%. Corneal thickness measured using ultrasonic pachymetry was 374 ± 17 μm. The mean overall keratocyte density measured in the rabbit was 43,246 ± 5,603 cells/mm3 in vivo (N = 6 corneas). There was a gradual decrease in keratocyte density from the anterior to posterior cornea (R = 0.99), consistent with previous data generated in vitro.
Conclusions
This modified system allows high resolution 3-D image stacks to be collected from the full thickness rabbit cornea in vivo. These datasets can be used for interactive visualization of corneal cell layers, measurement of sub-layer thickness, and depth-dependent keratocyte density measurements. Overall, the modifications significantly expand the potential quantitative research applications of the HRT-RCM microscope.
Keywords: Confocal Microscopy, Cornea, Imaging, 3-D Reconstruction
INTRODUCTION
It is well established that confocal microscopy provides higher resolution images with better rejection of out of focus information than conventional light microscopy. The optical sectioning ability of confocal microscopy allows images to be obtained from different depths within a thick tissue specimen, thereby eliminating the need for processing and sectioning procedures. Thus, confocal microscopy is uniquely suited to the study of intact tissue in living subjects. In vivo confocal microscopy has been used in a variety of corneal research and clinical applications.1-3 Interestingly, this technology has developed along several paths, which have led to instruments with different strengths and weaknesses in both hardware and software designs. Three confocal imaging systems are currently in use: the tandem scanning confocal microscope (TSCM, a spinning disk confocal), the Confoscan 4 (a scanning slit system), and the HRT Rostock Cornea Module (HRT-RCM, a scanning laser system).
The first scanning confocal microscope, developed by Petran et al,4,5 used a modified Nipkow disk containing optically conjugate (source/detector) pinholes arranged in Archimedean spirals. This work led to the design of a TSCM suited for use in ophthalmology.6,7 TSCM systems use a specially designed surface contact objective, in which the position of the focal plane relative to the tip is varied by moving the lenses inside the casing. Thus, the position of the focal plane within the cornea can be calibrated, allowing quantitative 3-D imaging.8,9 To collect and quantify 3-D information from the cornea, a technique termed confocal microscopy through-focusing (CMTF) was developed for the TSCM.10,11 CMTF scans are obtained by scanning through the cornea from the epithelium to endothelium at a constant lens speed, while continuously acquiring images. After a z-series of CMTF images have been digitized, a cursor can be moved along the intensity curve as corresponding images are displayed. In this way, the user can identify images of interest and record their exact z-axis depth.10,11 Using intensity peaks corresponding to interfaces between layers, accurate and reproducible measurements of corneal, epithelial and stromal thickness can be obtained.10 In addition, depth-dependent changes in cell morphology, density and reflectivity can be assessed with this system.12-14 Unfortunately, the TSCM is no longer commercially available.
The Confoscan 4 (Nidek Technologies Srl, Padova, Italy) is a variable-slit real-time scanning confocal microscope. In this microscope, two independently adjustable slits are located in conjugate optical planes; a rapidly oscillating two-sided mirror is used to scan the image of the slit over the plane of the cornea to produce optical sectioning in real time.15,16 This is a user-friendly instrument that incorporates automated alignment and scanning software. In addition, the scanning slit design improves light throughput and provides images with better contrast and SNR than the TSCM. However, this is achieved at the expense of axial resolution, which has been measured at approximately 24 μm (as compared to 9 μm for the TSCM).8.17
The HRT-RCM (Heidelberg Engineering, GmBH, Dossenheim, Germany) is a laser scanning confocal microscope.18 It operates by scanning a 670 nm laser beam in a raster pattern over the field of view. The system typically uses a higher numerical aperture 63x objective lens (0.9 NA), and thus produces images with excellent resolution and contrast and has better axial resolution than the other confocal systems (7.6 μm).19 Another unique advantage of the HRT is the ability to make on-line 2-D composite images, which dramatically expands the effective field of view.20
Automated z-scans of 60μm can be generated using the internal lens drive, and these have been used to produce 3D-reconstructions of the anterior cornea.21,22 However, changing the focal plane over larger distances must be performed manually (by rotating the objective housing by hand), which can cause movement and interfere with the examination and data acquisition process. While remote control of focusing has been described, a system that allows quantitative high resolution 3-D imaging of the full-thickness cornea has not been reported.19,23 In this study, we modified the HRT-RCM hardware and software to address these important limitations. We then tested the feasibility of performing quantitative full-thickness corneal imaging in vivo using the enhanced system.
METHODS
Hardware Modifications
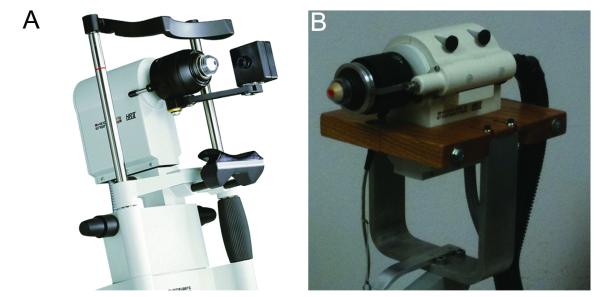
With the HRT II –RCM, changing the focal plane is normally accomplished using a thumbscrew drive which is rotated by hand (Figure 1A). This piece was removed to allow the front assembly of the microscope to move freely, as previously described.23 A Newport TRA25CC Motorized Actuator with DC Servo motor drive enclosed in a custom made housing was attached to HRT scan head (Figure 1B). The actuator was coupled to the front section of the microscope using a spring loaded drive shaft. This rigid assembly ensured proper alignment of the motor drive shaft with the z-axis of the HRT-RCM. Also, the HRT-RCM was mounted on a slit lamp stand to facilitate proper alignment with the cornea. In some experiments, a thin silicon washer (1.2 cm outer diameter, 3 mm inner diameter, 600 μm thick; Specialty Silicone Products Inc., Ballston Spa, NY) was placed on the Tomocap to eliminate the reflections that can interfere with superficial epithelial imaging.19
Figure 1.
(A) Heidelberg Engineering HRT-RCM confocal microscope (From Heidelberg Engineering Website). (B) Modified HRT-RCM with motor drive to allow automated through focusing, and modified support structure (slit lamp stand) to facilitate positioning.
Software Modifications
We previously developed a CMTF program which controlled the focal plane position on the TSCM system via an Oriel linear actuator.11 This program was modified to control the position of the Newport motor via a serial interface to a Newport Single Axis Motion Controller (SMC100CC), which is connected to the TRA25CC actuator. The position of the actuator is continuously monitored using the SMC100CC controller and is read from the controller using CMTF software. The standard HRT software only collects 100 images during a sequential acquire, which results in a large step size (> 5 μm) between images in a CMTF stack of the full thickness cornea.23 We recently obtained beta software from Heidelberg Engineering that allows real-time “streaming” of images to the hard drive during an examination. With this software, much larger sequences can be obtained (maximum 14,525 images). All images in a sequence are combined into a single “.vol” file, in which each image contains a 384 byte header followed by the 384×384 pixel data. The CMTF software was modified so that the HRT “.vol” files could be directly loaded. The header information from each image is also decoded to determine its exact time of acquisition, and its relative z-position was then calculated based on the known scan speed.
Calibration of Lens Drive
We first tested the lens drive system by comparing the focal plane position determined from the inductive displacement transducer on the HRT-RCM (HRT Depth Display on Eye Explorer Software) and the depth reading from the CMTF Program. At the start of the test, the microscope was focused on the front surface of the Tomocap. This position is marked as HOME, and is reset to zero on both the Eye Explorer software and the CMTF software. The Tomocap on the microscope was moved over 1000 microns in steps of either 50 or 100 microns. The depth readings were recorded from the CMTF and the Eye Explorer software for every step. The experiment was repeated three times for lens speed of 30 microns/sec and 60 microns/sec. The microscope focus was reset at the beginning of each experiment.
In Vivo Imaging
To test the new system in vivo, the left eyes of ten anesthetized New Zealand White rabbits were studied. Rabbits were anesthetized with 50 mg/kg intramuscular ketamine and 5.0 mg/kg xylazine. A drop of topical anesthetic (proparacaine) was also applied to the left eye. Corneal thickness was then measured using an ultrasonic pachymeter (Corneo-Gage III, Chiron). For confocal imaging, a drop of Genteal was placed on the tip of the HRT-RCM objective lens to serve as a thin liquid cushion and to eliminate bright surface reflections. The objective lens was then positioned so that flat-field images were observed at a central region of the cornea (confirming proper alignment). For CMTF, scans were made from the endothelium to the epithelium at a constant lens speed, while collecting images using the HRT streaming software function with the acquisition rate set to 30 frames/second. A minimum of 4 CMTF scans were performed in the central region of each cornea using a lens speed of 60 μm/sec. Each scan required ~7 seconds and had a step size between images of approximately 2 μm. The field of view for each 384×384 pixel image was 400 μm × 400 μm, resulting in a voxel size of 1.04 μm × 1.04 μm × 2 μm (x, y, z). Quantitative analyses of corneal sub-layer thickness and keratocyte density were performed using these scans. In five rabbits, additional scans were then performed using a lens speed of 30 μm/sec. Each of these scans required ~14 seconds and had a step size between images of approximately 1 μm. These scans were used for volume rendering, as detailed below. All scans were collected with the automatic brightness correction inside the HRTII software turned “off”.
Keratocyte Density Measurements
In six corneas, 3-D keratocyte density was measured from the in vivo CMTF stacks using the manual counting routine in Metamorph. To compensate for movements that occur during in vivo imaging, the stromal images in the 3-D CMTF datasets were automatically aligned using the linear stack alignment plug-in in Image J (Fiji version), which uses features extracted via the scale invariant feature transform (SIFT). Since this alignment produces vacant areas at the edges of the shifted images, a central 200×200 pixel region was used for analysis. Manual counts of keratocyte nuclei were performed using an approach previously described by us, in which each nuclei is marked only on the image in which it is brightest.24 Measurements were averaged within ten percent thickness intervals and plotted.
In one rabbit, the cornea was fixed in situ following sacrifice with 3% paraformaldehyde. To label the nuclei, a block from the central cornea was stained with propidium iodide (Molecular Probes, Inc., Eugene, OR) in PBS (1:100) containing RNase (DNase free, 1:100, Roche, Indianapolis, IN), and mounted in glycerin/PBS to prevent swelling (1:1).25 This sample was imaged using a 20X objective on a Leica SP2 confocal microscope (LSCM). Cell counts were performed as described above, and keratocyte density was calculated after normalizing to the in vivo thickness (to account for any tissue swelling/shrinkage during fixation).
Volume Rendering
Imaris software (Bitplane Inc., South Windsor, CT) was used for volume rendering of CMTF image stacks. Stacks were first loaded into Metamorph, and saved as multi-image TIF files. These TIF files were read into Imaris, and a median filter was applied to remove background noise. Images were cropped in 3-D to focus on a region of interest, and rendered using an orthogonal maximum intensity projection within the Surpass module of Imaris. Movies showing reconstructions over a range of projection angles were generated using the Animation module.
RESULTS
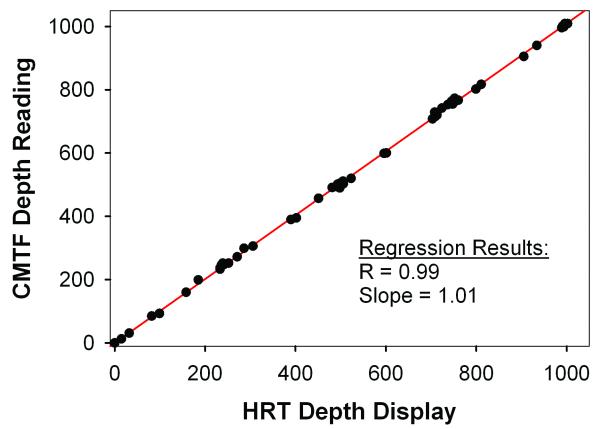
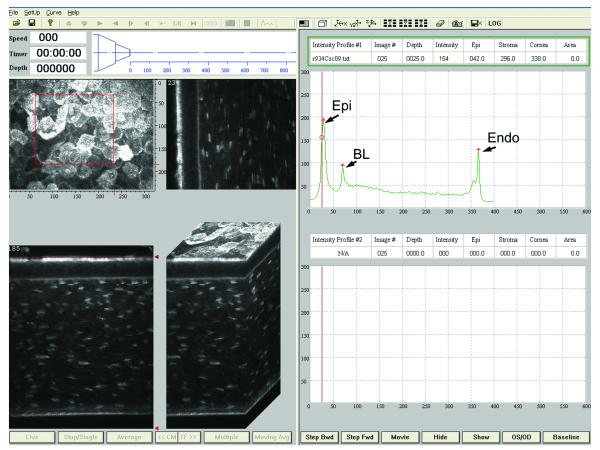
To allow automated control of the focal plane on the HRT-RCM, a PC-controlled motor drive was incorporated into the system. As shown in Figure 2, a high correlation was found between the focal plane positions displayed on the HRT-RCM and the CMTF Program (R=0.99, P < 0.001). This confirms that there is direct and stable coupling between the motor drive and the RCM. However, it should be noted that these readings do not necessarily correspond to the focal plane position inside the cornea. The modified CMTF program interface is shown in Figure 3. The CMTF software reads and displays the image stacks, and the intensity versus depth curve is calculated and plotted on the right side of the window. The intensity curves obtained with the HRT-RCM have the same characteristic shape as those obtained previously with the TSCM, with 3 peaks corresponding to the superficial epithelium, basal lamina and the endothelium.26 By clicking on the maxima of these peaks, the CMTF software directly calculates epithelial, stromal and total corneal thickness. The mean epithelial and corneal thicknesses measured in the rabbit were 47 ± 5 μm and 373 ± 25 μm, respectively (N = 10 corneas); coefficients of variation for repeated scans were 8.2% and 2.1%. Corneal thickness measured using ultrasonic pachymetry was 374 ± 17 μm, which is in close agreement with the confocal measurements. REMOVED TABLE 1.
Figure 2.
Comparison of focal plane position determined from the inductive displacement transducer on the HRT-RCM (HRT Depth Display) and the depth reading from the CMTF Program. The Newport linear actuator was used to change the focal plane position.
Figure 3.
Screen shot of CMTF program. Right side shows corneal intensity curve with intensity peaks at the superficial epithelium (Epi), basal lamina (BL), and endothelium (Endo). Images on the left are reconstructions of the image stack collected by CMTF imaging shown at different projection angles. Scan shown was collected at a speed of 30 μm/second.
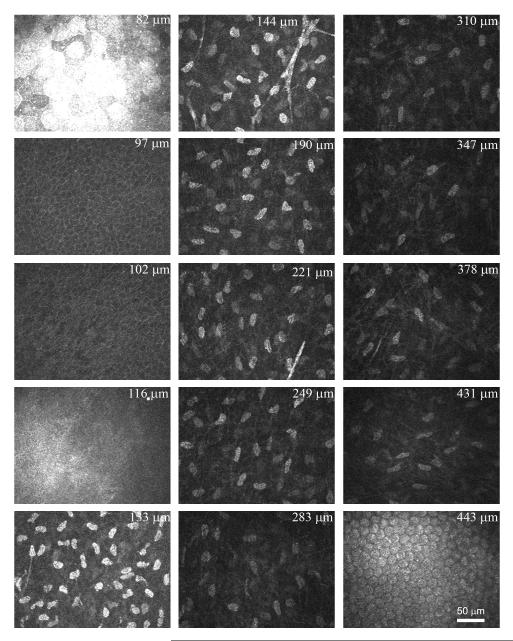
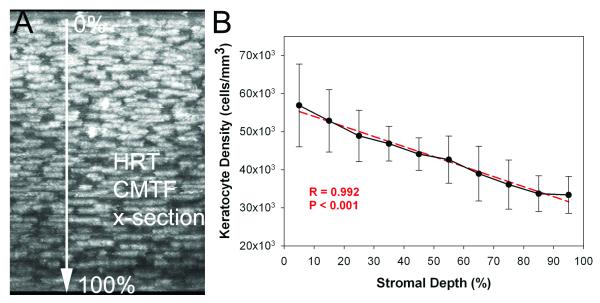
Figure 4 shows a sampling of images from a CMTF scan through a rabbit cornea in vivo. Using the modified HTRT-RCM, clear images of all cell layers with sharply contrasting borders were consistently obtained. The stacks of corneal images obtained from the in vivo CMTF were also used to calculate the keratocyte density in 6 rabbits. The mean overall keratocyte density measured in the rabbit was 43,246 ± 5,603 cells/mm3 in vivo. As shown in Figure 5, there was the expected gradual decrease in keratocyte density from the anterior to posterior cornea (R = 0.992), consistent with previous data generated in vitro.24,27 In one rabbit, in vivo and in vitro cell density measurements were directly compared, and no significant difference was found (39,392 + 652 cells/mm3 vs. 40,781 ± 1,526 cells/mm3, P = 0.22, N = 3 scan each).
Figure 4.
A sampling of images from a CMTF scan taken from a rabbit cornea in vivo. The position displayed in the upper right cornea of each image is the depth relative to the front surface of the Tomocap. A speed of 60 μm/second was used for the CMTF scan.
Figure 5.
A) Maximum Intensity Projection along the x-axis of an in vivo image stack collecting using the CMTF program. B) Graph showing mean cell densities through the stromal thickness of six corneas. Both the image and the graph show progressively decreasing cell density through the stroma from the basal lamina to the endothelium. Graph shows mean and standard deviation of measurements from six corneas taken in vivo (N=6).
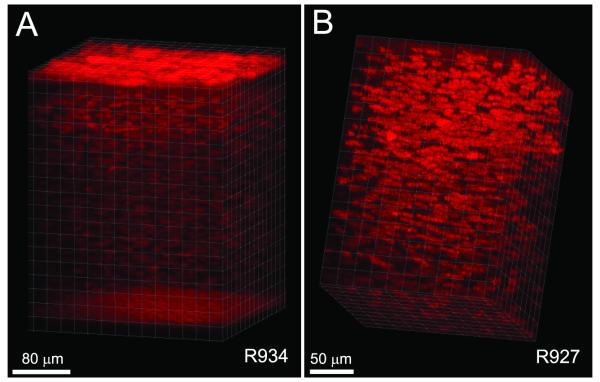
In addition to the interactive visualization provided by the CMTF program, we also attempted to generate 3-D renderings using Imaris software. As shown in Figure 6A, orthogonal projections through the full thickness of the cornea were successfully generated from the CMTF stacks. In one rabbit, there was minimal x-y movement of the cornea during the scanning process (maximum drift of less than 10 microns), and the reconstruction was made without aligning the images within the stack (Fig. 6A). By rotating the projection angles to create a 3-D movie, the 3-D relationships between the cells and cell layers within the tissue are clearly demonstrated (Supplemental Movie 1). A second reconstruction of the stroma of a different cornea is shown in Figure 6B and Supplemental Movie 2. Because there was more x-y movement of the cornea during this scan (a maximum drift of 78 μm), the planes within the stack were registered prior to performing the reconstruction.
Figure 6.
Volume renderings of CMTF data. Images were cropped in 3-D to focus on a region of interest, and rendered using an orthogonal maximum intensity projection within the Surpass module of Imaris.
DISCUSSION
The HRT Rostock Corneal Module provides images with better resolution and contrast than other confocal systems. However, in order to change the focal plane position over large distances, a cylindrical housing must be rotated by hand. This housing is within inches of the cornea, and can sometimes interfere with the examination process. Overall, changing the focal plane position is cumbersome, and represents an important limitation of the instrument. To address this problem, we modified the HRT in our laboratory so that the focal plane position could be controlled using a computer-controlled lens drive system.23 This modification significantly improved the ease of the examination procedure by allowing “hands-free” focusing of the HRT-II microscope; however, this prototype still had several important limitations. First, the connection between the motor drive and the microscope objective was not robust. Second, a time-consuming, multi-step procedure was required to load images and data into the CMTF program. Third, the software could only collect 100 images during a sequential acquire, resulting in a large step size between CMTF images (> 5 μm), which limits the resolution for quantitative analyses of sub-layer thickness. In this study, we report modifications to the HRT-RCM hardware and software that addresses all three of these limitations. We also tested the feasibility of performing in vivo quantitative full-thickness corneal imaging using the new system.
Using the modified HRT-RCM system, clear peaks were identified on the CMTF curves that allowed us to make measurements of epithelial, stromal and corneal thickness. Corneal thickness measurements made with the HRT-RCM were in good agreement with those obtained using ultrasonic pachymetry (373 ± 25 μm vs. 374 ± 17 μm, respectively). However, the coefficients of variation obtained for repeated scans of the epithelium and cornea were higher than that previously reported using the TSCM system (8.2% and 2.1% versus 2.5% and 0.7%).26 This is most likely due to the different mechanisms used for changing the focal plane on these two systems. In the TSCM, the focal plane position is changed by moving lenses inside the objective casing, thus the tip of the objective remains stationary during scanning. In contrast, changing the focal plane position of the HRT requires movement of the Tomocap which is in contact with the cornea. Essentially, the cornea is moved through the stationary focal plane of the objective. This movement can potentially change the degree of applanation during a scan, as well as introduce backlash when changing directions. In the current study, all through focus scans collected were performed with the Tomocap moving forward, to ensure that the tip remained in contact with the corneal surface throughout the procedure. For this study, the Newport motor drive was controlled using PC-based software; thus a separate PC (in addition to the HRT PC) was required to perform confocal imaging. Alternatively, a joystick remote can be used with a more expensive controller (Newport ESP301-1N), which eliminates the need for a second PC (unpublished observation). We are also evaluating other approaches for focal plane control that can be more easily added onto existing HRT-RCM systems.
Other techniques such as high frequency ultrasound and spectral domain OCT can also provide accurate measurements of corneal sub-layer thicknesses.28-30 However, quantitative 3-D confocal microscopy additional provides a series of high resolution en face images which allow assessment of depth-dependent changes in cell morphology, density and reflectivity.12-14,31 For example, CMTF imaging with the TSCM has been used for studying the effects of refractive surgical procedures such as PRK and LASIK, in which measurements of sub-layer thickness and depth-dependent cell and ECM backscatter are important.32-37 CMTF has also been used to assess the corneal light scattering profile in transgenic mouse models with altered corneal clarity.38 Unlike most anterior segment imaging approaches, confocal microscopy can also be used for reconstruction of the subbasal nerve plexus, assessment of corneal endothelial density and morphology, and 3-D localization and monitoring of corneal infection and inflammation.1-3,22,39
The TSCM has also been used to monitor changes in keratocyte density during aging, in keratoconus patients and following surgery.36,40-43 Previous studies have identified significant, often unexpected changes in cell density that may have long-term clinical implications. 28,30-33 Cell density was estimated from single (2-D) images collected at different depths from within the cornea in these studies. In the current study, we used the entire CMTF dataset, so that the true 3-D position of each cell could be determined. A linear decrease in keratocyte density was measured from the anterior to posterior cornea, consistent with previous data generated from the rabbit cornea in vitro.24 In order to perform true 3-D cell counting, the images within the stack were registered to compensate for translational movement of the cornea that occurred during scanning. Thus scans without large amounts of movement had to be excluded. Although manual cell counting was performed in the current study, the HRT-RCM should be well suited for previously published automated cell counting approaches due to the high image contrast.40,44
We were also able to generate 3-D volume renderings of the rabbit cornea from the confocal scans using Imaris software. To our knowledge, these are the first such reconstructions that encompass the full-thickness of the in vivo cornea. It should be noted that such reconstructions would be more difficult in the human cornea, due to involuntary eye movements that occur during scanning. As recently demonstrated by Zhihov and coworkers, such movements can cause distortions within individual images, and therefore require more complex image registration techniques.22 It should also be noted that the HRT streaming software used in this study is a beta version not yet approved for human use. Without this software only 100 frames can be acquired during a sequential acquire, which is not sufficient for high resolution 3-D reconstructions of the tissue.
Overall, the hardware and software modifications to the HRT-RCM allow high resolution 3-D image stacks to be collected from the entire rabbit cornea in vivo. These datasets can be used for interactive visualization of corneal cell layers, quantitative assessment of sub-layer thickness and depth-dependent measurements of keratocyte density. Overall, the modifications should significantly expand the capabilities of the HRT-RCM for quantitative research applications.
Supplementary Material
Supplemental Movie 1: Movie showing orthogonal maximum intensity projections over a range of angles, rendered using the Surpass module of Imaris. A scan through an entire rabbit cornea is shown. Scan speed was 30 μm/sec and image acquisition rate was set to 30 frames/sec.
Supplemental Movie 2: Movie showing orthogonal maximum intensity projections over a range of angles, rendered using the Surpass module of Imaris. A set of registered images from the entire corneal stroma of a rabbit is shown. Scan speed was 30 μm/sec and image acquisition rate was set to 30 frames/sec.
Acknowledgments
Source of Funding:
This study was supported in part by NIH R01 EY013322, NIH P30 EY020799, and an unrestricted grant from Research to Prevent Blindness, Inc., NY, NY.
Footnotes
Conflicts of Interest
Conflicts of interest: None.
REFERENCES
- 1.Efron N. Contact lens-induced changes in the anterior eye as observed in vivo with the confocal microscope. Prog Retin Eye Res. 2007;26:398–436. doi: 10.1016/j.preteyeres.2007.03.003. [DOI] [PubMed] [Google Scholar]
- 2.Dhaliwal JS, Kaufman SC, Chiou AGY. Current applications of clinical confocal microscopy. Curr Opin Ophthalmol. 2007;18:300–307. doi: 10.1097/ICU.0b013e3281b11665. [DOI] [PubMed] [Google Scholar]
- 3.Labbe A, Khammari C, Dupas B, et al. Contribution of in vivo confocal microscopy to the diagnosis and management of infectious keratitis. The Ocular Surface. 2009;7:41–52. doi: 10.1016/s1542-0124(12)70291-4. [DOI] [PubMed] [Google Scholar]
- 4.Petran M, Hadravsky M, Egger MD, Galambos R. Tandem scanning reflected light microscope. J Opt Soc Am. 1968;58:661–664. [Google Scholar]
- 5.Petran M, Hadravsky M, Benes J, Kucera R, Boyde A. The tandem scanning reflected light microscope: Part I: the principle, and its design. Proc R Microsc Soc. 1985;20:125–129. [Google Scholar]
- 6.Lemp MA, Dilly PN, Boyde A. Tandem scanning (confocal) microscopy of the full thickness cornea. Cornea. 1986;4:205–209. [PubMed] [Google Scholar]
- 7.Cavanagh HD, Shields W, Jester JV, Lemp MA, Essepian J. Confocal microscopy of the living eye. CLAO J. 1990;16:65–73. [PubMed] [Google Scholar]
- 8.Petroll WM, Cavanagh HD, Jester JV. 3-Dimensional reconstruction of corneal cells using in vivo confocal microscopy. J Microsc. 1993;170:213–219. doi: 10.1111/j.1365-2818.1993.tb03344.x. [DOI] [PubMed] [Google Scholar]
- 9.Jester JV, Petroll WM, Feng W, Essepian J, Cavanagh HD. Radial keratotomy: I. The wound healing process and measurement of incisional gape in two animal models using in vivo confocal microscopy. Invest Ophthalmol Vis Sci. 1992;3:3255–3270. [PubMed] [Google Scholar]
- 10.Li HF, Petroll WM, Moller-Pedersen T, Maurer JK, Cavanagh HD, Jester JV. Epithelial and corneal thickness measurements by in vivo confocal microscopy through focusing (CMTF) Current Eye Research. 1997;16:214–221. doi: 10.1076/ceyr.16.3.214.15412. [DOI] [PubMed] [Google Scholar]
- 11.Li J, Jester JV, Cavanagh HD, Black TD, Petroll WM. On-line 3-dimensional confocal imaging in vivo. Invest Ophthalmol Vis Sci. 2000;41:2945–2953. [PubMed] [Google Scholar]
- 12.Petroll WM, Jester JV, Cavanagh HD. Clinical Confocal Microscopy. Curr Opinion Ophthalmol. 1998;9(IV):59–65. doi: 10.1097/00055735-199808000-00011. [DOI] [PubMed] [Google Scholar]
- 13.Tervo T, Moilanen J. In vivo confocal microscopy for evaluation of wound healing following corneal refractive surgery. Progress in Retinal & Eye Research. 2003;22:339–358. doi: 10.1016/s1350-9462(02)00064-2. [DOI] [PubMed] [Google Scholar]
- 14.Kaufman SC, Kaufman HE. How has confocal microscopy helped us in refractive surgery? Curr Opin Ophthalmol. 2006;17:380–388. doi: 10.1097/01.icu.0000233959.73262.99. [DOI] [PubMed] [Google Scholar]
- 15.Brakenhoff GJ, Visscher K. Confocal imaging with bilateral scanning and array detectors. J Microsc. 1992;165:139–146. [Google Scholar]
- 16.Masters BR, Thaer AA. Real-time scanning slit confocal microscopy of the in vivo human cornea. Appl Optics. 1994;33:695–701. doi: 10.1364/AO.33.000695. [DOI] [PubMed] [Google Scholar]
- 17.Erie EA, McLaren JW, Kittleson KM, Patel SV, Erie JC, Bourne WM. Corneal Subbasal Nerve Density: A Comparison of Two Confocal Microscopes. Eye & Contact Lens. 2008;34:322–325. doi: 10.1097/ICL.0b013e31818b74f4. [DOI] [PMC free article] [PubMed] [Google Scholar]
- 18.Guthoff RF, Baudouin C, Stave J. Atlas of confocal laser scanning in vivo microscopy in ophthalmology. Heidelberg/Springer; Berlin: 2006. [Google Scholar]
- 19.Zhivov A, Stachs O, Stave J, Guthoff RF. In vivo three-dimensional confocal laser scanning microscopy of corneal surface and epithelium. Br J Ophthalmol. 2009;93:667–672. doi: 10.1136/bjo.2008.137430. [DOI] [PubMed] [Google Scholar]
- 20.Zhivov A, Blum M, Guthoff R, Stachs O. Real-time mapping of the subepithelial nerve plexus by in vivo confocal laser scanning microscopy. Br J Ophthalmol. 2010;94:1133–1135. doi: 10.1136/bjo.2009.175489. [DOI] [PubMed] [Google Scholar]
- 21.Stachs O, Zhivov A, Kraak R, Stave J, Guthoff R. In vivo three-dimensional confocal laser scanning microscopy of the epithelial nerve structure in the human cornea. Graefes Arch Clin Exp Ophthalmol. 2007;245:569–575. doi: 10.1007/s00417-006-0387-2. [DOI] [PubMed] [Google Scholar]
- 22.Allgeier S, Zhivov A, Eberle F, et al. Image reconstruction of the subbasal nerve plexus with in vivo confocal microscopy. Invest Ophthalmol Vis Sci. 2011;52:5022–5028. doi: 10.1167/iovs.10-6065. [DOI] [PubMed] [Google Scholar]
- 23.Petroll WM, Cavanagh HD. Remote-controlled scanning and automated confocal microscopy through focusing using a modified HRT Rostock cornea module. Eye Contact Lens. 2009;35:302–308. doi: 10.1097/ICL.0b013e3181bdc435. [DOI] [PMC free article] [PubMed] [Google Scholar]
- 24.Petroll WM, Boettcher K, Barry P, Cavanagh HD, Jester JV. Quantitative assessment of keratocyte density in the normal rabbit cornea. Cornea. 1995;14:3–9. [PubMed] [Google Scholar]
- 25.Petroll WM, Boettcher K, Barry PA, Jester JV, Cavanagh HD. Quantitative assessment of anteroposterior keratocyte density in the normal rabbit cornea. Cornea. 1995;14:3–9. [PubMed] [Google Scholar]
- 26.Li H, Petroll WM, Moller-Pederson T, Maurer JK, Cavanagh HD, Jester JV. Epithelial and corneal thickness measurements by in vivo confocal microscopy through focusing (CMTF) Curr Eye Res. 1997;16:214–221. doi: 10.1076/ceyr.16.3.214.15412. [DOI] [PubMed] [Google Scholar]
- 27.Poole CA, Brookes NH, Clover GM. Keratocyte networks visualized in the living cornea using vital dyes. J Cell Sci. 1993;104:353–363. doi: 10.1242/jcs.106.2.685. [DOI] [PubMed] [Google Scholar]
- 28.Reinstein DZ, Archer TJ, DipCompSci. Gobbe M, Silverman RH, Coleman DJ. Epithelial thickness in the normal cornea: Three dimensional display with very high frequency ultrasound. J Refract Surg. 2008;24:571–581. doi: 10.3928/1081597X-20080601-05. [DOI] [PMC free article] [PubMed] [Google Scholar]
- 29.Correa-Perez ME, Lopez-Miguel A, Miranda-Anta S, Iglesias-Cortinas D, Alio JL, Maldonado MJ. Precision of high definition spectral-domain optical coherence tomography for measuring central corneal thickness. Invest Ophthalmol Vis Sci. doi: 10.1167/iovs.11-9033. In Press. [DOI] [PubMed] [Google Scholar]
- 30.Francoz M, Karamoko I, Baudouin C, Labbe A. Ocular surface epithelial thickness evaluation with spectral-domain optical coherence tomography. Invest Ophthalmol Vis Sci. 2011;52:9116–9123. doi: 10.1167/iovs.11-7988. [DOI] [PubMed] [Google Scholar]
- 31.Jester JV, Moller-Pedersen T, Huang J, et al. The cellular basis of corneal transparency: evidence for ‘corneal crystallins’. J Cell Science. 1999;112:613–622. doi: 10.1242/jcs.112.5.613. [DOI] [PubMed] [Google Scholar]
- 32.Moller-Pedersen T, Li H, Petroll WM, Cavanagh HD, Jester JV. Confocal microscopic characterization of wound repair after photorefractive keratectomy using in vivo confocal microscopy. Invest Ophthalmol Vis Sci. 1998;39:487–501. [PubMed] [Google Scholar]
- 33.Møller-Pedersen T, Vogel M, Li HF, Petroll WM, Cavanagh HD, Jester JV. Quantification of stromal thinning, epithelial thickness, and corneal haze after photorefractive keratectomy using in vivo confocal microscopy. Ophthalmology. 1997;104:360–368. doi: 10.1016/s0161-6420(97)30307-8. [DOI] [PubMed] [Google Scholar]
- 34.McCulley JP, Petroll WM. Quantitative assessment of corneal wound healing following IntraLASIK using in vivo confocal microscopy. Trans Am Ophthalmol Soc. 2008;106:84–92. [PMC free article] [PubMed] [Google Scholar]
- 35.Erie JC, Patel SV, McLaren JW, et al. Effect of myopic laser in situ keratomileusis on epithelial and stromal thickness. Ophthalmology. 2002;109:1447–1452. doi: 10.1016/s0161-6420(02)01106-5. [DOI] [PubMed] [Google Scholar]
- 36.Erie JC, Patel SV, McLaren JW, Hodge DO, Bourne WM. Corneal keratocyte deficits after photorefractive keratectomy and laser in situ keratomileusis. Am J Ophthalmol. 2006;141:799–809. doi: 10.1016/j.ajo.2005.12.014. [DOI] [PubMed] [Google Scholar]
- 37.Vesaluoma M, Perez-Santonja J, Petroll WM, Linna T, Alio J, Tervo T. Corneal stromal changes induced by myopic LASIK. Invest Ophthalmol Vis Sci. 2000;41:369–376. [PubMed] [Google Scholar]
- 38.Jester JV, Lee YG, Li J, et al. Measurement of corneal sublayer thickness and transparency in transgenic mice with altered corneal clarity using in vivo confocal microscopy. Vision Res. 2001;41:1283–1290. doi: 10.1016/s0042-6989(00)00222-4. [DOI] [PubMed] [Google Scholar]
- 39.Petroll WM, Cavanagh HD, Jester JV. Confocal Microscopy. In: Krachmer J, Mannis M, Holland E, editors. Cornea. Elsevier, Inc.; St. Louis: 2011. pp. 205–220. [Google Scholar]
- 40.Patel SV, McLaren JW, Hodge DO, Bourne WM. Normal human keratocyte density and corneal thickness measurement by using confocal microscopy in vivo. Invest Ophthalmol Vis Sci. 2001;42:333–339. [PubMed] [Google Scholar]
- 41.Erie JC, Nau CB, McLaren JW, Hodge DO, Bourne WM. Long-term Keratocyte Deficits in the Corneal Stroma after LASIK. Ophthalmology. 2004;111:1356–1361. doi: 10.1016/j.ophtha.2003.10.027. [DOI] [PubMed] [Google Scholar]
- 42.Ku JYF, Niederer RL, Patel DV, Sherwin T, McGhee CNJ. Laser Scanning In Vivo Confocal Analysis of Keratocyte Density in Keratoconus. Ophthalmology. 2008;115 doi: 10.1016/j.ophtha.2007.04.067. [DOI] [PubMed] [Google Scholar]
- 43.Niederer RL, Perumal D, Sherwin T, McGhee CNJ. Laser Scanning In Vivo Confocal Microscopy Reveals Reduced Innervation and Reduction in Cell Density in All Layers of the Keratoconic Cornea. Invest Ophthalmol Vis Sci. 2008;49 doi: 10.1167/iovs.07-0968. [DOI] [PubMed] [Google Scholar]
- 44.McLaren JW, Bourne WM, Patel SV. Automated assessment of keratocyte density in stromal images from the Confoscan 4 confocal microscope. Invest Ophthalmol Vis Sci. 2010;51:1918–1926. doi: 10.1167/iovs.09-4186. [DOI] [PMC free article] [PubMed] [Google Scholar]
Associated Data
This section collects any data citations, data availability statements, or supplementary materials included in this article.
Supplementary Materials
Supplemental Movie 1: Movie showing orthogonal maximum intensity projections over a range of angles, rendered using the Surpass module of Imaris. A scan through an entire rabbit cornea is shown. Scan speed was 30 μm/sec and image acquisition rate was set to 30 frames/sec.
Supplemental Movie 2: Movie showing orthogonal maximum intensity projections over a range of angles, rendered using the Surpass module of Imaris. A set of registered images from the entire corneal stroma of a rabbit is shown. Scan speed was 30 μm/sec and image acquisition rate was set to 30 frames/sec.


