

Abstract
Long-term changes in brain gene expression have been identified in alcohol dependence, but underlying mechanisms remain unknown. Here, we examined the potential role of microRNAs for persistent gene expression changes in the rat medial prefrontal cortex after a history of alcohol dependence. Two-bottle free-choice alcohol consumption increased following 7-week exposure to intermittent alcohol intoxication. A bioinformatic approach using microarray analysis, qPCR, bioinformatic analysis, and microRNA-mRNA integrative analysis identified expression patterns indicative of a disruption in synaptic processes and neuroplasticity. 41 rat-microRNAs and 165 mRNAs in the medial prefrontal cortex were significantly altered after chronic alcohol exposure. A subset of the microRNAs and mRNAs was confirmed by qPCR. Gene ontology categories of differential expression pointed to functional processes commonly associated with neurotransmission, neuroadaptation, and synaptic plasticity. microRNA-mRNA expression pairing identified 33 microRNAs putatively targeting 89 mRNAs suggesting transcriptional networks involved in axonal guidance and neurotransmitter signaling. Our results demonstrate a significant shift in microRNA expression patterns in the medial prefrontal cortex following a history of dependence. Due to their global regulation of multiple downstream target transcripts, microRNAs may play a pivotal role in the reorganization of synaptic connections and long term neuroadaptations in alcohol dependence. microRNA-mediated alterations of transcriptional networks may be involved in disrupted prefrontal control over alcohol-drinking observed in alcoholic patients.
Keywords: alcohol, addiction, neuroadaptation, gene expression, microRNA, medial prefrontal cortex
Introduction
Alcohol dependence causes long lasting cellular alterations in the brain, and these are in part likely to be caused by persistent changes in gene expression1. Transcriptome profiling studies in humans and rodents have identified alcohol-induced changes in gene expression that are involved in multiple biological and cellular functions, including stress responses, G-protein coupled receptor signaling, neurotransmitter release and signaling, and protein trafficking 2–6. The medial prefrontal cortex (mPFC) is a key brain region in the cognitive control of alcohol-drinking behavior, and is susceptible to the long-term effects of chronic alcohol exposure 7–9. We and others have previously identified patterns of sustained gene expression changes in the mPFC induced by chronic alcohol exposure, consumption, and dependence 2–4, 10–13, but mechanisms that induce and maintain persistent changes in gene expression following alcohol exposure remain unknown.
Here, we began to explore the possible role of microRNAs (miRNAs) as mediators of brain gene expression changes induced by alcohol. miRNA:s are small (~22–30 nucleotide in length), highly conserved, non-coding RNA molecules that modulate gene expression at the post-transcriptional level. After Dicer processing, the 20–25 bp long imperfect duplex miRNA unwinds into a mature and a passenger strand (miR-star). The mature miRNAs bind to the miRNA recognition elements (MREs) in the 3′ UTR of their target mRNAs causing translational degradation or repression 14. The passenger strand is generally present in lower levels within the cell. It was initially thought that the passenger strand is rapidly degraded as a nonfunctional by-product 15, but it has recently been shown that the passenger strand can be fully functional, binding to its own MREs, and inhibiting the expression of its own set of mRNAs 16–19. Individual miRNAs are thought to target and regulate multiple mRNAs. Because of their potential to exert coordinated expression changes across entire sets of transcripts, miRNAs offer an interesting candidate mechanism for alcohol-induced changes in gene expression.
miRNAs are highly expressed in the brain and play an important role in a variety of biological processes, including neuronal differentiation 20, synapse formation and plasticity 21, homeostatic synaptic plasticity 22, and neuronal degeneration 23. Increasing evidence has shown that miRNAs may play a critical role in neuroadaptive processes triggered by chronic drug exposure 24. Recent data suggested that miRNAs may play a significant role in addiction-related behaviors, such as cocaine intake, nicotine dependence, morphine tolerance, and alcohol tolerance 25–28. Lewohl and colleagues recently identified 48 miRNAs that were up-regulated on post mortem analysis of frontal cortex of human alcoholics 11. Post mortem analysis of brain tissue from subjects with alcoholism provides an invaluable window on disruption of gene expression regulation in this disorder, but offers limited opportunities to isolate the consequences of brain alcohol exposure from those of pre-existing vulnerability factors, or of environmental influences associated with alcoholism such as e.g. head trauma or nutritional deficiency.
The use of controlled animal models complements human post mortem studies in that respect. The aim of the study was to identify miRNA expression changes and their potential gene targets in the mPFC after a history of alcohol dependence in an animal model. Here, we used an established rat model of alcohol dependence, which has been shown to result in a persistent escalation of subsequent voluntary alcohol intake, accompanied by equally long last lasting changes in gene expression 2, 29, 30. We used Affymetrix mRNA and miRNA arrays, identified miRNA and mRNA expression changes in the rat mPFC after a history of alcohol dependence, and confirmed these using quantitative real-time PCR (qRT-PCR). Gene Ontology (GO) analysis grouped the targeted mRNAs into categories involved in synaptic transmission, ion channels, trafficking, immune response, axonal guidance, and transcriptional regulation. Expression pairing suggested global regulatory effects of several miRNAs on their targeted mRNAs in the mPFC. These results identify miRNA-mRNA networks that may contribute to dysfunction of inhibitory control over behavior by the mPFC observed in alcohol addiction.
Methods
Subjects
Adult male Wistar rats weighing 300–500g at the outset of the experiment were housed in pairs in a temperature (21°C) and humidity-controlled environment with reversed 12 hour day-night cycles. Rats were given free access to chow and tap water throughout the duration of the experiment. The studies were conducted in accordance with the NIH Guide for Care and Use of Laboratory Animals. Two batches of animals were used that were uniformly treated with either intermittent alcohol vapor or air exposure. To confirm induction of escalated voluntary alcohol consumption without confounding subsequent expression analysis, two groups were randomly sampled from each batch, one for behavioral confirmation, and one for expression analysis (miRNA or mRNA). From batch 1, n = 4 per group were used for miRNA array expression profiling and qPCR confirmation and n = 10 per group for assessment of drinking behavior. From batch 2, n = 8 per group were used for mRNA expression profiling and qPCR confirmation, and n = 8–10 per group for drinking. Drinking data from batch 2 have already been reported (Sommer et al., 2008).
Ethanol Exposure
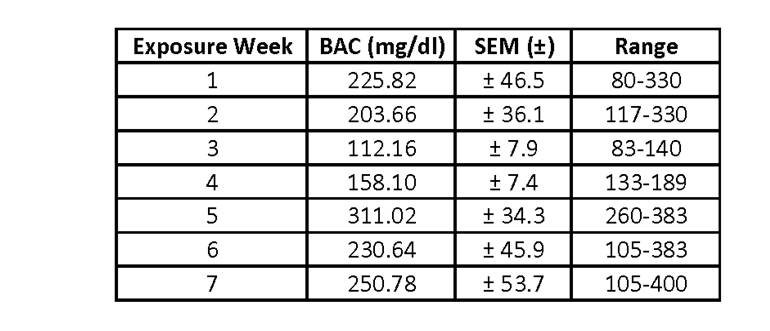
Rats were exposed to either intermittent alcohol vapor or normal air using an inhalation system as described previously 2. Briefly, rats were allowed to habituate to the chambers for 1 week, then exposed to low alcohol concentration for 1 week, and finally exposed for 7 weeks to daily cycles of alcohol intoxication and withdrawal. Weekly, rats were weighed, blood was collected from the lateral tail vein, and serum extracted and assayed for ethanol using a nicotinamide adenine dinucleotide phosphate dehydrogenase/spectrophotometric assay kit (Sigma Aldrich Inc., St. Louis, Missouri, USA) according to the manufacturer’s instructions. As previously published 29, alcohol vapor exposure resulted in daily cycles of blood alcohol concentrations (BAC) ranging from 0 to 200–380 mg/dl. Near the end of the exposure period, signs of withdrawal in the form of tail stiffness and piloerection were visible towards the end of the alcohol off phase. Withdrawal did not reach a severity at which withdrawal seizures are seen.
Ethanol Consumption
A subset of dependent and control animals (Batch 1: n = 10 per group) were subjected to a two-bottle choice paradigm to confirm alcohol dependence. Beginning one week after rats were removed from vapor, they were trained to drink 8% alcohol (wt/vol) in 0.2% saccharin over two weeks and consumption was measured for ten consecutive days in a 24-hour access two-bottle free choice paradigm with 8% alcohol (wt/vol) in 0.2% saccharin solution, or 0.2% saccharin solution only, as described 2. Daily alcohol intake was averaged over 2 weeks and compared by t-test.
Brain Extraction
For expression analysis, randomly sample rats were sacrificed 3 weeks after exposure. Post-dependent rats and controls (batch 1: n = 4 per group; batch 2: n = 8 per group) were decapitated between 10 am –3 pm. Brains were removed, frozen in −40°C isopentane and kept at −80°C. Bilateral samples from medial prefrontal cortex (including Cg1+2, PL and IL according to 31 were dissected out with a scalpel from a 2 mm coronal slice under a magnifying lens using anatomical landmarks as described 32. Samples were weighed and stored at −80°C until RNA was prepared.
miRNA Isolation and miRNA Expression Profiling
miRNAs were isolated from Batch 1 samples using the mirVana miRNA Isolation kit (Ambion Life Technologies; Foster City, CA, USA). Total RNA quantity was measured on the NanoDrop (ThermoScientific; Wilmington, DE, USA). 200ng of total RNA was used for the hybridization procedure. The miRNAs were ligated to a biotinylated signal molecule using the FlashTag Biotin HSR RNA Labeling Kit (Genisphere; Hatfield, PA, USA). The miRNAs were hybridized for 16 hours at 48°C to Affymetrix miRNA arrays (Affymetrix; Santa Clara, CA, USA) in the Affymetrix Hybridization Oven 645. The Affymetrix miRNA arrays were washed in the Fluidics Station 450 using fluidics script FS450_0003 and scanned on a GeneChip Scanner 3000 7G System (Affymetrix, Santa Clara, CA, USA). Eight chips passed the quality control. After scanning, the data were log base 2 transformed, normalized and tested for quality control using the miRNA QC Tool software. Statistical differences between groups were performed using the Partek Genomics Suite (Partek Inc.; St. Louis, MO, USA). Robust Multichip Average (RMA) expression values were obtained and tested for differential gene expression using Welch’s Two-Sample t-test assuming unequal variances, at a p<.05 threshold. False discovery rate (FDR) was assessed on all probe sets using the method of Benjamini and Hochberg 33. The Affymetrix miRNA microarray contained probes targeting miRNAs from over 45 different species including Caenorhabditis elegans, Drosophila melanogaster, Danio rerio, mouse, rat, and human. Principle Component Analysis (PCA) from Partek Genomics Suite (Partek Inc.; St. Louis, MO, USA) was used to determine the variance between the individual samples. The PCA is run as an R-Analysis in which the variables (p) are put in a pxp dispersion matrix (covariance) of variables where each transformed observation is represented by its principle components (PC).
miRNA quantitative Real Time (qRT-PCR)
From the same set of samples (Batch 1) real-time-PCR analysis of miRNA expression levels was performed using the TaqMan miRNA Reverse Transcription Kit (Ambion Life Technologies; Foster City, CA, USA) and assayed in triplicate. For all reactions, 10ng of total RNA for miRNA analysis was used. Reactions were normalized to the U6 endogenous control and comparison between groups was made using the 2–ΔΔCt method, in which threshold cycle (Ct) is the cycle at which there is a significant detectable increase in fluorescence; the ΔCt value is calculated by subtracting the Ct value for the endogenous control from the Ct value for the miRNA of interest. The ΔΔCt value is calculated by subtracting the ΔCt value of the control sample from the ΔCt of the experimental sample. For graphical interpretation, the ΔΔCt values were transformed (−x), thus downregulated genes show ΔΔCt < 0 and upregulated genes ΔΔCt > 0. The −ΔΔCt values were compared by an unpaired t-test for each gene or microRNA (p < 0.05 = significance; p <0.07 = trend).
mRNA Isolation and mRNA Expression Profiling
Total RNA was extracted from Batch 2 samples with Trizol reagent (Gibco BRL Life Technologies, Baltimore, MD, USA) followed by an RNeasy (Qiagen, Hilden, Germany) column based clean-up step according to the manufacturer’s instructions. All RNA samples showed A260/280 ratios between 1.9 and 2.1. RNA integrity was determined using an Agilent 2100 Bioanalyzer (Agilent Technologies, CA, USA), and only material without signs of degradation was used. Target preparation was done for individual samples and hybridization to RAE230A arrays, staining, washing and scanning of the chips were performed according to the manufacturer’s technical manual (Affymetrix, Santa Clara, CA, USA). The Microarray Analysis Suite 5.0 (MAS5) produced CEL-files were inspected for regional hybridization bias and quality control parameters as described 34. Sixteen chips passed the quality control. The MAS5 recognized approximately 60% of the 15,800 probe sets on the RAE230A array as present in our samples. CEL-files were imported into the Partek Genomics Suite. The data were log2 normalized. RNA expression values were obtained and tested for differential gene expression using Welch’s Two-Sample t-test assuming unequal variances, at a p<.05 threshold. Consistent with previous microarray studies investigating mRNA changes after prolonged exposure to alcohol, we did not employ a false discovery rate (FDR) calculation, but rather chose a cutoff fold-change value of 1.2 35.
mRNA qRT-PCR
From the same set of samples (Batch 2), 100ng total RNA was reverse transcribed using the High Capacity RNA-to-cDNA Master Mix [Applied Biosystems (ABI), Darmstadt, Germany] following the manufacturer’s protocol. Samples were assayed in triplicate in a total reaction volume of 20μl using Power SYBR®Green PCR Master Mix (ABI) on an ABI 7900 HT RT-PCR System (40 cycles of 95° C for 15 sec and 60° C for 1 min). A melting profile was recorded at the end of each PCR to check for aberrant fragment amplifications. Primers for each target were designed toward the 3′ end of the coding sequence by considering exon-exon junctions when possible based on National Center for Biotechnology Information (NCBI) reference sequence database. Amplicons were designed with 95–110bp length and melting temperatures > 75°C to be able to distinguish between amplicons and primer-dimer formations in the melting analysis. For primer sequences see Supplemental Table 1. ABI’s SDS 2.2.2 software was used to analyze the SYBR Green fluorescence intensity and to calculate the theoretical cycle number when a defined fluorescence threshold was passed (Ct-values). Relative quantification was done according to the ΔΔCT method as described above, whereby beta-actin (Actb) was used as internal control. Actb Ct-values were not different between groups. Due to its complex pattern of splice variations, BDNF was assayed using a TaqMan assay as described previously 36. Probe sequences labeled with the reporter dye 6-caroxyflourescin (FAM) were: CTTCCCGGGTGATGCTCAGCAGT for BDNF and ATCAAGATCATTGCTCCTCCTGAGCGC for Actx. Statistical testing and graphical representation was done on the −ΔΔCT values as described above.
Higher Order Bioinformatic Analysis
Candidate miRNAs and mRNAs were further explored using bioinformatics analysis. Ingenuity Pathway Analysis (IPA) is an online-based bioinformatics tool that places candidate miRNAs and mRNAs into canonical pathways, gene networks, and explores gene-gene and miRNA-gene interactions using statistical criteria. All significant biological themes associated with gene and miRNA networks, canonical pathways, and biological functions were subsequently cross-validated using Kyoto Encyclopedia of Genes and Genomes (KEGG; www.genome.jp/kegg), GO Consortium (www.geneontology.org), and Database for Annotation, Visualization and Integrated Discovery (DAVID; http://david.abcc.ncifcrf.gov). DAVID was used to determine Gene Ontology (GO) categories37. Significance and filter criteria were set at a p < 0.05 using the Benjamini-Hochberg method (B-H) and FDR 20%. The DAVID background settings were as follows: Rattus Norvegicus was chosen as the species background and the Rat Genome RAE230A Array was chosen for the Affymetrix 3′ IVT background.
Integrative Analysis of miRNA and mRNA Microarray Data
miRNA target analysis was conducted using the microRNA.org website38. The most current set of target site predictions were obtained for rat, including both conserved and non-conserved miRNAs. These predictions were then matched, where possible, to the 165 differentially regulated mRNAs and the 41 differentially expressed miRNAs determined in the earlier expression profiling analyses. Good miRSVR and PhastCon scores based on algorithms in microRNA.org were used to determine predicted miRNA-mRNA interactions39. The scores determined proper association of miRNA expression patterns with our experimentally observed mRNA expression results. Targets were prioritized based on information provided by DAVID Go Ontology analysis as well as miRNA-mRNA expression pairing where the miRNA and mRNA expression was changed in the opposite direction.
Results
Increased Alcohol Consumption Following a History of Dependence
Post-dependent animals were exposed to alcohol vapor for 7 weeks, maintaining a BAC level between 150–400 mg/dl (Supplemental Table 2). Although there is some batch to batch variability, subsequent voluntary alcohol consumption in the two-bottle choice paradigm (2 or 3 weeks after vapor exposure, batch 1 and 2, respectively) was similarly and significantly increased, approximately by 2-fold, in post-dependent animals compared to their respective controls [Batch 1 (miRNA cohort): 1.75 ± 0.26 vs. 0.9175 ± 0.207; (t = 2.465, df = 18) p = 0.024][ Batch 2 (mRNA cohort): 3.8 + 0.35 vs. 1.44 +0.28; F(2,30)=17.5, p < 0.001, as reported in 29].
PCA of miRNA and mRNA expression profiles
We analyzed expression data for global treatment effects by applying PCA to all data points (Figure 1). PCA is useful for identifying major group effects and outliers within the dataset. This analysis clearly identified treatment as the biggest source of variation for the miRNA data (Figure 1, left panel), while the global effect of treatment was not as strong for the mRNA data (Figure 1, right panel). Accordingly, the total amount of variance explained within the miRNA data set was 62.8% (PC#1 = 28.7%, PC#2 = 20.4%, and PC#3 = 13.7%). The total amount of variance explained within the mRNA data set was 35.4% (PC#1 = 14.8%, PC#2 = 10.8%, and PC#3 = 9.8%). At a global level, these data suggest that a history of alcohol dependence leads to greater changes in miRNA expression than in that of mRNAs.
Figure 1. Principal Component Analysis of individual animals for the miRNA and mRNA array.

The post-dependent animals are denoted by the blue circles, and the control animals are denoted by the red circles. The ellipse surrounding the two treatment groups identifies variation in mRNA and miRNA expression patterns among samples no more than 2 standard deviations away from the mean. The lines connect to a centroid (denoted by a blue or red ball circled in yellow) to connect similar groups. The x, y, and z axes represent the first 3 largest variable principle components (PC#1, PC#2, and PC #3) accounting for the majority of the variance within the dataset. The left panel represents the miRNA PCA analysis and the right panel represents the mRNA (gene) PCA analysis.
Alcohol Dependence Alters miRNA Expression Profiles in the mPFC
We identified 41 rat (rno)-miRNAs significantly altered in the mPFC after a history of alcohol dependence (p < 0.05, Fold Change +/− 1.2, FDR < 5%). Among these differentially expressed miRNAs, 17 were significantly upregulated and 24 were significantly downregulated. Expression values for all 41 significantly altered miRNAs from individual animals were clustered, and a heat map was derived using k-means clustering (Figure 2, left panel). As expected, expression data fell into 2 main clusters, with members from the control and the post-dependent group, respectively. Supplemental Table 3 contains the full list of significantly altered miRNAs.
Figure 2. Hierarchical clustering of differential expressed miRNA and mRNA from post-dependent rats and controls.
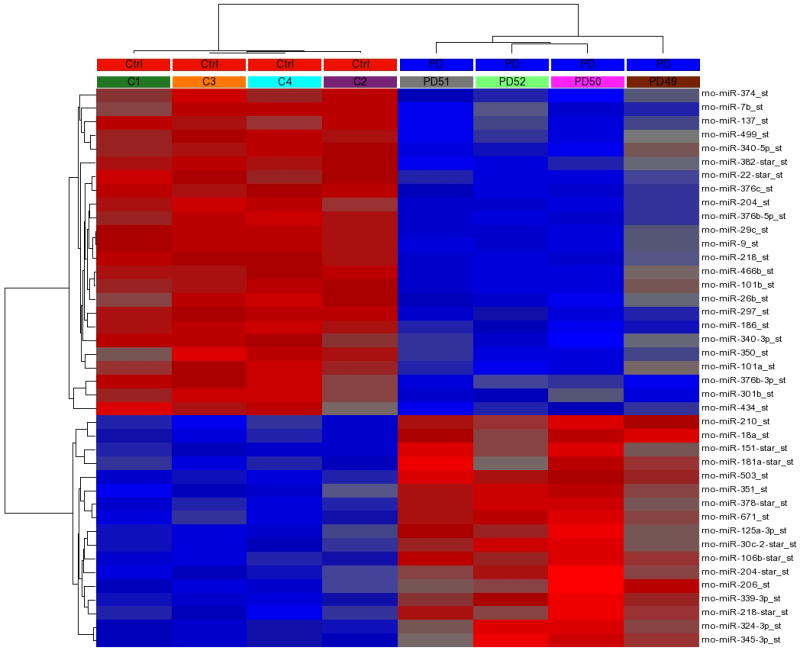

Rows: individual miRNAs or mRNAs; columns: individual samples. Blue boxes at the top of the heat map labeled PD represent post dependent animals; red boxes at the top of the heat map labeled Ctrl represent control animals. Boxes beneath the PD and Ctrl labels represent individual rat numbers. Red within the heat map represents gene or miRNA upregulation, blue within the heatmap represents gene or miRNA downregulation. Left Panel: The heatmap contains 41 miRNAs with significant different expression (p < 0.05). Right Panel: The heatmap contains 165 mRNAs with significant different expression (p < 0.05). Refer to Supplemental Table 3 & 4 for p-values and fold change for each miRNA and mRNA displayed here.
Alcohol Dependence Alters mRNA Expression in the mPFC
mRNA expression profiling identified 165 genes with significantly altered expression in the mPFC after a history of alcohol dependence (p < 0.05, Fold Change +/− 1.2). Among these, 105 genes were significantly upregulated and 60 genes were significantly downregulated. Supplemental Table 4 presents the full list of significantly altered genes. The fold changes in gene expression were relatively small (+/− 1.2 – 1.7), which is consistent with what has typically been found for brain expression changes in psychiatric disorders, including alcohol dependence 34. Expression values for all 165 significantly altered transcripts from individual animals were clustered, and a heat map was derived using k-means clustering (Figure 2, right panel). Although less clear-cut than the miRNA clustering analysis, this procedure generally segregated the gene expression data into 2 main clusters based on treatment (control vs post-dependent). Importantly, 37 of the 165 genes have been previously associated with alcohol use, abuse, and dependence (References provided in Supplemental Table 4), providing support for a biological significance of our array data. Used Gene Ontology Analysis, we found the top significant categories to be associated with myelination, ion channels, synaptic transmission and plasticity. Overall, 90 of the 165 differentially regulated genes belonged to significantly overrepresented GO categories. The top 15 significant, non-redundant categories are shown in Table 1, and the full list of significant categories is provided in Supplemental Table 5. The mRNAs were also examined using Ingenuity Pathway Analysis to identify possible associations of the experimental results with known biological functions, diseases, and canonical pathways. Ten canonical pathways and biological functions were identified to be significant, using a right-tailed Fisher Exact test. Four of these pathways are suggestive of neuroadaptation related processes: corticotropin releasing hormone signaling, neurotrophin/TRK signaling, axonal guidance signaling, and G-protein coupled receptor signaling. Three of the top significant biological functions included neurological disease, psychological disorders, and nervous system development and function. The list of significant biological functions (significant threshold = p < 0.05) and canonical pathways (significant threshold = −log(p-value) > 1.3) can is provided seen in Supplemental Table 6.
Table 1. Top 15 GO Functional Enrichment Analysis for the List of 165 Significantly Altered mRNAs.
(p < 0.05, B-H, FDR < 0.2). Cells shaded in gray represent a GO category that reached significance with p < 0.05 and a B-H corrections, however were unable to meet significance with an FDR of 20%.
| Category | Term | Term Description | Genes | Hit In List | Hit in Query | p-value | B-H | FDR 20% |
|---|---|---|---|---|---|---|---|---|
| Biological Process | GO:0019226 | transmission of nerve impulse | PLP1, EGR2, MAL, PRKCG, MBP, CD9, BDNF, ASPA, SLC17A6, SYN2, PLLP, UGT8, CORT, PMP22, DRD1A, CACNA1B | 16 | 283 | 1.11E-07 | 3.08E-05 | 1.83E-04 |
| Biological Process | GO:0042391 | regulation of membrane potential | CD9, PLP1, ASPA, BDNF, EGR2, PLLP, MAL, UGT8, PMP22, DRD1A, MBP | 11 | 153 | 2.56E-06 | 5.89E-04 | 0.004213 |
| Biological Process | GO:0051969 | regulation of transmission of nerve impulse | EGR1, TF, ARC, BDNF, EGR2, PTGS2, SYN2, CALB1, HTR2C, DRD1A, CACNA1B | 11 | 176 | 8.95E-06 | 0.001764 | 0.014721 |
| Biological Process | GO:0044057 | regulation of system process | EGR1, TF, ARC, EGR2, PTGS2, TACR3, HSPA1A, CALB1, BDNF, SSTR2, SYN2, DRD1A, HTR2C, CACNA1B | 14 | 319 | 1.49E-05 | 0.002564 | 0.024459 |
| Biological Process | GO:0006873 | cellular ion homeostasis | TF, PLP1, EGR2, WFS1, MAL, LPAR1, MBP, CD9, BDNF, ASPA, PLLP, UGT8, PMP22, DRD1A, CAR2 | 15 | 370 | 1.58E-05 | 0.002424 | 0.026015 |
| Biological Process | GO:0007610 | behavior | EGR1, EGR2, PTGS2, ENPP2, WFS1, CNP, PRKCG, NR4A3, CALB1, CXCL12, FOS, BDNF, CORT, DRD1A, HTR2C, CACNA1B | 16 | 424 | 1.71E-05 | 0.002144 | 0.02812 |
| Biological Process | GO:0010001 | glial cell differentiation | SOX10, PLP1, ASPA, EGR2, TSPAN2, GSN, DRD1A | 7 | 59 | 2.36E-05 | 0.0025 | 0.038756 |
| Biological Process | GO:0010033 | response to organic substance | EGR1, TF, IRS2, EGR2, TACR3, GATM, PTGS2, KLF10, COL3A1, HSPA1A, NR4A3, CXCL12, JUNB, DDR1, FOS, DUSP1, GSN, STEAP2, HTR2C, DRD1A, CRYM, CAR2, CACNA1B, DNAJB5 | 24 | 928 | 3.07E-05 | 0.003025 | 0.050514 |
| Biological Process | GO:0019725 | cellular homeostasis | TF, PLP1, EGR2, SLC12A2, WFS1, MAL, LPAR1, MBP, CD9, BDNF, ASPA, PLLP, UGT8, PMP22, DRD1A, CAR2 | 16 | 453 | 3.69E-05 | 0.003181 | 0.060708 |
| Biological Process | GO:0048167 | regulation of synaptic plasticity | EGR1, ARC, BDNF, EGR2, PTGS2, CALB1, DRD1A | 7 | 81 | 1.42E-04 | 0.010295 | 0.233931 |
| Cellular Component | GO:0005886 | plasma membrane | GYPC, PTGS2, TACR3, GNA12, TNFSF13, LPAR1, GPR88, CXCL12, VCL, MBP, S1PR5, SLC4A2, KCNG3, NT5E, ARC, IRS2, STXBP3, DDR1, SSTR2, NPTXR, CLIC4, COL1A2, VAMP1, PMP22, STEAP2, TF, APH1A, LITAF, KCNA1, HSPA1A, GJC2, FXYD6, CD9, CDC42EP2, CDC42EP1, SYN2, GPNMB, CAR2, MAG, PLP1, SLC12A2, MYO1D, NTNG1, MCAM, HOMER1, GJB1, ACCN1, SLC6A9, FNBP1, SLC17A6, P2RX6, GPR37, SCN4B, HTR2C, DRD1A, CACNA1B | 56 | 2396 | 4.70E-10 | 1.03E-07 | 5.98E-07 |
| Cellular Component | GO:0044459 | plasma membrane part | TF, TACR3, APH1A, PTGS2, LITAF, GNA12, KCNA1, HSPA1A, TNFSF13, GJC2, VCL, MBP, CD9, SYN2, SLC4A2, KCNG3, GPNMB, CAR2, PLP1, ARC, SLC12A2, MYO1D, NTNG1, STXBP3, HOMER1, GJB1, ACCN1, DDR1, FNBP1, SLC6A9, P2RX6, SLC17A6, SCN4B, VAMP1, PMP22, DRD1A, HTR2C, CACNA1B | 38 | 1358 | 1.80E-08 | 1.98E-06 | 2.29E-05 |
| Cellular Component | GO:0043209 | myelin sheath | MAG, PLP1, PLLP, PMP22, MBP | 5 | 15 | 1.43E-05 | 7.87E-04 | 0.01822 |
| Cellular Component | GO:0042995 | cell projection | S100A4, ARC, TACR3, WFS1, MYO1D, GNA12, FBXO2, PRKCG, HOMER1, MBP, NOV, ACCN1, P2RX6, CLIC4, GSN, DRD1A, NEFM, CAR2, CACNA1B | 19 | 727 | 5.30E-04 | 0.019237 | 0.672088 |
| Molecular Function | GO:0019911 | structural constituent of myelin sheath | PLP1, MOBP, TSPAN2, MAL, MBP | 5 | 5 | 3.24E-08 | 1.02E-05 | 4.36E-05 |
Integrative Analysis of miRNAs and mRNAs
It is currently thought that miRNA expression levels are generally inversely correlated with those of their respective mRNA targets 14. To detect coordinated patterns of miRNA and mRNA expression changes induced by alcohol dependence we performed miRNA-mRNA expression pairing analysis, i.e. we identified cases where a miRNA species and their putative target mRNAs were changed in the opposite direction. We found 33 miRNAs targeting 89 mRNAs (Table 2) within our datasets that fulfilled this condition. The details of the expression pairing analysis are given in Supplemental Table 7. Gene Ontology analysis was performed on these 89 mRNAs to examine their functional relationships. Significantly enriched GO categories (p < 0.05; B-H and FDR 20%) are denoted in colors next to the mRNAs (Table 2) and are related to functional processes commonly associated with neurotransmission, neuroadaptation, and synaptic plasticity. The details of the GO analysis are given in Supplemental Table 5. A composite score was created for each mRNA based on the pre-computed mirSVR score for their targeted miRNA found on the miRanda database (Supplemental Table 7, Column AQ). mirSVR scoring is a regression method for predicting the probability of mRNA down-regulation from sequence and structure features in microRNA/mRNA predicted target sites 39. The composite score for each gene represents the sum of all archived mirSVR scores across the observed miRNAs and the potential inhibition factor that one gene could have from multiple microRNAs39.
Table 2. Expression Pairing of miRNA-mRNA interactions.
miRNA expression analysis was carried out by identifying the miRNA species and their putative target mRNAs that were changed in the opposite direction. The target genes were run through DAVID gene ontology analysis; the colored boxes on the left represent an upregulated miRNA (red) and a down regulated miRNA (blue); the corresponding arrow in the next column on the left represents either upregulation (up arrow) or downregulation (down arrow) for the miRNAs, the arrow on the right in the same column represents either upregulation (up arrow) or downregulation (down arrow) for the mRNAs; the colored boxes on the right represent enriched gene ontology categories including (p > 0.05, B-H, FDR 20%): 1. Regulation of synaptic transmission; 2. Myelination 3. Regulation of synaptic plasticity 4. Neuron projection 5. Synaptic transmission 6. Plasma membrane 7. Cell-cell signaling 8. GPCR signaling 9. Axon guidance. Bold lettering represents PCR confirmed mRNAs and miRNAs. Refer to Supplemental Table 3 & 4 for p-values and fold change for each miRNA and mRNA displayed here.
| Gene Ontologies | |||||||||||
|---|---|---|---|---|---|---|---|---|---|---|---|
| miRNA | Expn Pairing | Gene Symbol | 1 | 2 | 3 | 4 | 5 | 6 | 7 | 8 | 9 |
| rno-miR-106b-star |
|
Per2, Sstr2 | |||||||||
| rno-miR-125a-3p |
|
Accn1, Cxcl12, Fos, Nov, Sstr2, Syn2 | |||||||||
| rno-miR-151-star |
|
Cxcl12, Egr1, Junb | |||||||||
| rno-miR-18a |
|
Cxcl12, Gpr88, Gypc, Kcng3, Nr4a3, Tacr3 | |||||||||
| rno-miR-204-star |
|
Accn1, Egr4, Fos, Kcng3, Prkcg, Rgs12, Sstr2 | |||||||||
| rno-miR-206 |
|
Bdnf, Nr4a3 | |||||||||
| rno-miR-210 |
|
Bdnf, Cxcl12, Gypc, Nptxr | |||||||||
| rno-miR-218-star |
|
Bdnf, Calb1, Cxcl12, Nr4a1, Nr4a3 | |||||||||
| rno-miR-30c-2-star |
|
Arc, Cxcl12, Per2, Prkcg | |||||||||
| rno-miR-324-3p |
|
Arc, Cxcl12, Egr2, Klf10, Rgs12, Tacr3 | |||||||||
| rno-miR-351 |
|
Bdnf, Cacna1b, Syn2 | |||||||||
| rno-miR-378-star |
|
Egr2, Gpr88, Klf10 | |||||||||
| rno-miR-503 |
|
Bdnf, Cxcl12, Nr4a1 | |||||||||
| rno-miR-101a |
|
Plp1, Slc12a2, Slc17a6, Stxbp3, Tspan2, Ugt8 | |||||||||
| rno-miR-1O1b |
|
Cdc42ep2, Gpd1, Plp1, Slc12a2, Slc17a6, Stxbp3, Ugt8 | |||||||||
| rno-miR-137 |
|
Mbp, Mobp, Myo1d, Plp1, Scn1b, Slc12a2, Slc17a6, Tspan2, Vamp1 | |||||||||
| rno-miR-186 |
|
Aspa, Bcas1, Car2, Carhsp1, Cdc42ep2, Gjb1, Gpr37, Mobp, Ngb, Pbld, Plp1, Slc12a2, Tnfsf13, Tspan2 | |||||||||
| rno-miR-204 |
|
Aph1a, Lpar1, Mag, Nt5e, Plp1 | |||||||||
| rno-miR-218 |
|
Car2, Csrp2, Fermt2, Gpd1, Scn4b, Slc12a2 | |||||||||
| rno-miR-22-star |
|
Csrp1, Mog, Nrep, Olig1, Plp1, Ugt8, Vamp1 | |||||||||
| rno-miR-26b |
|
Bcas1, Lpar1, Plp1, Slc12a2, Ugt8, Vamp1 | |||||||||
| rno-miR-29c |
|
Carhsp1, Fermt2, Gpr37, Mobp, Mog, Myo1d, Nefm, Nt5e, P2rx6, Plp1, Pmp22, Scn4b | |||||||||
| rno-miR-301b |
|
Fermt2, Gpr37, Mid1ip1, Plp1, Slc17a6, Tspan2, Ugt8 | |||||||||
| rno-miR-340-5p |
|
Aph1a, Aspa, Fermt2, Mid1ipl, Myo1d, Plp1, Pmp22, S1pr5, Scn4b, Slc12a2 | |||||||||
| rno-miR-350 |
|
Aph1a, Bcas1, Car2, Carhsp1, Fermt2, Lpar1, Mid1ipl, Mobp, Nrep, Nt5e, Slc17a6, Slc6a9, Sox10, Ugt8 | |||||||||
| rno-miR-374 |
|
Aspa, Lpar1, Nt5e, Pllp, Stxbp3, Ugt8 | |||||||||
| rno-miR-376b-3p |
|
Cdr2, Fermt2, Mbp, Pmp22, Slc17a6 | |||||||||
| rno-miR-376b-5p |
|
Bcas1, Lass2, Lpar1, Slc17a6 | |||||||||
| rno-miR-376c |
|
Fermt2, Ngb, Nrep, Plp1, Pmp22, Sirt2, Stxbp3, Tnfsf13, Tspan2, Vamp1 | |||||||||
| rno-miR-382-star |
|
Aspa, Car2, Cdr2, Gpr37, Lpar1, Mettl7a, Mid1ip1, Plp1 | |||||||||
| rno-miR-466b |
|
Cnp, Gjb1, Gpd1, Lpar1, Mog, Pmp22, Slc17a6 | |||||||||
| rno-miR-7b |
|
Lpar1, Mal, Mettl7a, Plekhb1, Scn4b, Sox10, Tspan2 | |||||||||
| rno-miR-9 |
|
Cdr2, Gpnmb, Kcna1, Mettl7a, Mobp, Myo1d, Nefm, P2rx6, Pmp22, Vamp1 | |||||||||
The 89 transcripts potentially regulated by miRNAs were subjected to Ingenuity Pathway Analysis to explore potential regulatory networks based on gene-gene and mRNA-miRNA interactions described in the literature. Figure 3 shows a network created by the Ingenuity algorithm. 15 of the 25 transcripts in this network are either up (4) or downregulated (11) in the mPFC of post-dependent rats. The top functions of this network include DNA replication, recombination and repair, cell cycle, and regulation of gene expression. This particular network is of interest because it contains multiple genes thought to be involved in neuropsychiatric disorders and addiction, including BDNF 40, Fos 30, 41, 42, Per2 43, and Arc 44, Nr4a145, Nr4a3 46. Furthermore, the 15 differentially expressed mRNAs within this network are targeted by 26 of the miRNAs found in the miRNA microarray experiment. Many of these miRNAs target some of the same mRNAs. This is important because miRNAs have the capacity to work either synergistically or competitively to modulate mRNA expression 47, 48.
Figure 3. Regulatory Network of Genes altered by alcohol Dependent mRNAs and their targeted miRNAs.

A) Represents a gene regulatory network constructed from the alcohol-dependent mRNA set Edges (lines) connecting nodes (genes) represent regulatory interactions such as regulation of gene expression, protein-protein interactions, protein-nucleic acid interactions, protein- hormone interactions. Up regulated genes are indicated in red, unchanged in gray, and down regulated in blue. Bold lettering represents PCR confirmed genes or miRNAs. B) Represents 13 genes in (A) targeted by miRNAs within the array dataset. * represents the microRNA passenger strand: star composite scores were compiled from Supplemental Table 7. Bold lettering represents PCR confirmed genes or miRNAs. Refer to Supplemental Table 3 & 4 for p-values and fold change for each miRNA and mRNA displayed here.
Confirmation of mRNA and miRNA Microarray Expression Data with qRT-PCR
Based on the analyses above we chose subsets of differentially expressed miRNAs and mRNAs for verification of differential expression by quantitative real-time PCR. Selection of candidates considered the robustness of the microarray findings and the suggested role in the above described network. Candidate miRNAs and mRNAs were chosen for confirmation by qRT-PCR based on their involvement in pathways previously shown to be regulated by drug use and addiction. Candidate mRNAs were also chosen on the basis of their predicted binding to significantly altered miRNAs. The miRNAs qRT-PCR results were generally consistent with the microarray data (Figure 4). For mRNA confirmation the outcome was more variable. Specifically, Per2 failed to reach significance threshold (p < 0.05) in the PCR assay, although it showed a trend in the expected direction.
Figure 4. rtPCR results for miRNA (top panel) and mRNA (bottom panel).

Confirmation of selected miRNA and mRNA with RT-PCR. (A, B) Representation of the negative delta delta cycle threshold (−ΔΔCT) ± SEM of selected (A) miRNAs or (B) mRNAs, expressing the change in cycle thresholds from treatment to controls compared back to an endogenous control . *p<0.05, **p<0.01, ***p<0.001. Downregulated genes show value < 0, upregulated genes are > 0. Refer to Supplemental Table 3 & 4 for comparable microarray p-values and fold change for each miRNA and mRNA displayed here.
Discussion
The most salient finding of the present study was a robust change in global miRNA expression in the mPFC of rats following a history of alcohol dependence. Furthermore, our analysis suggests that miRNA-mRNA networks may be involved in the neuroadaptations that are associated with the post-dependent state, and that ultimately impact behavior. These findings offer candidate targets for future in vitro and in vivo studies aimed at determining the functional role of miRNA-mRNA networks in neuronal function and addiction-related behaviors.
To our knowledge, this is the first study to investigate brain miRNA expression in protracted abstinence49 from alcohol dependence, a stage that in human alcohol dependent subjects is associated with emergence of alcohol craving and high relapse risk. Notably, miRNA profiles from post-dependent and control animals segregated into clearly separable clusters. This observation was unexpected, given prior experience from transcriptome studies in animal models of alcohol dependence, which have typically shown a high degree of overlap between post-dependent and control animals3, 4, 50, 51. Detection of treatment effects on expression profiles by variance partitioning approaches such as PCA has generally been a challenge in neuropsychiatric conditions and corresponding animal models, including alcoholism related phenotypes 34, 52. The lower complexity of the microRNA pool compared to the transcriptome is expected to facilitate the partitioning of expression profiles by this type of approach. In addition, however, our data may indicate that concerted expression of larger miRNA groups is more sensitive to alcohol effects than is the expression of coding transcripts.
miRNAs have been implicated in cocaine intake and escalation 27, 53, nicotine stimulation 54 and alcohol tolerance 25, and were also recently profiled in post mortem brain tissue from human alcoholics11. In comparison to the latter study, we found an overlap of 10 miRNAs whose expression was altered following alcohol dependence both in rats in humans: miR-18a, miR-339-5p, miR-7, let-7f, miR-101, miR-376c, miR-152, miR-374b, and miR-380. While it is important to note that we found overlapping miRNAs, it does not necessarily signify that the targeted mRNAs within our dataset are identical. This is due to the fact that the 3′UTR RNA sequences are not highly conserved between rat and humans, indicating that miRNAs may bind to different regions within the rat and human 3′UTR and inhibit different protein coding transcripts.
miR-9, which was down-regulated in the mPFC of post-dependent rats in our study, is of particular interest in light of recent in vitro studies suggesting its involvement in mediating responses to acute and chronic alcohol exposure. Acute treatment of organotypic neuronal cultures with 20 mM alcohol (around the legal intoxication limit) for up to 24h was found to significantly upregulate miR-9 levels, and contribute to alcohol tolerance by altering the subunit composition of the large-conductance calcium- and voltage-activated potassium (BK) channel 25. However, 5 day exposure to higher alcohol concentrations, equivalent to those attained in alcoholics (70mM), as well as in our rats, instead inhibited miR-9 expression 48, which is in agreement with our ex vivo findings. Potential miR-9 targets within our data set include Cdr2, Gpnmb, Kcna1, Mettl7a, Mobp, Myo1d, Nefm, P2rx6, Pmp22, Vamp1, which are all of functional interest (Table 2). This suggests that miR-9 could have the ability to fine-tune the expression of an entire gene network involved in the development of alcohol dependence. Future studies are necessary to elucidate how alcohol dependence alters miR-9 expression within neuronal populations in vivo and how this may affect downstream networks and functional output.
We identified multiple mRNAs with altered expression in the mPFC of post-dependent rats. Sixty two of these 165 mRNAs have been shown to play a role in neuropsychiatric disorders or drug use and addiction. Furthermore, 37 of the 165 mRNAs have been previously associated with alcohol use, abuse, or dependence (for references, see Supplemental Table 4). The molecular mechanisms involved in chronic alcohol use affect a variety of neurotransmitter systems 55. Chronic alcohol consumption most likely entails remodeling of synaptic connections within these neurotransmitter systems, a process that is dependent on changes in gene expression 56. Moreover, adaptations to alcohol may bear resemblance to the brain plasticity that occurs during chronic exposure to other drugs of abuse including heroin and cocaine 57, 58. In the mPFC of post-dependent rats, we found differential expression of genes involved in the dopamine (Drd1a, Qdpr, Gpr88, Prkc), serotonin (Htr2c, Qdpr), and glutamate (Homer1, Slc17a6, Rgs12) signaling pathways. Interestingly, there is substantial overlap between the genes found here and a recently identified common gene network that is downregulated in the brain of mice after protracted abstinence from several drugs of abuse including morphine, nicotine, tetrahydrocannabinol, and alcohol 59. Also, gene ontology and pathway analysis pointed independently and robustly to multiple neuroadaptation-related functions, implicating myelination, axon guidance and neurotransmitter signaling processes, and involving genes such as Arc, CamkIIA, Gna12, Homer1, Ngdn, Prkcg, Syn2, Syngr2, Syt17, Unc5b, Vamp1. Together, these analyses suggest that neuroadaptations occur within these neurochemical systems during chronic brain alcohol exposure, and persist in its aftermath.
The global regulation exerted by miRNAs, and their ubiquitous nature may offer a mechanism behind the wide-ranging changes in gene expression observed following alcohol dependence. Many miRNAs are expressed in neurons or glia in a region-specific manner, making them plausible candidates regulating multiple mRNAs in distinct brain circuits. A number of miRNAs identified here (miR-485, miR-206, miR-106b-star, miR-101, miR-186; Supplemental Table 3) regulate mRNAs involved in synaptic plasticity and neurotransmission, which may contribute to the reorganization of synaptic inputs and long term neuroadaptations underlying alcohol dependence. Using expression pairing based on the inverse relationship between miRNAs and their targets; we identified substantial numbers of putative miRNA-mRNA pairs (Table 2). This analysis pointed to a regulatory transcriptional network involving Brain Derived Neurotrophic Factor (BDNF) signaling.
BDNF is an activity regulated neurotrophin with a widespread expression throughout the brain, and is thought to be involved in the pathogenesis of depression36, 60. Our study identified BDNF as a putative target of miR-206. Analysis using microRNA.org revealed 2 conserved target sites for miR-206 in the 3′UTR of the BDNF transcript, position 200 and 378. A functional relevance of this observation is supported by prior observations that BDNF expression was repressed by miR-206 in a 3′UTR reporter assay, and that an inhibitor of miR-206 was able to reverse the miR-206 repression of BDNF expression 61. Furthermore, a BDNF dependent mechanism for regulation of alcohol consumption in non-dependent animals was proposed by studies involving heterozygous BDNF null mutant mice 62 or the inhibition of the BDNF receptor TrkB. These manipulations led to increased alcohol consumption and preference 63, 64 as well as increased anxiety responses 65.
BDNF is a potent modulator of synaptic transmission and plasticity in cortical neurons 66. Because BDNF signaling is in part transduced through MAP-kinase activity, suppressed mPFC BDNF levels may interact with a dysregulated MAP-kinase signal transduction, which in the present study was indicated by the downregulated dual-specific phosphatase family (Dusp1, Dusp6). Indeed, we have previously provided evidence for altered MAP-kinase function in the mPFC of post-dependent rats 30. As a potential consequence of altered MAP-kinase signaling, we found downregulation of several neuronal transcription factors, including members of the Egr, Fos, and Nr4a families. These changes may ultimately lead to dysregulated expression of numerous genes, and result in neuronal dysfunction that contributes to behavioral changes seen in the post-dependent state. Importantly, evidence has been presented that some of the molecular events described above are already set in motion during alcohol exposure. Mice exposed to chronic intermittent alcohol exposure similar to the procedure used here showed pronounced downregulation of BDNF and Egr1 in the PFC 50.
We also identified cases by expression pairing where miRNAs and their putative target transcripts were regulated in the same direction (Supplemental Table 7). Several explanations for this apparent contradiction to the hypothesis of Guo et al.14 need to be considered. First, miRNAs are not only potential regulators of transcription, but also themselves subject to transcriptional control by a number of transcription factors through complex feedback loops. These miRNA-mRNA feedback loops seem to play a role in homeostatic mechanisms such as regulation of synaptic plasticity 22. Secondly, miRNA genes are often located within introns of putative targets, and are consequently subject to transcriptional control of the host gene. Finally, we cannot exclude that some of our observations are simply coincidental. However, genes with the highest composite miRSVR scores, such as Bdnf, Nr4a3 and Fos, also seem to show the strongest evidence for differential expression in the corroborative assays (qPCR for Bdnf and Nr4a3, in situ hybridizations for c-Fos 30), thus supporting our general conclusions.
A potential limitation of the present study is that miRNA and mRNA profiles originated from different animals. Because of random individual variation, this may decrease the sensitivity to detect coordinated changes in miRNA and mRNA expression. Changes that were nevertheless detected may, on the other hand, more likely be linked to escalated post-dependent drinking, which was confirmed in both batches of animals. This important behavioral outcome, and the associated increased sensitivity to stress that follows chronic intermittent ethanol exposure has now been found in a number of laboratories, under variable conditions of alcohol administration, and in both rats and mice6. Another limitation in assessing the functional relevance of miRNA-mRNA expression pairing based on brain tissue homogenate analysis is that it does not allow cellular resolution. Changes in miRNA and mRNA expression could therefore in fact be occurring in different cell populations. At a cellular level, causally linking changes in the expression of individual miRNAs to regulation of target transcripts will require cell based experiments. At a systems level, causally linking changes in mPFC miRNA expression with behavior will require localized overexpression of candidate miRNAs, or their inhibition. Our present study identifies candidate targets for these future investigations.
In conclusion, we have identified persistent, coordinated changes in the expression of miRNAs and their target mRNAs in the rat mPFC following alcohol dependence. The miRNAs identified target multiple mRNAs that are associated with mechanisms involved in reward pathways, neurotransmission, and synaptic plasticity. The ability of miRNAs to regulate ensembles of mRNAs that control complex cellular processes in the brain in a coordinated manner suggests a possible role for miRNAs in the pathophysiology of alcohol dependence. The coordinated and long lasting shift in microRNA and mRNA expression may restructure the function of neural circuits involved in the cognitive control that the mPFC exerts over alcohol drinking and relapse, ultimately contributing to alcohol dependence.
Supplementary Material
Acknowledgments
WS was supported by the frameworks of Nationales Genomforschungsnetz (NGFN_ No. 01GS08152, see under www.ngfn-alkohol.de and Spanagel et al. 2010 67 by the Bundesministerium für Bildung und Forschung. MH was supported by the Intramural Research Program of the National Institutes of Alcohol Abuse and Alcoholism. We are especially thankful for the DIRP Microarray Core Facility at the NIMH for processing our microRNA arrays.
Footnotes
The authors report no biomedical financial interests or potential conflicts of interest.
References
- 1.Nestler EJ. Genes and addiction. Nat Genet. 2000;26(3):277–281. doi: 10.1038/81570. [DOI] [PubMed] [Google Scholar]
- 2.Rimondini R, Arlinde C, Sommer W, Heilig M. Long-lasting increase in voluntary ethanol consumption and transcriptional regulation in the rat brain after intermittent exposure to alcohol. FASEB J. 2002;16(1):27–35. doi: 10.1096/fj.01-0593com. [DOI] [PubMed] [Google Scholar]
- 3.Sommer W, Arlinde C, Heilig M. The search for candidate genes of alcoholism: evidence from expression profiling studies. Addict Biol. 2005;10(1):71–79. doi: 10.1080/13556210412331327821. [DOI] [PubMed] [Google Scholar]
- 4.Arlinde C, Sommer W, Bjork K, Reimers M, Hyytia P, Kiianmaa K, et al. A cluster of differentially expressed signal transduction genes identified by microarray analysis in a rat genetic model of alcoholism. Pharmacogenomics J. 2004;4(3):208–218. doi: 10.1038/sj.tpj.6500243. [DOI] [PubMed] [Google Scholar]
- 5.Hoffman PL, Miles M, Edenberg HJ, Sommer W, Tabakoff B, Wehner JM, et al. Gene expression in brain: a window on ethanol dependence, neuroadaptation, and preference. Alcohol Clin Exp Res. 2003;27(2):155–168. doi: 10.1097/01.ALC.0000060101.89334.11. [DOI] [PubMed] [Google Scholar]
- 6.Bjork K, Hansson AC, Sommer WH. Genetic variation and brain gene expression in rodent models of alcoholism implications for medication development. Int Rev Neurobiol. 2010;91:129–171. doi: 10.1016/S0074-7742(10)91005-2. [DOI] [PubMed] [Google Scholar]
- 7.Taqi MM, Bazov I, Watanabe H, Sheedy D, Harper C, Alkass K, et al. Prodynorphin CpG-SNPs associated with alcohol dependence: elevated methylation in the brain of human alcoholics. Addict Biol. 2011;16(3):499–509. doi: 10.1111/j.1369-1600.2011.00323.x. [DOI] [PMC free article] [PubMed] [Google Scholar]
- 8.Duka T, Trick L, Nikolaou K, Gray MA, Kempton MJ, Williams H, et al. Unique brain areas associated with abstinence control are damaged in multiply detoxified alcoholics. Biol Psychiatry. 2011;70(6):545–552. doi: 10.1016/j.biopsych.2011.04.006. [DOI] [PMC free article] [PubMed] [Google Scholar]
- 9.Vollstadt-Klein S, Hermann D, Rabinstein J, Wichert S, Klein O, Ende G, et al. Increased activation of the ACC during a spatial working memory task in alcohol-dependence versus heavy social drinking. Alcohol Clin Exp Res. 2010;34(5):771–776. doi: 10.1111/j.1530-0277.2010.01149.x. [DOI] [PubMed] [Google Scholar]
- 10.Liu J, Lewohl JM, Harris RA, Iyer VR, Dodd PR, Randall PK, et al. Patterns of gene expression in the frontal cortex discriminate alcoholic from nonalcoholic individuals. Neuropsychopharmacology. 2006;31(7):1574–1582. doi: 10.1038/sj.npp.1300947. [DOI] [PubMed] [Google Scholar]
- 11.Lewohl JM, Nunez YO, Dodd PR, Tiwari GR, Harris RA, Mayfield RD. Up-Regulation of MicroRNAs in Brain of Human Alcoholics. Alcohol Clin Exp Res. 2011 doi: 10.1111/j.1530-0277.2011.01544.x. [DOI] [PMC free article] [PubMed] [Google Scholar]
- 12.Mayfield RD, Lewohl JM, Dodd PR, Herlihy A, Liu J, Harris RA. Patterns of gene expression are altered in the frontal and motor cortices of human alcoholics. J Neurochem. 2002;81(4):802–813. doi: 10.1046/j.1471-4159.2002.00860.x. [DOI] [PubMed] [Google Scholar]
- 13.Liu J, Lewohl JM, Dodd PR, Randall PK, Harris RA, Mayfield RD. Gene expression profiling of individual cases reveals consistent transcriptional changes in alcoholic human brain. J Neurochem. 2004;90(5):1050–1058. doi: 10.1111/j.1471-4159.2004.02570.x. [DOI] [PubMed] [Google Scholar]
- 14.Guo H, Ingolia NT, Weissman JS, Bartel DP. Mammalian microRNAs predominantly act to decrease target mRNA levels. Nature. 2009;466(7308):835–840. doi: 10.1038/nature09267. [DOI] [PMC free article] [PubMed] [Google Scholar]
- 15.Matranga C, Tomari Y, Shin C, Bartel DP, Zamore PD. Passenger-strand cleavage facilitates assembly of siRNA into Ago2-containing RNAi enzyme complexes. Cell. 2005;123(4):607–620. doi: 10.1016/j.cell.2005.08.044. [DOI] [PubMed] [Google Scholar]
- 16.Yang JS, Phillips MD, Betel D, Mu P, Ventura A, Siepel AC, et al. Widespread regulatory activity of vertebrate microRNA* species. RNA. 2011;17(2):312–326. doi: 10.1261/rna.2537911. [DOI] [PMC free article] [PubMed] [Google Scholar]
- 17.Zhou H, Huang X, Cui H, Luo X, Tang Y, Chen S, et al. miR-155 and its star-form partner miR-155* cooperatively regulate type I interferon production by human plasmacytoid dendritic cells. Blood. 2010;116(26):5885–5894. doi: 10.1182/blood-2010-04-280156. [DOI] [PubMed] [Google Scholar]
- 18.Ghildiyal M, Xu J, Seitz H, Weng Z, Zamore PD. Sorting of Drosophila small silencing RNAs partitions microRNA* strands into the RNA interference pathway. RNA. 2010;16(1):43–56. doi: 10.1261/rna.1972910. [DOI] [PMC free article] [PubMed] [Google Scholar]
- 19.Packer AN, Xing Y, Harper SQ, Jones L, Davidson BL. The bifunctional microRNA miR-9/miR-9* regulates REST and CoREST and is downregulated in Huntington’s disease. J Neurosci. 2008;28 (53):14341–14346. doi: 10.1523/JNEUROSCI.2390-08.2008. [DOI] [PMC free article] [PubMed] [Google Scholar]
- 20.Cheng LC, Pastrana E, Tavazoie M, Doetsch F. miR-124 regulates adult neurogenesis in the subventricular zone stem cell niche. Nat Neurosci. 2009;12(4):399–408. doi: 10.1038/nn.2294. [DOI] [PMC free article] [PubMed] [Google Scholar]
- 21.Schratt GM, Tuebing F, Nigh EA, Kane CG, Sabatini ME, Kiebler M, et al. A brain-specific microRNA regulates dendritic spine development. Nature. 2006;439(7074):283–289. doi: 10.1038/nature04367. [DOI] [PubMed] [Google Scholar]
- 22.Cohen JE, Lee PR, Chen S, Li W, Fields RD. MicroRNA regulation of homeostatic synaptic plasticity. Proc Natl Acad Sci U S A. 2011;108(28):11650–11655. doi: 10.1073/pnas.1017576108. [DOI] [PMC free article] [PubMed] [Google Scholar]
- 23.Tao J, Wu H, Lin Q, Wei W, Lu XH, Cantle JP, et al. Deletion of astroglial Dicer causes non-cell-autonomous neuronal dysfunction and degeneration. J Neurosci. 2011;31(22):8306–8319. doi: 10.1523/JNEUROSCI.0567-11.2011. [DOI] [PMC free article] [PubMed] [Google Scholar]
- 24.Pietrzykowski AZ. The role of microRNAs in drug addiction: a big lesson from tiny molecules. Int Rev Neurobiol. 2010;91:1–24. doi: 10.1016/S0074-7742(10)91001-5. [DOI] [PubMed] [Google Scholar]
- 25.Pietrzykowski AZ, Friesen RM, Martin GE, Puig SI, Nowak CL, Wynne PM, et al. Posttranscriptional regulation of BK channel splice variant stability by miR-9 underlies neuroadaptation to alcohol. Neuron. 2008;59(2):274–287. doi: 10.1016/j.neuron.2008.05.032. [DOI] [PMC free article] [PubMed] [Google Scholar]
- 26.Hollander JA, Im HI, Amelio AL, Kocerha J, Bali P, Lu Q, et al. Striatal microRNA controls cocaine intake through CREB signalling. Nature. 2010;466(7303):197–202. doi: 10.1038/nature09202. [DOI] [PMC free article] [PubMed] [Google Scholar]
- 27.Im HI, Hollander JA, Bali P, Kenny PJ. MeCP2 controls BDNF expression and cocaine intake through homeostatic interactions with microRNA-212. Nat Neurosci. 2010;13(9):1120–1127. doi: 10.1038/nn.2615. [DOI] [PMC free article] [PubMed] [Google Scholar]
- 28.He Y, Yang C, Kirkmire CM, Wang ZJ. Regulation of opioid tolerance by let-7 family microRNA targeting the mu opioid receptor. J Neurosci. 2010;30(30):10251–10258. doi: 10.1523/JNEUROSCI.2419-10.2010. [DOI] [PMC free article] [PubMed] [Google Scholar]
- 29.Sommer WH, Rimondini R, Hansson AC, Hipskind PA, Gehlert DR, Barr CS, et al. Upregulation of voluntary alcohol intake, behavioral sensitivity to stress, and amygdala crhr1 expression following a history of dependence. Biol Psychiatry. 2008;63(2):139–145. doi: 10.1016/j.biopsych.2007.01.010. [DOI] [PubMed] [Google Scholar]
- 30.Hansson AC, Rimondini R, Neznanova O, Sommer WH, Heilig M. Neuroplasticity in brain reward circuitry following a history of ethanol dependence. Eur J Neurosci. 2008;27(8):1912–1922. doi: 10.1111/j.1460-9568.2008.06159.x. [DOI] [PMC free article] [PubMed] [Google Scholar]
- 31.Paxonis G, Watson . The Rat Brain Stereotaxic Coordinates. 1986. [Google Scholar]
- 32.Bjork K, Saarikoski ST, Arlinde C, Kovanen L, Osei-Hyiaman D, Ubaldi M, et al. Glutathione-S-transferase expression in the brain: possible role in ethanol preference and longevity. FASEB J. 2006;20(11):1826–1835. doi: 10.1096/fj.06-5896com. [DOI] [PubMed] [Google Scholar]
- 33.Benjamini Y, Hochberg Y. Controlling the False Discovery Rate - A Practical and Powerful Approach to Multiple Testing. Journal of the Royal Statistical Society Series B-Methodological. 1995;57:289–300. [Google Scholar]
- 34.Reimers M, Heilig M, Sommer WH. Gene discovery in neuropharmacological and behavioral studies using Affymetrix microarray data. Methods. 2005;37(3):219–228. doi: 10.1016/j.ymeth.2005.09.002. [DOI] [PubMed] [Google Scholar]
- 35.Flatscher-Bader T, van der Brug MP, Landis N, Hwang JW, Harrison E, Wilce PA. Comparative gene expression in brain regions of human alcoholics. Genes Brain Behav. 2006;5 (Suppl 1):78–84. doi: 10.1111/j.1601-183X.2006.00197.x. [DOI] [PubMed] [Google Scholar]
- 36.Hansson AC, Rimondini R, Heilig M, Mathe AA, Sommer WH. Dissociation of antidepressant-like activity of escitalopram and nortriptyline on behaviour and hippocampal BDNF expression in female rats. J Psychopharmacol. 2011 doi: 10.1177/0269881110393049. [DOI] [PubMed] [Google Scholar]
- 37.Dennis GJ, Sherman BT, Hosack DA, Yang J, Gao W, Lane HC, et al. DAVID: database for annotation, visualization, and integrated discovery. Genome Biol. 2003;4:P3. [PubMed] [Google Scholar]
- 38.Betel D, Wilson M, Gabow A, Marks DS, Sander C. The microRNA. org resource: targets and expression. Nucleic Acids Res. 2008;36(Database issue):D149–153. doi: 10.1093/nar/gkm995. [DOI] [PMC free article] [PubMed] [Google Scholar]
- 39.Betel D, Koppal A, Agius P, Sander C, Leslie C. Comprehensive modeling of microRNA targets predicts functional non-conserved and non-canonical sites. Genome Biol. 2010;11(8):R90. doi: 10.1186/gb-2010-11-8-r90. [DOI] [PMC free article] [PubMed] [Google Scholar]
- 40.Moonat S, Sakharkar AJ, Zhang H, Pandey SC. The role of amygdaloid brain-derived neurotrophic factor, activity-regulated cytoskeleton-associated protein and dendritic spines in anxiety and alcoholism. Addict Biol. 2010;16(2):238–250. doi: 10.1111/j.1369-1600.2010.00275.x. [DOI] [PMC free article] [PubMed] [Google Scholar]
- 41.Fanous S, Lacagnina MJ, Nikulina EM, Hammer RP., Jr Sensitized activation of Fos and brain-derived neurotrophic factor in the medial prefrontal cortex and ventral tegmental area accompanies behavioral sensitization to amphetamine. Neuropharmacology. 2011;61(4):558–564. doi: 10.1016/j.neuropharm.2011.04.026. [DOI] [PMC free article] [PubMed] [Google Scholar]
- 42.Vilpoux C, Warnault V, Pierrefiche O, Daoust M, Naassila M. Ethanol-sensitive brain regions in rat and mouse: a cartographic review, using immediate early gene expression. Alcohol Clin Exp Res. 2009;33(6):945–969. doi: 10.1111/j.1530-0277.2009.00916.x. [DOI] [PubMed] [Google Scholar]
- 43.Spanagel R, Pendyala G, Abarca C, Zghoul T, Sanchis-Segura C, Magnone MC, et al. The clock gene Per2 influences the glutamatergic system and modulates alcohol consumption. Nat Med. 2005;11(1):35–42. doi: 10.1038/nm1163. [DOI] [PubMed] [Google Scholar]
- 44.Caffino L, Racagni G, Fumagalli F. Stress and cocaine interact to modulate Arc/Arg3.1 expression in rat brain. Psychopharmacology (Berl) 2011 doi: 10.1007/s00213-011-2331-3. [DOI] [PubMed] [Google Scholar]
- 45.Werme M, Olson L, Brene S. NGFI-B and nor1 mRNAs are upregulated in brain reward pathways by drugs of abuse: different effects in Fischer and Lewis rats. Brain Res Mol Brain Res. 2000;76 (1):18–24. doi: 10.1016/s0169-328x(99)00327-7. [DOI] [PubMed] [Google Scholar]
- 46.Novak G, Zai CC, Mirkhani M, Shaikh S, Vincent JB, Meltzer H, et al. Replicated association of the NR4A3 gene with smoking behaviour in schizophrenia and in bipolar disorder. Genes Brain Behav. 2010;9(8):910–917. doi: 10.1111/j.1601-183X.2010.00631.x. [DOI] [PubMed] [Google Scholar]
- 47.Nachmani D, Lankry D, Wolf DG, Mandelboim O. The human cytomegalovirus microRNA miR-UL112 acts synergistically with a cellular microRNA to escape immune elimination. Nat Immunol. 2010;11(9):806–813. doi: 10.1038/ni.1916. [DOI] [PubMed] [Google Scholar]
- 48.Sathyan P, Golden HB, Miranda RC. Competing interactions between micro-RNAs determine neural progenitor survival and proliferation after ethanol exposure: evidence from an ex vivo model of the fetal cerebral cortical neuroepithelium. J Neurosci. 2007;27(32):8546–8557. doi: 10.1523/JNEUROSCI.1269-07.2007. [DOI] [PMC free article] [PubMed] [Google Scholar]
- 49.Heilig M, Egli M, Crabbe JC, Becker HC. Acute withdrawal, protracted abstinence and negative affect in alcoholism: are they linked? Addict Biol. 15(2):169–184. doi: 10.1111/j.1369-1600.2009.00194.x. [DOI] [PMC free article] [PubMed] [Google Scholar]
- 50.Melendez RI, McGinty JF, Kalivas PW, Becker HC. Brain region-specific gene expression changes after chronic intermittent ethanol exposure and early withdrawal in C57BL/6J mice. Addict Biol. 2011 doi: 10.1111/j.1369-1600.2011.00357.x. [DOI] [PMC free article] [PubMed] [Google Scholar]
- 51.Kerns RT, Ravindranathan A, Hassan S, Cage MP, York T, Sikela JM, et al. Ethanol-responsive brain region expression networks: implications for behavioral responses to acute ethanol in DBA/2J versus C57BL/6J mice. J Neurosci. 2005;25(9):2255–2266. doi: 10.1523/JNEUROSCI.4372-04.2005. [DOI] [PMC free article] [PubMed] [Google Scholar]
- 52.Matthaus F, Smith VA, Fogtman A, Sommer WH, Leonardi-Essmann F, Lourdusamy A, et al. Interactive molecular networks obtained by computer-aided conversion of microarray data from brains of alcohol-drinking rats. Pharmacopsychiatry. 2009;42 (Suppl 1):S118–128. doi: 10.1055/s-0029-1216348. [DOI] [PubMed] [Google Scholar]
- 53.Eipper-Mains JE, Kiraly DD, Palakodeti D, Mains RE, Eipper BA, Graveley BR. microRNA-Seq reveals cocaine-regulated expression of striatal microRNAs. RNA. 2011;17(8):1529–1543. doi: 10.1261/rna.2775511. [DOI] [PMC free article] [PubMed] [Google Scholar]
- 54.Huang W, Li MD. Nicotine modulates expression of miR-140*, which targets the 3′-untranslated region of dynamin 1 gene (Dnm1) Int J Neuropsychopharmacol. 2009;12(4):537–546. doi: 10.1017/S1461145708009528. [DOI] [PubMed] [Google Scholar]
- 55.Spanagel R. Alcoholism: a systems approach from molecular physiology to addictive behavior. Physiol Rev. 2009;89(2):649–705. doi: 10.1152/physrev.00013.2008. [DOI] [PubMed] [Google Scholar]
- 56.Wilke N, Sganga M, Barhite S, Miles MF. Effects of alcohol on gene expression in neural cells. EXS. 1994;71:49–59. doi: 10.1007/978-3-0348-7330-7_6. [DOI] [PubMed] [Google Scholar]
- 57.Koob GF. A role for GABA mechanisms in the motivational effects of alcohol. Biochem Pharmacol. 2004;68(8):1515–1525. doi: 10.1016/j.bcp.2004.07.031. [DOI] [PubMed] [Google Scholar]
- 58.Koob GF, Ahmed SH, Boutrel B, Chen SA, Kenny PJ, Markou A, et al. Neurobiological mechanisms in the transition from drug use to drug dependence. Neurosci Biobehav Rev. 2004;27(8):739–749. doi: 10.1016/j.neubiorev.2003.11.007. [DOI] [PubMed] [Google Scholar]
- 59.Le Merrer J, Befort K, Gardon O, Filliol D, Darcq E, Dembele D, et al. Protracted abstinence from distinct drugs of abuse shows regulation of a common gene network. Addict Biol. 2011 doi: 10.1111/j.1369-1600.2011.00365.x. [DOI] [PubMed] [Google Scholar]
- 60.Duman RS, Monteggia LM. A neurotrophic model for stress-related mood disorders. Biol Psychiatry. 2006;59(12):1116–1127. doi: 10.1016/j.biopsych.2006.02.013. [DOI] [PubMed] [Google Scholar]
- 61.Miura P, Amirouche A, Clow C, Belanger G, Jasmin BJ. BDNF expression is repressed during myogenic differentiation by miR-206. J Neurochem. 2011 doi: 10.1111/j.1471-4159.2011.07583.x. [DOI] [PubMed] [Google Scholar]
- 62.McGough NN, He DY, Logrip ML, Jeanblanc J, Phamluong K, Luong K, et al. RACK1 and brain-derived neurotrophic factor: a homeostatic pathway that regulates alcohol addiction. J Neurosci. 2004;24(46):10542–10552. doi: 10.1523/JNEUROSCI.3714-04.2004. [DOI] [PMC free article] [PubMed] [Google Scholar]
- 63.Jeanblanc J, He DY, McGough NN, Logrip ML, Phamluong K, Janak PH, et al. The dopamine D3 receptor is part of a homeostatic pathway regulating ethanol consumption. J Neurosci. 2006;26 (5):1457–1464. doi: 10.1523/JNEUROSCI.3786-05.2006. [DOI] [PMC free article] [PubMed] [Google Scholar]
- 64.Ron D, Messing RO. Signaling Pathways Mediating Alcohol Effects. Curr Top Behav Neurosci. 2011 doi: 10.1007/7854_2011_161. [DOI] [PMC free article] [PubMed] [Google Scholar]
- 65.Bergami M, Rimondini R, Santi S, Blum R, Gotz M, Canossa M. Deletion of TrkB in adult progenitors alters newborn neuron integration into hippocampal circuits and increases anxiety-like behavior. Proc Natl Acad Sci U S A. 2008;105(40):15570–15575. doi: 10.1073/pnas.0803702105. [DOI] [PMC free article] [PubMed] [Google Scholar]
- 66.Horch HW, Kruttgen A, Portbury SD, Katz LC. Destabilization of cortical dendrites and spines by BDNF. Neuron. 1999;23(2):353–364. doi: 10.1016/s0896-6273(00)80785-0. [DOI] [PubMed] [Google Scholar]
- 67.Spanagel R, Bartsch D, Brors B, Dahmen N, Deussing J, Eils R, et al. An integrated genome research network for studying the genetics of alcohol addiction. Addict Biol. 2010;15(4):369–379. doi: 10.1111/j.1369-1600.2010.00276.x. [DOI] [PubMed] [Google Scholar]
Associated Data
This section collects any data citations, data availability statements, or supplementary materials included in this article.