

Abstract
Many metabolic engineering and genetic engineering applications in yeast rely on the use of plasmids. Despite their pervasive use and the diverse collections available, there is a fundamental lack of understanding of how commonly used DNA plasmids affect the cell’s ability to grow and how the choice of plasmid components can influence plasmid load and burden. In this study, we characterized the major attributes of the 2μ and centromeric plasmids typically used in yeast by examining the impact of choice of selection marker, promoter, origin of replication, and strain ploidy on conferred growth rates and plasmid copy number. We conclude that the “plasmid burden,” as demonstrated by a reduced growth rate, is primarily due to the choice of selection marker, especially when auxotrophic markers are utilized. The plasmid burden traditionally attributed to replication and maintenance of plasmid DNA plays only a minor role in haploid yeast yet is much more significant in diploid strains. The selection marker can also significantly change plasmid copy number. In fact, plasmid copy number can be influenced to some extent by all of the parameters tested. The information presented in this study will allow for more rational design and selection of plasmids for engineering applications.
Keywords: centromeric, 2 micron, plasmid burden, plasmid load, copy number, S. cerevisiae, metabolic engineering
Introduction
Saccharomyces cerevisiae is a widely-utilized organism both for studying fundamental genetics (Spellman, et al., 1998, Kumar & Snyder, 2001, Hu, et al., 2007) and for engineering novel fuels, chemicals, and pharmaceuticals (Nevoigt, 2008, Hong & Nielsen, 2012). These endeavors are enabled by an expanding molecular toolset that took root in the 1970’s with the capacity to transform yeast (Hinnen, et al., 1978). Over the past several decades, methods and technologies have rapidly evolved as evidenced by an expanding array of molecules produced in yeast (Curran & Alper, 2012) and an increasing capacity to synthetically engineer the genome (Dymond, et al., 2011). Even still, controlling the expression of genes (either of endogenous or exogenous origin) remains a core, enabling technology in this area. As a result, a significant amount of effort has focused on enabling fundamental control of transcription and translation by developing sets of endogenous promoters (Gatignol, et al., 1990, Lu & Jeffries, 2007, Blount, et al., 2012, Sun, et al., 2012), non-native inducible promoters (Gari, et al., 1997), bi-directional promoters (Li, et al., 2008), synthetic hybrid promoters (Blazeck, et al., 2011, Blazeck, et al., 2012a, Blazeck, et al., 2012b), and multi-cloning sites engineered for consistent expression (Crook, et al., 2011). The vast majority of these systems and studies utilize DNA plasmids and vector sets as a means of altering expression in a synthetic manner (Young & Alper, 2010, Krivoruchko, et al., 2011). However, a comprehensive and fundamental understanding of how standard DNA plasmids affect the cell’s ability to grow and influence cellular metabolism is not well understood despite their obvious importance in heterologous expression systems. Specifically, it is unknown how strain ploidy, copy number, plasmid burden, selection marker, and promoter selection are intrinsically linked.
Most plasmids used in S. cerevisiae are S. cerevisiae/E. coli shuttle vectors with a wide-range of tunable parameters including selection markers, promoters/terminators, and origin of replication (Da Silva & Srikrishnan, 2012). One commonly used set of vectors, the pRS line, includes URA3, TRP1, HIS3, and LEU2 auxotrophic selection markers along with 2μ and CEN/ARS origins of replication (Sikorski & Hieter, 1989, Christianson, et al., 1992). A variant of this plasmid line also includes several promoters (GPD (TDH3), TEF1, CYC1, and ADH1 promoters) cloned upstream of a multicloning site to allow for easy expression of heterologous genes (Mumberg, et al., 1995). Beyond auxotrophic markers, several plasmid sets have been created with dominant antibiotic markers including KanMX (Wach, et al., 1994) and an expanded array of other antibiotics (Goldstein & McCusker, 1999). However, this ease of cloning and flexibility does come with a potential associated cost. In particular, the transformation and expression of plasmids in yeast systems convey a burden on the cells as manifested by decreased growth rates and lower production of desired metabolites compared to cells without plasmids (Da Silva & Srikrishnan, 2012). One common belief is that this burden is associated with the energy and metabolite costs associated with simply maintaining and copying the plasmid DNA in the cell—especially for high copy plasmids. However, there is also some evidence that changing promoter strengths and selection marker (especially auxotrophic markers) can affect cell growth (Çakar, et al., 1999, Görgens, et al., 2001). As a result, it seems at face value that these plasmids may exert a metabolic burden on the cell. Yet, it is well known that plasmid copy number, especially among 2μ plasmids, can change dramatically depending on the selection marker and heterologous genes expressed on the plasmid (Erhart & Hollenberg, 1983, Wittrup, et al., 1994, Chen, et al., 2012). Thus, the true analysis of plasmid burden is confounded by many factors. Therefore, a careful dissection of each component in a plasmid, including origins of replication, selection markers and promoters, would help elucidate the cause of the observed burden and provide insight to researchers by identifying the best plasmid (i.e. lowest burden with highest copy number) for their work.
In this study we demonstrate that both a replication-based and metabolic-based plasmid burden can exist and fluctuate across the p4XX plasmid line (Mumberg, et al., 1995) when used in S. cerevisiae. We find that this burden is most pronounced in a diploid strain rather than a haploid. We analyze the influence of each tunable plasmid parameter on cell growth as a metric of this burden. Moreover, we characterize the absolute plasmid copy number in both 2μ and CEN6/ARSH4 plasmid to assess “high-copy” and “low-copy” plasmids, respectively. We use these data to characterize the contribution of the “plasmid load,” or the amount of additional DNA that must be maintained by the cell, to plasmid burden. We also analyze the use of both auxotrophic and a dominant antibiotic marker and the effect of promoter selection on both cell growth and copy number. Our intent is to provide an in-depth characterization of plasmid burden conferred by the various parameters in order to inform the use of these plasmids for metabolic engineering and genetic engineering applications.
Materials and methods
Strains and media
Saccharomyces cerevisiae strains BY4741 (MAT a; his3Δ1; leu2Δ0; met15Δ0; ura3Δ0), BY4741 trp1::KanMX from the Yeast Deletion Database (Giaever, et al., 2002), and BY4743 (MAT a/α his3Δ1/his3Δ1 leu2Δ0/leu2Δ0 LYS2/lys2Δ0 met15Δ0/MET15 ura3Δ0/ura3Δ0) were used in this study (Table 1). Yeast strains were routinely propagated at 30°C in YPD medium or yeast complete synthetic medium (CSM). YPD medium is composed of 10 g/L yeast extract, 20 g/L peptone, and 20 g/L glucose. CSM is composed of 6.7 g/L yeast nitrogen base, 20 g/L glucose, and either CSM, CSM-URA, CSM-HIS, CSM-LEU, or CSM-TRP supplement (MP Biomedicals, Solon, OH), depending on the required auxotrophic selection. Yeast strains expressing the KanMX gene were grown in CSM supplemented with 200 mg/L G418. Escherichia coli strain DH10β was used for all cloning and plasmid propagation. DH10β was grown at 37 °C in Luria-Bertani (LB) Broth supplemented with 50 μg/mL of ampicillin. All strains were cultivated with 225 RPM orbital shaking. Yeast and bacterial strains were stored at −80°C in 15% glycerol.
Table 1.
Strain-plasmid combinations used in this study.
| Strain | Plasmids |
|---|---|
|
| |
| BY4741 (MAT a; his3Δ1; leu2Δ0; met15Δ0; ura3Δ0) | p41K-GPD |
| p42K-GPD | |
| p41K-CYC | |
| p42K-CYC | |
| p41K-No Promoter | |
| p42K-No Promoter | |
|
| |
| BY4741 trp1::KanMX (MAT a; his3Δ1; leu2Δ0; met15Δ0; ura3Δ0; trp1::KanMX) | p413-GPD, p414-GPD, p415-GPD, p416-GPD |
| p423-GPD, p424-GPD, p425-GPD, p426-GPD | |
| p413-CYC, p414-CYC, p415-CYC, p416-CYC | |
| p423-CYC, p424-CYC, p425-CYC, p426-CYC | |
| p413-TEF, p414-TEF, p415-TEF, p416-TEF | |
| p423-TEF, p424-TEF, p425-TEF, p426-TEF | |
| p413-ADH, p414-ADH, p415-ADH, p416-ADH | |
| p423-ADH, p424-ADH, p425-ADH, p426-ADH | |
| p413-No Promoter, p414-No Promoter, p415-No Promoter, p416-No Promoter | |
| p423-No Promoter, p424-No Promoter, p425-No Promoter, p426-No Promoter | |
|
| |
| BY4743 (MAT a/α his3Δ1/his3Δ1 leu2Δ0/leu2Δ0 LYS2/lys2Δ0 met15Δ0/MET15 ura3Δ0/ura3Δ0) | p41K-GPD, p413-GPD, p416-GPD |
| p42K-GPD, p423-GPD, p426-GPD | |
| p41K-CYC, p413-CYC, p416-CYC | |
| p42K-CYC, p423-CYC, p426-CYC | |
| p41K-No Promoter, p413-No Promoter, p416-No Promoter | |
| p42K-No Promoter, p423-No Promoter, p426-No Promoter | |
Plasmid construction
All plasmids used in this study were based on the p4XX- vectors described by Mumberg et al. (Mumberg, et al., 1995) which are originally derived from the pRS series (Sikorski & Hieter, 1989). Fig. 1 enumerates the different parameters studied in this work. Specifically, the plasmids contained either the GPD, TEF1, CYC1, ADH1 promoter or no promoter. The plasmids with no promoter were constructed by restriction digest of the plasmids p413-GPD, p423-GPD, p414-GPD, p424-GPD, p415-GPD, p425-GPD, p416-GPD and p426-GPD with SacI and SpeI, which cut out the GPD promoter. End repair was then done on the cleaved vector using the End-It DNA End Repair kit (Epicentre, Madison, WI) followed by ligation of the resulting blunt-ends. Each plasmid also contained a selection marker of either URA3, TRP1, HIS3, or LEU2, (for auxotrophic complementation) or KanMX (for antibiotic resistance). The plasmids with the KanMX gene were created by cloning the gene and flanking regions from plasmid pUG6 (using primers GAAAGGCCTGATCTGTTTAGCTTGCCTCGTCC and AGTCCTGCAGGGTTTTCGCACTGGATGGCG). The plasmids p416-CYC, p426-CYC, p416-GPD, p426-GPD, p416-No Promoter, and p426-No Promoter were then digested with StuI and SbfI. This resulted in cutting out a portion of the URA3 marker, including the start codon. The KanMX PCR product was then cloned into this place. These have been labeled p4xK plasmids.
Figure 1. Description of strains and plasmids used in this study.

The left-hand column contains the different tunable parameters used, and the right-hand column contains all variations of each parameter. All strains in this study were made by selecting one parameter from each row (i.e. BY4741-p413-GPD). In total, 64 different plasmid-strain pairings were considered in this study.
Standard cloning and bacterial transformations were performed according to Sambrook and Russell (Sambrook & Russell, 2001). PCR reactions used Phusion High-Fidelity DNA Polymerase from New England Biolabs (Ipswich, MA) and followed supplier instructions; primers were purchased from Integrated DNA Technologies (Coralville, Iowa). Antarctic phosphatase and all restriction enzymes were purchased from New England Biolabs (Ipswich, MA). Fermentas T4 DNA ligase and all other enzymes and chemicals were purchased through Thermo Fisher Scientific (Waltham, MA). Vectors were isolated using the Zyppy Plasmid Miniprep kit from Zymo Research Corp. (Irvine, CA) and DNA purification was performed with a Qiaquick PCR Cleanup kit (Qiagen, Valencia, CA). Plasmids were transformed using the EZ Yeast Transformation II Kit from Zymo Research Corp. (Irvine, CA) according to manufacturer’s instructions.
Growth experiments
Growth rates of the transformed yeast strains were measured with a Bioscreen C (Growth Curves USA, Havermill, MA) in biological triplicates using the wide band filter (420–580 nm) recommended for optical density measurements. A 1 μl inoculum of fully grown culture was added to each well with 250 μL of the appropriate CSM. The assay was run for 24 hours at 30°C under continuous shaking with sampling every 10 minutes. Exponential growth rates were calculated using a solution algorithm written in MATLAB (Mathworks, Natick, MA).
Plasmid copy number assay
Plasmid copy numbers were quantified using quantitative PCR (qPCR) from total DNA extracts. Cultures were inoculated at OD600 of 0.25 from fully grown pre-cultures and grown for four hours to be at mid-log phase for extraction. Total DNA extraction was performed as described previously (Moriya, et al., 2006). Lyticase from Arthrobacter luteus was purchased from Sigma Aldrich (St. Louis, MO).
Quantitative PCR was performed on a ViiA7 qPCR system (Life Technologies, Carlsbad, CA) using SYBR Green Master Mix from Roche (Penzberg, Germany), following the manufacturer’s instructions with an annealing temperature of 58°C and 0.75 μL of total DNA extract per 10 μL reaction.
A section of the ampicillin gene on each plasmid was targeted (with primers TGTAACTCGCCTTGATCGTTGGGA and TTGTTGCCATTGCTACAGGCATCG) and compared to a genomic target in the ALG9 gene (with primers ATCGTGAAATTGCAGGCAGCTTGG and CATGGCAACGGCAGAAGGCAATAA) to quantify copy number. Standard curves were created using plasmid p416-CYC-ALG9. ALG9 was cloned into plasmid p416-CYC by PCR with primers GGCGCTTCTAGAATGAATTGCAAGGCGGTAAC and CCATCGATTCAATTAGTAGTCTCAGTTGGTTTTTCA followed by digestion with XbaI and ClaI restriction enzymes and subsequent ligation. A serial dilution of this plasmid with concentration varying from 5×10⁷ to 5×101 copies per μL was then used to create the standard curves.
Results
A total of 64 different plasmid-strain combinations (Fig. 1) were cultured in complete synthetic media over a 24-hour time frame to determine growth rates and copy number. These combinations included differences in ploidy, selection marker (including both auxotrophic and dominant antibiotic markers), replication origin (including both CEN6/ARSH4 and 2μ) and the presence/choice of a promoter on the plasmid. Growth rate differences are a metric of plasmid burden while copy number quantifies the total plasmid load in the system.
Evaluating the growth-rate impact of auxotrophic marker-based plasmids in haploid and diploid yeast
A total of 40 different plasmids, p413, p423, p414, p424, p415, p425, p416, and p426 with no promoter, GPD promoter, CYC1 promoter, TEF1 promoter, and ADH1 promoter were transformed in the BY4741 trp1Δ haploid yeast strain (Fig. 1). These plasmids contained different auxotrophic markers and were evaluated both with a “low copy” CEN6/ARSH4 origin and a “high copy” 2μ origin. Exponential phase growth rates were measured for each of the 40 BY4741 trp1Δ strain harboring a distinct plasmid. Fig. 2a illustrates that in general, haploid yeast harboring an auxotrophic-marker based plasmid grew slower than their no-plasmid counterparts. However, it is also immediately evident that this growth reduction was not uniform as it ranged from as small as a 5% reduction to as much as a 25% reduction depending on the combination of auxotrophic marker, origin, and promoter selected. Across the board, there appeared to be little effect by the choice of promoter on growth rate. Moreover, Fig. 2a also shows that high copy 2μ plasmids (p42x) generally conferred lower growth rates than CEN6/ARSH4 based plasmids. However, this trend for 2μ plasmids does not hold across all plasmids as sometimes only a marginal change in growth rate was seen with altering the origin. One particular standout in this dataset is plasmids containing the LEU2 selection marker (p4x5). Plasmids with a LEU2 marker had an average growth rate that was 76.6% of the control growth rate of 0.303 hr−1. Moreover, there was no substantial difference in growth rate between low and high copy versions of these plasmids.
Figure 2. Relative growth rates for haploid (BY4741) and diploid (BY4743) yeast strains containing plasmids.


The background plasmid is described on the X-axis of each graph and the legend describes the promoter used. (a) BY4741 trp1Δ strains with auxotrophic markers. The absolute growth rate of the control strain for this figure was 0.303 hr−1. (b) BY4743 strains with auxotrophic markers. The absolute growth rate of the control strain was 0.425 hr−1. (c) BY4741 strains with antibiotic marker KanMX. The absolute growth rate of the control strain for this figure was 0.375 hr−1. (d) BY4743 strains with antibiotic marker KanMX. The control strain is the same as in (b). Error bars represent standard deviations among tested biological replicates. Three biological replicates were tested for each strain.
Twelve of these plasmids (p413, p423, p416, and p426 with no promoter, GPD promoter, and CYC1 promoter) were transformed into the diploid strain BY4743. A more limited set was used due to available auxotrophic markers in this strain, which excluded the capacity to study the leucine auxotrophic marker set. In general, the diploid strain showed a similar trend as the haploid with the high copy 2μ plasmids growing slower than the low copy CEN6/ARSH4 plasmids (Fig. 2b). However, the effect of the low copy plasmids on growth rate in the diploid strain was quite muted with an average of only 3.9%. Collectively, these two sets of data suggest a plasmid-replication burden for auxotrophic marker-based plasmids given the reduction in growth rate with higher copy plasmids.
Evaluating the growth-rate impact of a dominant antibiotic marker-based plasmids in haploid and diploid yeast
In addition to the auxotrophic plasmids described above, six plasmids containing the KanMX antibiotic resistance marker (p41K and p42K with no promoter, GPD promoter, and CYC promoter) were transformed in both the haploid and diploid yeast strains, BY4741 and BY4743, respectively. In contrast to the results above, plasmids containing the KanMX antibiotic resistance marker did not have an appreciable decrease in growth rate compared to control strains not harboring these plasmids (Fig. 2C and 2D). In fact, for haploid strains, this difference was unobservable. Furthermore, there was no noticeable effect on growth by the different promoters. These results demonstrate a difference in the plasmid burden as measured by growth rate reduction associated with KanMX marker plasmids when compared with auxotrophic markers.
Quantifying copy numbers and plasmid load in haploid and diploid yeast
Quantifying the number of copies of plasmids maintained by these cells provides a metric of plasmid load that can be later compared with the demonstrated growth-rate burden. Therefore, plasmid copy numbers were determined using quantitative PCR for 24 different plasmids in the BY4741 trp1Δ strain (p413, p423, p414, p424, p415, p425, p416, and p426, with no promoter, GPD promoter, and CYC1 promoter), six different plasmids in the BY4741 strain (p41K and p42K with no promoter, GPD promoter, and CYC1 promoter), and 18 different plasmids in the BY4743 strain (p413, p423, p416, p426, p41K, and p42K with no promoter, GPD promoter, and CYC1 promoter) (Fig. 3).
Figure 3. Copy number of plasmids per cell.


Copy number was determined by qPCR in both (a) haploid BY4741 and (b) diploid BY4743. The insets show details of the low-copy centromeric plasmid copy numbers. With the exception of the KanMX marker plasmids, copy numbers were higher for plasmids with a 2μ origin compared to the corresponding CEN6/ARSH4 origin. Error bars represent standard deviations among tested technical replicates. Three technical replicates were tested for each strain.
Unlike cell growth rate, plasmid copy number varied greatly across the plasmids-strain combinations tested. Specifically, copy number varied between 2 and 34 copies per cell in the haploid strain and between 4 and 58 copies per cell in the diploid strain. In the BY4741 haploid strain, the low-copy, CEN6/ARSH4 plasmids ranged from 2 to 5 copies per cell and the high copy 2μ plasmids with auxotrophic markers had a wide range of 14 to 34 copies per cell (Fig. 3a). Interestingly, the LEU2-containing 2μ plasmids had noticeably lower copy numbers than the other 2μ plasmids with auxotrophic markers. This result echoes the larger growth-rate burden exhibited by this auxotrophic marker-based plasmid. Surprisingly, the 2μ plasmids containing the KanMX antibiotic resistance marker showed no significant difference in copy number from their low copy centromeric plasmid counterparts. This phenomenon is unique to the KanMX plasmids as every auxotrophic marker plasmids tested (even the LEU2-containing plasmids) showed dramatic differences in copy number between the two types of origins of replication.
The diploid strain (BY4743) showed similar trends. In this strain, the low-copy, CEN6/ARSH4 plasmids ranged from 4 to 8 copies per cell and the high copy 2μ plasmids with auxotrophic markers ranged from 28 to 58 copies per cell (Fig. 3b). The 2μ KanMX antibiotic resistance plasmids ranged from 8 to 14 copies and did not show substantial increases over their CEN6/ARSH4 counterparts. In general the diploid strain yielded copy numbers that were roughly double that of the haploid strain for each plasmid.
In addition to large copy number ranges, a distinguishing feature of this data is the impact of promoter on some of the constructs. In particular, the choice of promoter resulted in some differences in copy number, primarily for the 2μ plasmids. The plasmid copy number decreases as the promoter strength increases (with no promoter being weakest and GPD being the strongest), as demonstrated by the p424 and p426 plasmids. However, this trend does not always hold, as in the case of the p423 plasmids. Moreover, the p425 and p42K plasmids did not show an appreciable difference in copy number between the different promoters. Nevertheless, there is clearly a complex interaction between copy number, marker, and promoter.
Correlating growth-based plasmid burden and plasmid load
A common assumption is that the “plasmid burden” demonstrated by a reduced growth rate in cells containing plasmids is a direct result of the replication and maintenance of the additional plasmid DNA in the cell. If this is the case, larger plasmids and plasmids with high copy numbers should have a lower growth rate than small plasmids or low-copy plasmids. As such, Fig. 4 compares the effect of additional DNA base-pairs per cell (determined by multiplying plasmid size by copy number) to the relative growth rates for both the diploid and haploid strains. In both cases, there appears to be a slight downward trend as more DNA base-pairs are maintained per cell, but the trend is more significant in the diploid strains than the haploid strains. For the haploid strain, the same quantity of exogenous DNA yielded growth rate differences that range between essentially zero and 25% reduction. For the diploids, the range in growth rate at a given plasmid load was less variable. Furthermore, the diploid strains have an even greater correlation (R2 = 0.8818) when the KanMX plasmids, which had no obvious affect on growth rate, were excluded. The same was not true for the haploid strains (R2 = 0.1287). This data indicates that plasmid burden due to extra DNA replication and maintenance is a concern in diploid strains, but not in haploid strains.
Figure 4. Relative growth rates compared to the approximate number of additional base-pairs produced per cell in haploid (BY4741) and diploid (BY4743) strains.

The additional base-pairs were calculated by multiplying the copy number of the plasmid by size of that plasmid. All growth rates were normalized to the control strain with no plasmid. In general, a decreasing trend in growth rate is seen with added DNA load, however, this trend is most apparent with diploid yeast and more diffuse with haploid yeast.
A further dissection of the data indicates varying impacts by the absolute number of plasmids in each cell on the percent growth reduction in haploid and diploid strains (Fig. 5). In the haploid strain (Fig. 5a), low copy plasmids corresponded with larger reductions in growth per copy across the board than high copy plasmids. In contrast, for diploid strains (Fig. 5b), the decrease in growth rate is consistent across all of the auxotrophic plasmids for all origins, further demonstrating that there is a penalty for each extra plasmid the cell has to maintain.
Figure 5. Percent growth reduction per plasmid copy for both haploid and diploid strains.

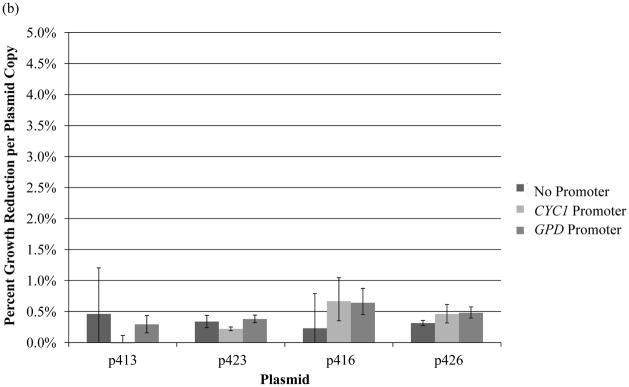
Growth rate reductions on a per plasmid basis were calculated for the (a) BY4741 haploid strain and the (b) BY4743 diploid strain. In general, the growth reduction per copy was consistent across plasmid origins for the diploid strains. The growth reduction per copy tended to be less for the high copy plasmids in haploid yeast. Error bars are representative of propagated error from measured values.
Discussion
When constructing and selecting plasmids for use in S. cerevisiae, there are several parameters that can influence plasmid burden and plasmid load. In this study, we quantified the contribution of selection marker, promoter, origin of replication, and strain ploidy to conferred growth rate and plasmid copy number. In particular, we find the most significant impact of plasmid load in a diploid strain.
Selection marker plays a significant role in determining plasmid burden
The choice of selection marker is often considered a matter of convenience; however in reality, the marker gene can dramatically change the relative growth rate of the strain. Of the auxotrophic markers (HIS3, TRP1, LEU2, and URA3), LEU2 demonstrated the largest decrease in growth rate compared to a cell with no plasmid (Fig. 2a and b) and the lowest copy numbers (Fig. 3). The other auxotrophic markers provide similar growth rates and copy numbers across different strains. Previous work has also shown that the LEU2-containing plasmids do not reach the same final cell density (Çakar, et al., 1999). These results demonstrate that researchers must consider the relative importance of the plasmid burden and copy number for a particular application prior to choosing a selection marker. Furthermore, the misconception that the copy number of a plasmid is determined primarily by the origin of replication is proved incorrect by Fig. 3, showing that the choice of the KanMX marker can completely negate and mask the effects of different origins of replication. Interestingly, while inclusion of the KanMX marker severely affected to plasmid copy number, the same strains showed no decrease in growth rate relative to the control (Fig. 2c and d). Previous work has demonstrated that changing the expression of the selection marker through either attenuation of the promoter or protein half-life can influence copy number (Erhart & Hollenberg, 1983, Chen, et al., 2012). It will be necessary to employ similar techniques with the KanMX marker in order to see improved copy numbers, especially on the 2μ version of the plasmid. The difference between haploid and diploid yeast demonstrate an important attribute of plasmid burden that should also be considered by researchers. Collectively, these results highlight the importance of selection marker on a plasmid. To reduce the impact on growth-rate without compromising copy number, selection markers should be chosen in the order of HIS ~TRP > URA > LEU > KanMX.
Promoter choice affects plasmid load
Another plasmid-specific factor analyzed was the type of promoter present upstream of the multicloning site. While the choice of promoter did not appear to affect growth rate in this case, it does seem to determine the copy number of the plasmid (and thus the load per plasmid copy, Fig. 5). For some of the auxotrophic marker-based plasmids, as promoter strength increases the copy number decreases (Fig. 3). This observation is best noted in the high copy 2μ plasmids. This phenomenon is promoter-specific and may become more detrimental if multiple instances of the promoter are used in the strain, as previous work has suggested that many copies of some glycolytic promoters can decrease cell growth through attenuation in the availability of necessary transcription factors (Görgens, et al., 2001). This similar phenomenon was also seen in a recent scheme for titering promoter strength through transcription factor sequestration (Lee & Maheshri, 2012). Since promoter selection affects copy number, the choice of promoter should be closely correlated to the desired net expression output and other plasmid factors. In some cases, coupling different auxotrophic markers with lower strength promoters would be more beneficial than pairings with high-strength promoters. In order to decrease the effect of the promoter on the plasmid copy number, a lower strength promoter should be selected if possible; in this study the plasmid copy number was minimized in the strains with the No Promoter plasmid, followed by the CYC1 promoter and the GPD promoter.
Final considerations for designing plasmid systems
Growth rates in general appear to be lower for cells containing plasmids (Fig. 2). Moreover, there is correlation between growth rate and the additional base-pairs produced per cell, particularly for the diploid strain (Fig. 4). This suggests that there is a limit to the rate at which additional DNA can be produced before the growth rate is affected. However, the correlation is not particularly strong, especially at lower copy numbers and in haploid yeast. Furthermore, the trend does not hold for plasmids that show significant affects to growth rate and copy number due to the marker gene. For example, the 2μ LEU2-containing plasmids resulted in some of the lowest relative growth rates while also having a lower plasmid copy number than similar auxotrophic 2μ plasmids. Furthermore, while the relative growth rates of the haploid and diploid strains showed minor differences (Fig. 2a and b), the copy numbers of the plasmids in the diploid strain were double that of the haploid strain (Fig. 3a and b). This is congruent with previous studies that show plasmid copy number being proportional to ploidy (Futcher, et al., 1988), and that show copy numbers at similar values (Spalding & Tuite, 1989). Nevertheless, the extreme nucleotide load permitted within a cell without considerable decrease in growth rate is encouraging for large-scale metabolic engineering efforts. These results demonstrate that the addition of large DNA chunks (upward of a few percent of the genome in size) have only minor effects on the growth rate (only 20% reduction). This is also encouraging for synthetic biology approaches to introduce new or expanded chromosomes. Beyond the difference between haploid and diploid yeast, it can be expected that different strains of yeast may also have differential responses to both plasmids and auxotrophic markers that should be evaluated.
Based on the fact that the plasmid selection marker has such a large effect on growth rate and copy number, it can be expected that additional metabolic genes on the plasmid are also likely to result in a change in growth rate and copy number. In some cases, it has been observed that centromeric plasmids can result in higher heterologous protein expression than 2μ plasmids (Wittrup, et al., 1994). Researchers should therefore be cognizant of the effect of dosing when integrating additional genes into plasmid systems and expect changes in growth rate and plasmid gene expression as a result. Furthermore, these results demonstrate an interesting disconnect between plasmid-borne systems and integrated cassettes.
In conclusion, the many permutations of 2μ and centromeric plasmids available in S. cerevisiae are convenient, but can also result in many complications for researches trying to transform and control expression of heterologous genes. The convenience of different selection makers, promoters, and origins of replication must be tempered with an understanding of the affect each choice makes on the plasmid’s subsequent expression and contribution to cellular growth rate. The results of this study provide such a background so that researchers can begin to make informed decisions when designing plasmid systems for metabolic engineering applications.
Acknowledgments
We acknowledge an NSF Graduate Research Fellowship to K. Curran. This work was funded by the National Institute of General Medical Sciences of the National Institutes of Health under award number R01GM090221. The content is solely the responsibility of the authors and does not necessarily represent the official views of the National Institutes of Health.
References
- 1.Blazeck J, Liu L, Redden H, Alper H. Tuning gene expression in Yarrowia lipolytica by a hybrid promoter approach. Appl Environ Microbiol. 2011;77:7905–7914. doi: 10.1128/AEM.05763-11. [DOI] [PMC free article] [PubMed] [Google Scholar]
- 2.Blazeck J, Garg R, Reed B, Alper HS. Controlling promoter strength and regulation in Saccharomyces cerevisiae using synthetic hybrid promoters. Biotechnol Bioeng. 2012a;109:2884–2895. doi: 10.1002/bit.24552. [DOI] [PubMed] [Google Scholar]
- 3.Blazeck J, Reed B, Garg R, Gerstner R, Pan A, Agarwala V, Alper H. Generalizing a hybrid synthetic promoter approach Yarrowia lipolytica. Appl Microbiol Biotechnol. 2012b doi: 10.1007/s00253-012-4421-5. [DOI] [PubMed] [Google Scholar]
- 4.Blount Ba, Weenink T, Ellis T. Construction of synthetic regulatory networks in yeast. FEBS letters. 2012;586:2112–2121. doi: 10.1016/j.febslet.2012.01.053. [DOI] [PubMed] [Google Scholar]
- 5.Çakar ZP, Sauer U, Bailey JE. Metabolic engineering of yeast: the perils of auxotrophic hosts. Biotechnol Lett. 1999;21:611–616. [Google Scholar]
- 6.Chen Y, Partow S, Scalcinati G, Siewers V, Nielsen J. Enhancing the copy number of episomal plasmids in Saccharomyces cerevisiae for improved protein production. FEMS Yeast Res. 2012;12:598–607. doi: 10.1111/j.1567-1364.2012.00809.x. [DOI] [PubMed] [Google Scholar]
- 7.Christianson TW, Sikorski RS, Dante M, Shero JH, Hieter P. Multifunctional yeast high copy-number shuttle vectors. Gene. 1992;110:119–122. doi: 10.1016/0378-1119(92)90454-w. [DOI] [PubMed] [Google Scholar]
- 8.Crook NC, Freeman ES, Alper HS. Re-engineering multicloning sites for function and convenience. Nucleic Acids Res. 2011;39:e92. doi: 10.1093/nar/gkr346. [DOI] [PMC free article] [PubMed] [Google Scholar]
- 9.Curran KA, Alper HS. Expanding the chemical palate of cells by combining systems biology and metabolic engineering. Metab Eng. 2012;14:289–297. doi: 10.1016/j.ymben.2012.04.006. [DOI] [PubMed] [Google Scholar]
- 10.Da Silva NA, Srikrishnan S. Introduction and expression of genes for metabolic engineering applications in Saccharomyces cerevisiae. FEMS Yeast Res. 2012;12:197–214. doi: 10.1111/j.1567-1364.2011.00769.x. [DOI] [PubMed] [Google Scholar]
- 11.Dymond JS, Richardson SM, Coombes CE, et al. Synthetic chromosome arms function in yeast and generate phenotypic diversity by design. Nature. 2011;477:471–476. doi: 10.1038/nature10403. [DOI] [PMC free article] [PubMed] [Google Scholar]
- 12.Erhart E, Hollenberg CP. The presence of a defective LEU2 gene on 2 mu DNA recombinant plasmids of Saccharomyces cerevisiae is responsible for curing and high copy number. J Bacteriol. 1983;156:625–635. doi: 10.1128/jb.156.2.625-635.1983. [DOI] [PMC free article] [PubMed] [Google Scholar]
- 13.Futcher B, Reid E, Hickey DA. Maintenance of the 2 micron circle plasmid of Saccharomyces cerevisiae by sexual transmission: an example of a selfish DNA. Genetics. 1988;118:411–415. doi: 10.1093/genetics/118.3.411. [DOI] [PMC free article] [PubMed] [Google Scholar]
- 14.Gari E, Piedrafita L, Aldea M, Herrero E. A set of vectors with a tetracycline-regulatable promoter system for modulated gene expression in Saccharomyces cerevisiae. Yeast. 1997;13:837–848. doi: 10.1002/(SICI)1097-0061(199707)13:9<837::AID-YEA145>3.0.CO;2-T. [DOI] [PubMed] [Google Scholar]
- 15.Gatignol A, Dassain M, Tiraby G. Cloning of Saccharomyces cerevisiae promoters using a probe vector based on phleomycin resistance. Gene. 1990;91:35–41. doi: 10.1016/0378-1119(90)90159-o. [DOI] [PubMed] [Google Scholar]
- 16.Giaever G, Chu AM, Ni L, et al. Functional profiling of the Saccharomyces cerevisiae genome. Nature. 2002;418:387–391. doi: 10.1038/nature00935. [DOI] [PubMed] [Google Scholar]
- 17.Goldstein aL, McCusker JH. Three new dominant drug resistance cassettes for gene disruption in Saccharomyces cerevisiae. Yeast. 1999;15:1541–1553. doi: 10.1002/(SICI)1097-0061(199910)15:14<1541::AID-YEA476>3.0.CO;2-K. [DOI] [PubMed] [Google Scholar]
- 18.Görgens JF, van Zyl WH, Knoetze JH, Hahn-Hägerdal B. The metabolic burden of the PGK1 and ADH2 promoter systems for heterologous xylanase production by Saccharomyces cerevisiae in defined medium. Biotechnol Bioeng. 2001;73:238–245. doi: 10.1002/bit.1056. [DOI] [PubMed] [Google Scholar]
- 19.Hinnen A, Hicks JB, Fink GR. Transformation of yeast. Proc Natl Acad Sci U S A. 1978;75:1929–1933. doi: 10.1073/pnas.75.4.1929. [DOI] [PMC free article] [PubMed] [Google Scholar]
- 20.Hong K-K, Nielsen J. Metabolic engineering of Saccharomyces cerevisiae: a key cell factory platform for future biorefineries. Cell Mol Life Sci. 2012;69:2671–2690. doi: 10.1007/s00018-012-0945-1. [DOI] [PMC free article] [PubMed] [Google Scholar]
- 21.Hu XH, Wang MH, Tan T, Li JR, Yang H, Leach L, Zhang RM, Luo ZW. Genetic dissection of ethanol tolerance in the budding yeast Saccharomyces cerevisiae. Genetics. 2007;175:1479–1487. doi: 10.1534/genetics.106.065292. [DOI] [PMC free article] [PubMed] [Google Scholar]
- 22.Krivoruchko A, Siewers V, Nielsen J. Opportunities for yeast metabolic engineering: Lessons from synthetic biology. Biotechnol J. 2011;6:262–276. doi: 10.1002/biot.201000308. [DOI] [PubMed] [Google Scholar]
- 23.Kumar a, Snyder M. Emerging technologies in yeast genomics. Nature Rev Genet. 2001;2:302–312. doi: 10.1038/35066084. [DOI] [PubMed] [Google Scholar]
- 24.Lee T-H, Maheshri N. A regulatory role for repeated decoy transcription factor binding sites in target gene expression. Mol Syst Biol. 2012;8:576. doi: 10.1038/msb.2012.7. [DOI] [PMC free article] [PubMed] [Google Scholar]
- 25.Li A, Liu Z, Li Q, Yu L, Wang D, Deng X. Construction and characterization of bidirectional expression vectors in Saccharomyces cerevisiae. FEMS Yeast Res. 2008;8:6–9. doi: 10.1111/j.1567-1364.2007.00335.x. [DOI] [PubMed] [Google Scholar]
- 26.Lu C, Jeffries T. Shuffling of promoters for multiple genes to optimize xylose fermentation in an engineered Saccharomyces cerevisiae strain. Appl Environ Microbiol. 2007;73:6072–6077. doi: 10.1128/AEM.00955-07. [DOI] [PMC free article] [PubMed] [Google Scholar]
- 27.Moriya H, Shimizu-Yoshida Y, Kitano H. In vivo robustness analysis of cell division cycle genes in Saccharomyces cerevisiae. PLoS Genet. 2006;2:e111. doi: 10.1371/journal.pgen.0020111. [DOI] [PMC free article] [PubMed] [Google Scholar]
- 28.Mumberg D, Muller R, Funk M. Yeast vectors for the controlled expression of heterologous proteins in different genetic backgrounds. Gene. 1995;156:119–122. doi: 10.1016/0378-1119(95)00037-7. [DOI] [PubMed] [Google Scholar]
- 29.Nevoigt E. Progress in metabolic engineering of Saccharomyces cerevisiae. Microbiol Mol Bio R. 2008;72:379–412. doi: 10.1128/MMBR.00025-07. [DOI] [PMC free article] [PubMed] [Google Scholar]
- 30.Sambrook J, Russell DW. Molecular Cloning: A Laboratory Manual. Cold Spring Harbor Laboratory Press; 2001. [Google Scholar]
- 31.Sikorski RS, Hieter P. A system of shuttle vectors and yeast host strains designed for efficient manipulation of DNA in Saccharomyces cerevisiae. Genetics. 1989;122:19–27. doi: 10.1093/genetics/122.1.19. [DOI] [PMC free article] [PubMed] [Google Scholar]
- 32.Spalding A, Tuite MF. Host-Plasmid Interactions in Saccharomyces cerevisiae: Effect of Host Ploidy on Plasmid Stability and Copy Number. J Gen Microbiol. 1989;135:1037–1045. doi: 10.1099/00221287-135-4-1037. [DOI] [PubMed] [Google Scholar]
- 33.Spellman PT, Sherlock G, Zhang MQ, Iyer VR, Anders K, Eisen MB, Brown PO, Botstein D, Futcher B. Comprehensive Identification of Cell Cycle–regulated Genes of the Yeast Saccharomyces cerevisiae by Microarray Hybridization. Mol Biol Cell. 1998;9:3273–3297. doi: 10.1091/mbc.9.12.3273. [DOI] [PMC free article] [PubMed] [Google Scholar]
- 34.Sun J, Shao Z, Zhao H, Nair N, Wen F, Xu JH. Cloning and characterization of a panel of constitutive promoters for applications in pathway engineering in Saccharomyces cerevisiae. Biotechnol Bioeng. 2012;109:2082–2092. doi: 10.1002/bit.24481. [DOI] [PubMed] [Google Scholar]
- 35.Wach A, Brachat A, Pöhlmann R, Philippsen P. New heterologous modules for classical or PCR-based gene disruptions in Saccharomyces cerevisiae. Yeast. 1994;10:1793–1808. doi: 10.1002/yea.320101310. [DOI] [PubMed] [Google Scholar]
- 36.Wittrup KD, Robinson AS, Parekh RN, Forrester KJ. Existence of an Optimum Expression Level for Secretion of Foreign Proteins in Yeast. Ann NY Acad Sci. 1994;745:321–330. doi: 10.1111/j.1749-6632.1994.tb44385.x. [DOI] [PubMed] [Google Scholar]
- 37.Young E, Alper H. Synthetic Biology: Tools to Design, Build, and Optimize Cellular Processes. J Biomed Biotechnol. 2010;2010:130781. doi: 10.1155/2010/130781. [DOI] [PMC free article] [PubMed] [Google Scholar]